. 2023 Apr 6;12(7):1093.
doi: 10.3390/cells12071093.

Integrated Placental Modelling of Histology with Gene Expression to Identify Functional Impact on Fetal Growth

Affiliations

Integrated Placental Modelling of Histology with Gene Expression to Identify Functional Impact on Fetal Growth

Hannah Ee Juen Yong et al. Cells. .

Abstract

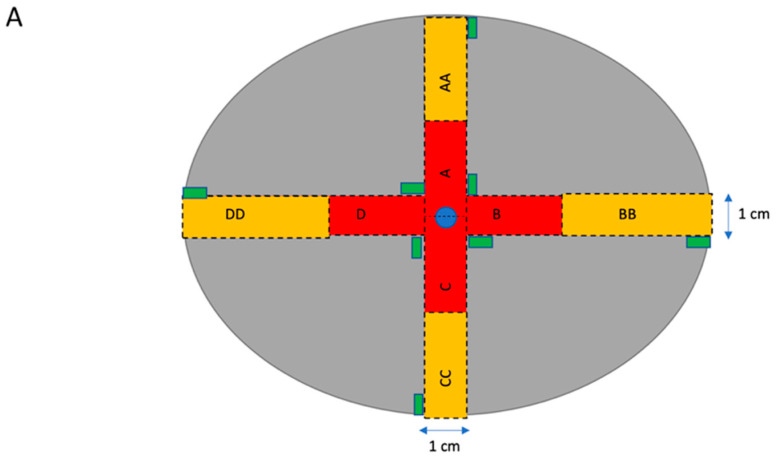
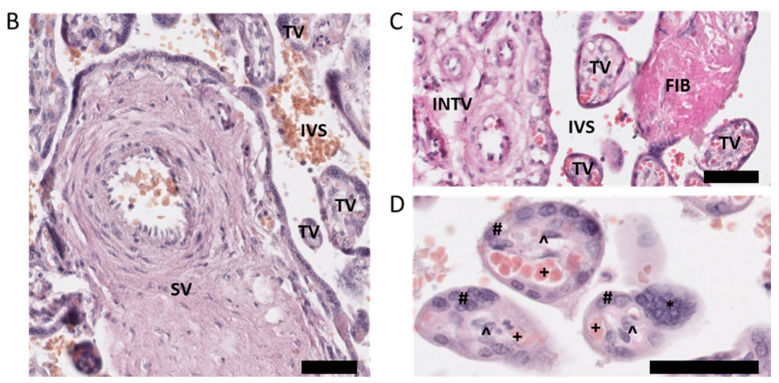
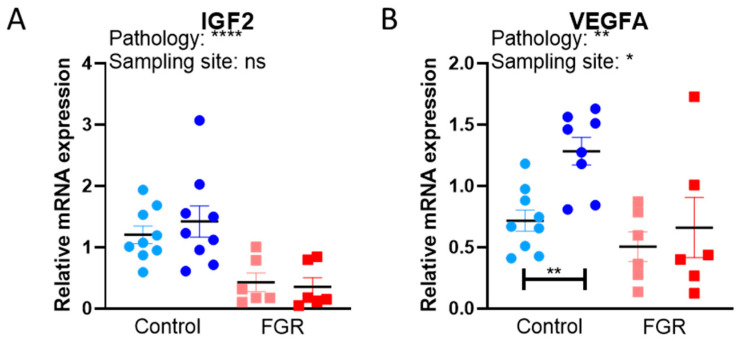
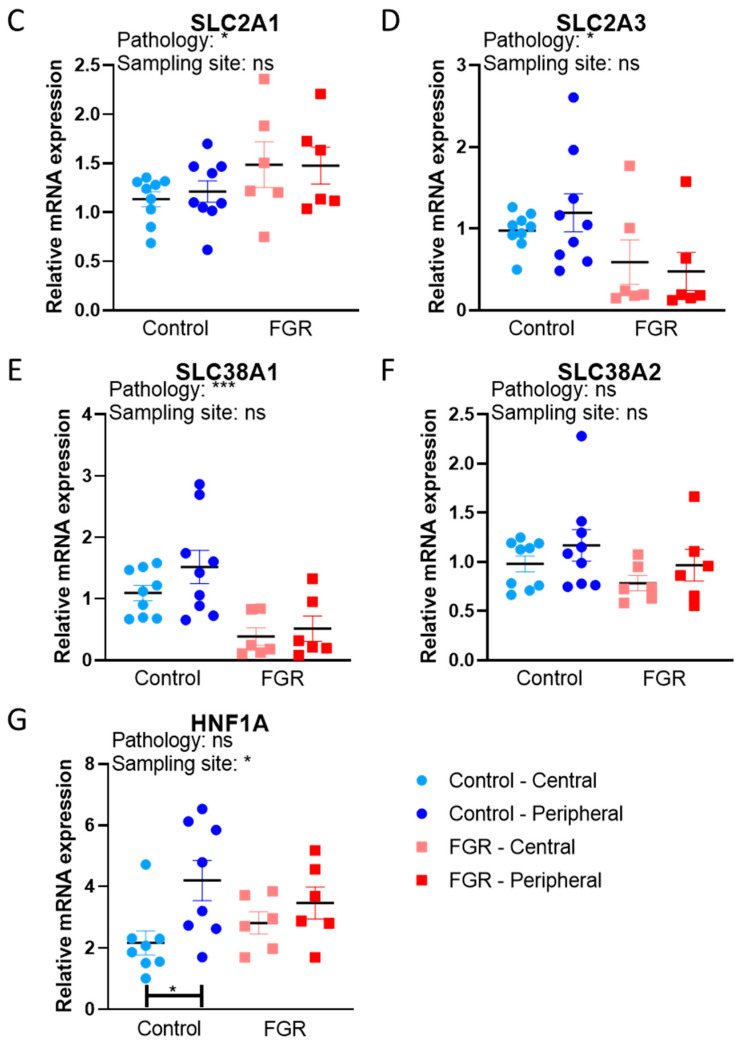
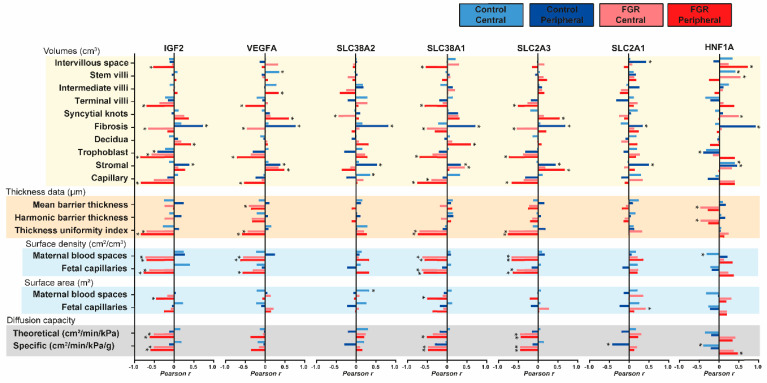
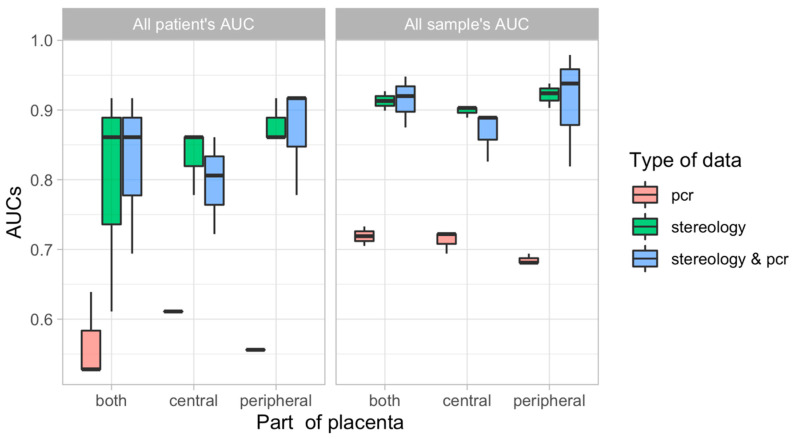
Fetal growth restriction (FGR) is a leading cause of perinatal morbidity and mortality. Altered placental formation and functional capacity are major contributors to FGR pathogenesis. Relating placental structure to function across the placenta in healthy and FGR pregnancies remains largely unexplored but could improve understanding of placental diseases. We investigated integration of these parameters spatially in the term human placenta using predictive modelling. Systematic sampling was able to overcome heterogeneity in placental morphological and molecular features. Defects in villous development, elevated fibrosis, and reduced expression of growth and functional marker genes (IGF2, VEGA, SLC38A1, and SLC2A3) were seen in age-matched term FGR versus healthy control placentas. Characteristic histopathological changes with specific accompanying molecular signatures could be integrated through computational modelling to predict if the placenta came from a healthy or FGR pregnancy. Our findings yield new insights into the spatial relationship between placental structure and function and the etiology of FGR.

Keywords: FGR; growth genes; modelling; morphology; placenta; transport.


Conflict of interest statement

The authors declare no conflict of interest.

Figures

Figure 1
Figure 1
Diagram showing sampling of placenta (A) and main parameters measured in histological sections of placenta (BD). (A) Dotted lines indicate where the placenta should be cut with a sterile histology knife. Red boxes with single letters indicate inner sections. Yellow boxes with double letters indicate outer sections. Green rectangles represent samples taken for RNA sampling. The central blue circle represents the umbilical cord (cut). (BD) Representative histological sections of term human placenta. Stereological analysis was performed by identifying the intervillous space (IVS), stem villi (SV), intermediate villi (INTV), terminal villi (TV), fibrosis (FIB), and syncytial knots (*); and, under higher magnification of terminal villi, the trophoblast cell layer (#), fetal capillaries (+), and stromal cells (^). The scale bar denotes 50 µm.
Figure 1
Figure 1
Diagram showing sampling of placenta (A) and main parameters measured in histological sections of placenta (BD). (A) Dotted lines indicate where the placenta should be cut with a sterile histology knife. Red boxes with single letters indicate inner sections. Yellow boxes with double letters indicate outer sections. Green rectangles represent samples taken for RNA sampling. The central blue circle represents the umbilical cord (cut). (BD) Representative histological sections of term human placenta. Stereological analysis was performed by identifying the intervillous space (IVS), stem villi (SV), intermediate villi (INTV), terminal villi (TV), fibrosis (FIB), and syncytial knots (*); and, under higher magnification of terminal villi, the trophoblast cell layer (#), fetal capillaries (+), and stromal cells (^). The scale bar denotes 50 µm.
Figure 2
Figure 2
Relative mRNA expression of selected growth factors and nutrient transporters in control and FGR placentas. Expression of (A,B) growth factors (IGF2 and VEGFA), and (CF) transporters (SLC2A1, SLC2A3, SLC38A1, and SLC38A2) and the (G) transcription factor (HNF1A), were evaluated by qPCR. A total of three outliers were excluded; one control peripheral value for VEGFA and one control central value and one control peripheral value for HNF1A. Data are presented with individual data points with mean ± SEM and analyzed with two-way ANOVA, followed by Sidak’s post hoc test for multiple comparisons. * p < 0.05, ** p < 0.01, *** p < 0.001, **** p < 0.0001, ns = not significant.
Figure 2
Figure 2
Relative mRNA expression of selected growth factors and nutrient transporters in control and FGR placentas. Expression of (A,B) growth factors (IGF2 and VEGFA), and (CF) transporters (SLC2A1, SLC2A3, SLC38A1, and SLC38A2) and the (G) transcription factor (HNF1A), were evaluated by qPCR. A total of three outliers were excluded; one control peripheral value for VEGFA and one control central value and one control peripheral value for HNF1A. Data are presented with individual data points with mean ± SEM and analyzed with two-way ANOVA, followed by Sidak’s post hoc test for multiple comparisons. * p < 0.05, ** p < 0.01, *** p < 0.001, **** p < 0.0001, ns = not significant.
Figure 3
Figure 3
Correlations between stereological parameters and the relative expression of functional genes in the placenta. Pearson’s r coefficient was plotted and used to indicate strength of relationship between data (0: low, 1: high) and direction of correlation (+ sign: direct correlation and–sign: inverse correlation). Analysis was performed on each sampling site and experimental group (control and FGR) separately. Sample size was 36 for control and 24 for FGR. *: p < 0.05, correlation is statistically significant.
Figure 4
Figure 4
Distributions of AUCs, i.e., the performance results of different types of models on different types of data obtained on different parts of the placenta for all patients and for all their measurements separately.

Similar articles

Cited by

References

    1. Napso T., Yong H.E., Lopez-Tello J., Sferruzzi-Perri A.N. The role of placental hormones in mediating maternal adaptations to support pregnancy and lactation. Front. Physiol. 2018;9:91. doi: 10.3389/fphys.2018.01091. - DOI - PMC - PubMed
    1. Burton G.J., Fowden A.L., Thornburg K.L. Placental Origins of Chronic Disease. Physiol. Rev. 2016;96:1509–1565. doi: 10.1152/physrev.00029.2015. - DOI - PMC - PubMed
    1. Byrne M., Aughwane R., James J.L., Hutchinson J.C., Arthurs O.J., Sebire N.J., Ourselin S., David A.L., Melbourne A., Clark A.R. Structure-function relationships in the feto-placental circulation from in silico interpretation of micro-CT vascular structures. J. Biol. 2021;517:110630. doi: 10.1016/j.jtbi.2021.110630. - DOI - PMC - PubMed
    1. Aughwane R., Schaaf C., Hutchinson J.C., Virasami A., Zuluaga M.A., Sebire N., Arthurs O.J., Vercauteren T., Ourselin S., Melbourne A., et al. Micro-CT and histological investigation of the spatial pattern of feto-placental vascular density. Placenta. 2019;88:36–43. doi: 10.1016/j.placenta.2019.09.014. - DOI - PMC - PubMed
    1. World Health Organization . Every Newborn: An Action Plan to End Preventable Deaths. World Health Organization; Geneva, Switzerland: 2014.

Publication types