. 2023 Mar 23;12(7):1361.
doi: 10.3390/foods12071361.

Proposal and Verification of the Theory of Layer-by-Layer Elimination of Biofilm in Listeria monocytogenes

Affiliations

Proposal and Verification of the Theory of Layer-by-Layer Elimination of Biofilm in Listeria monocytogenes

Jialin He et al. Foods. .

Abstract

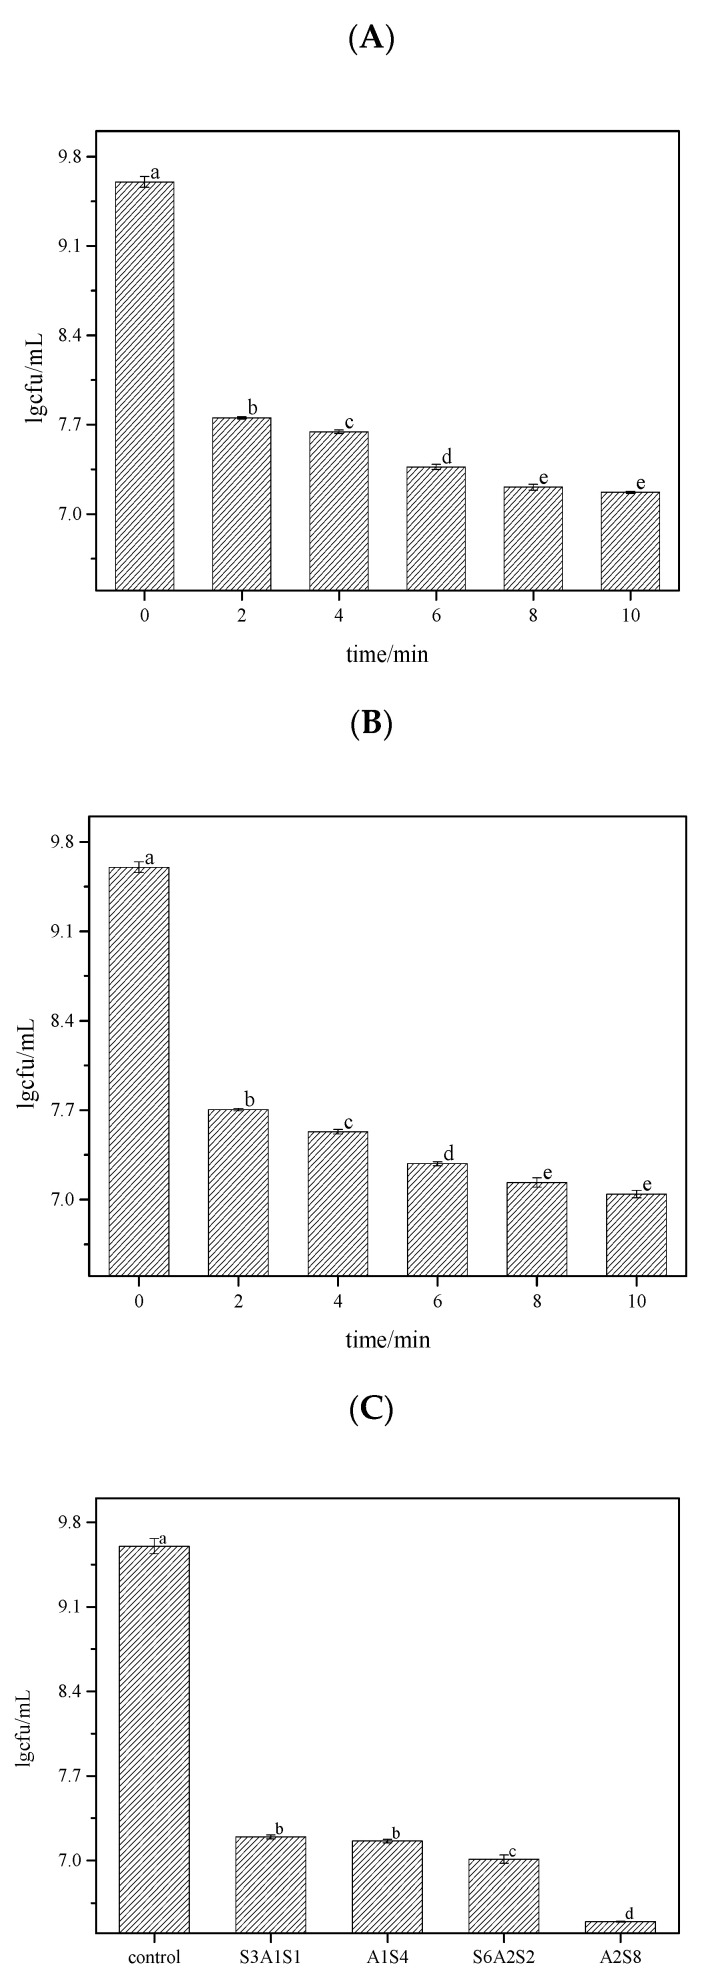
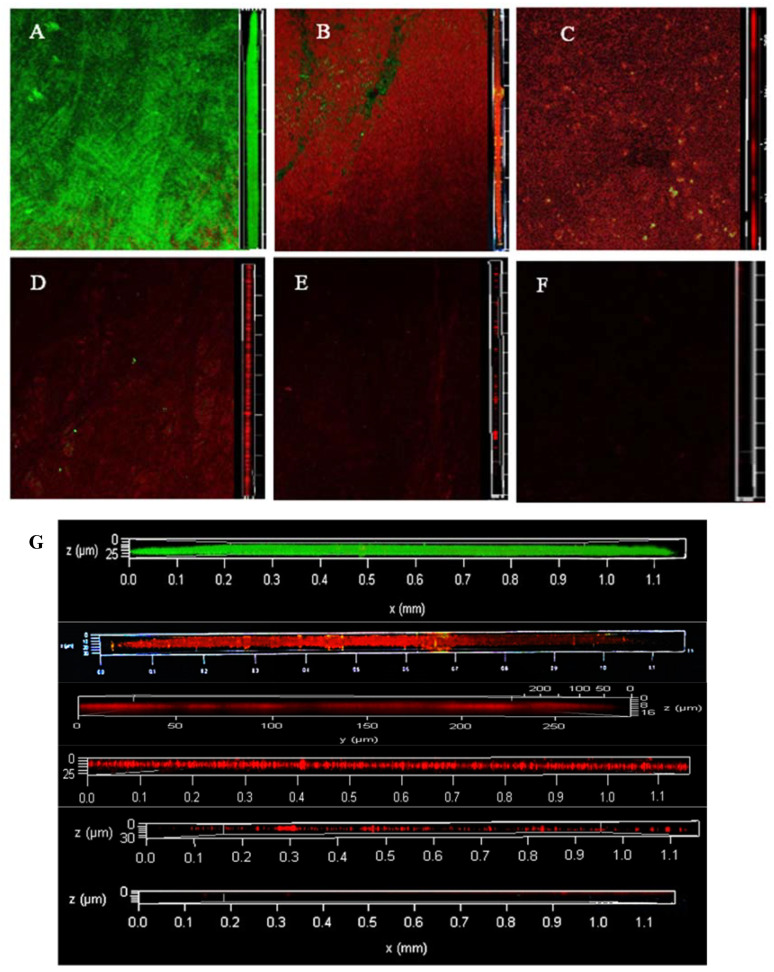
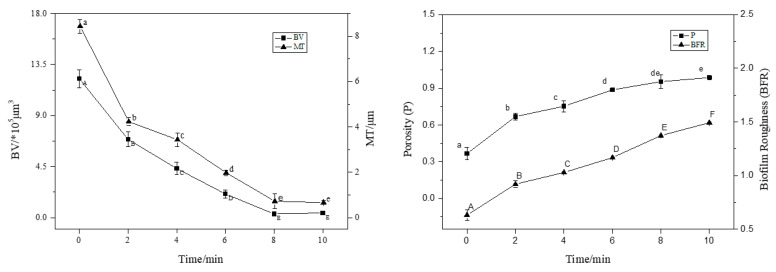
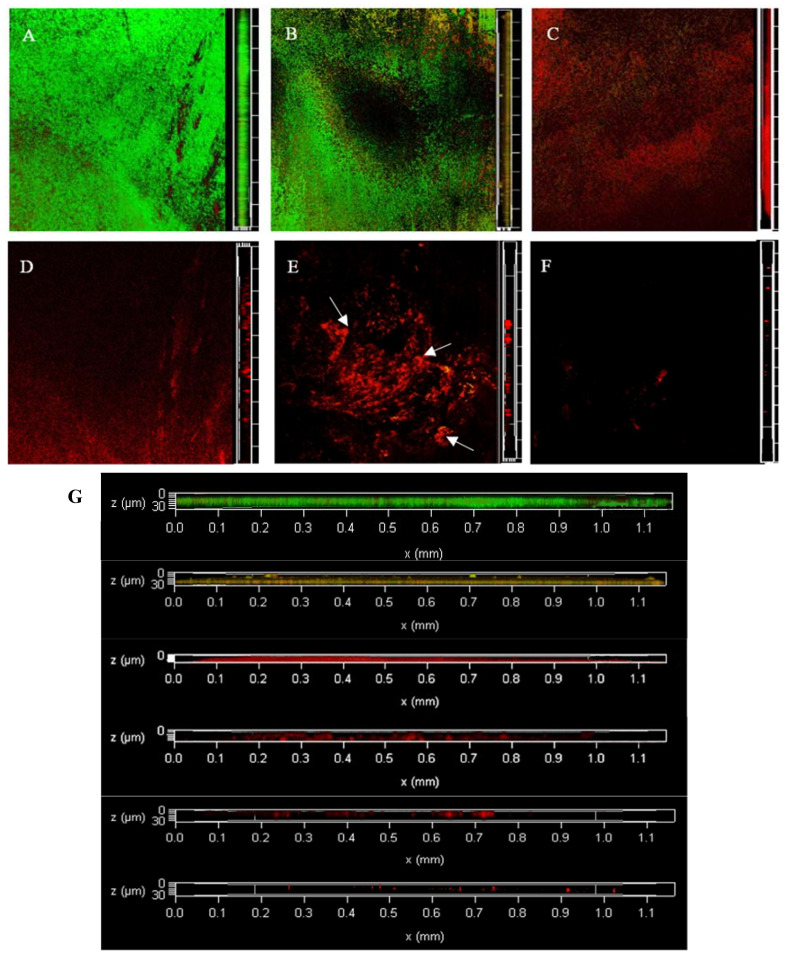
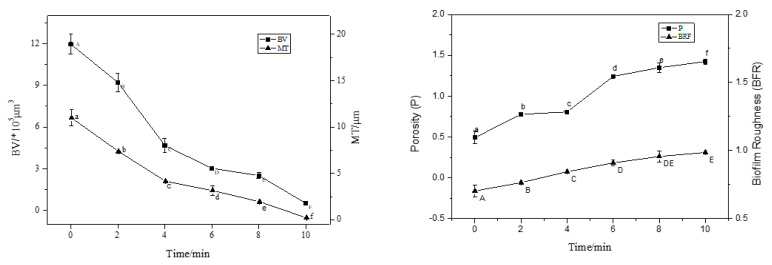
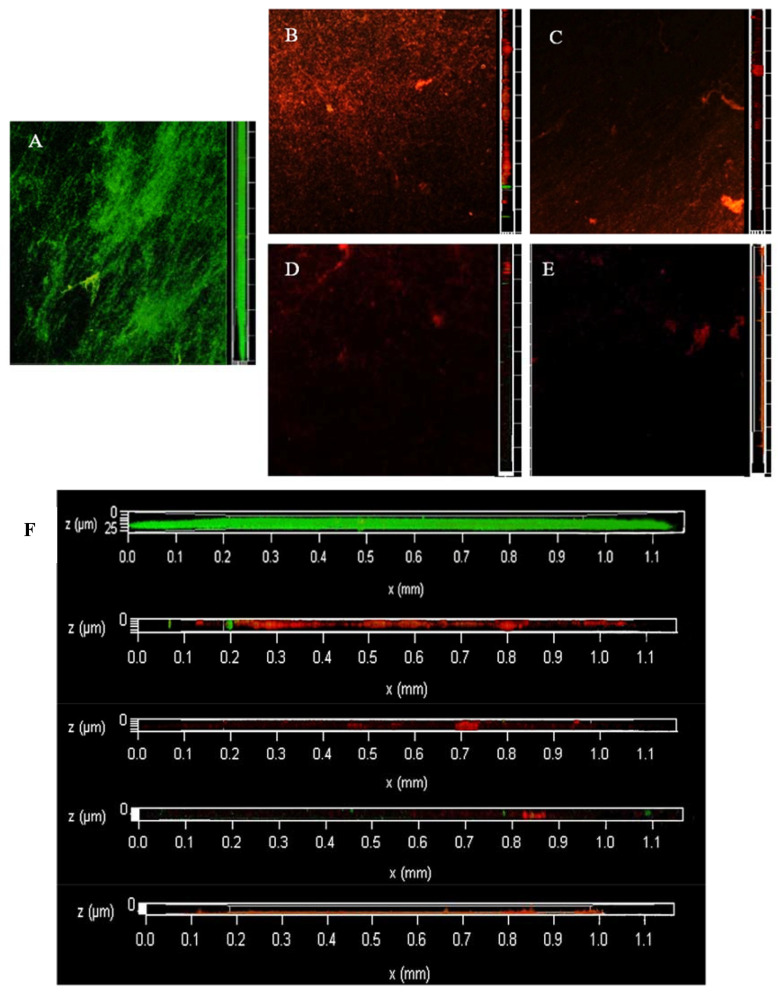
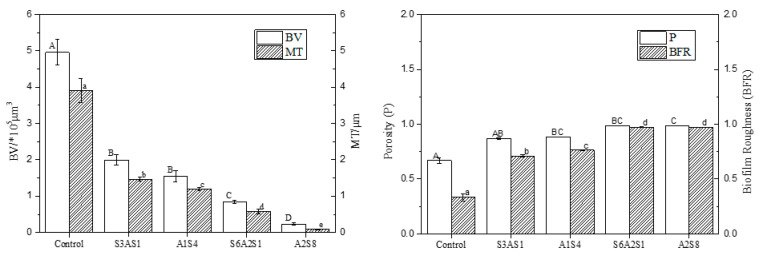
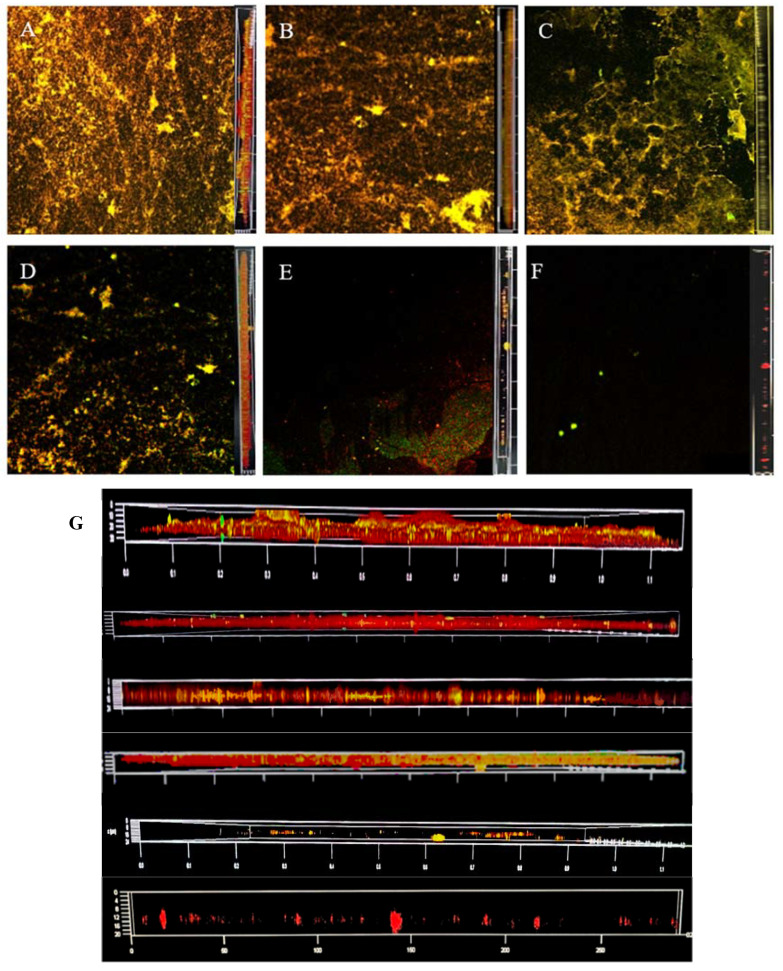
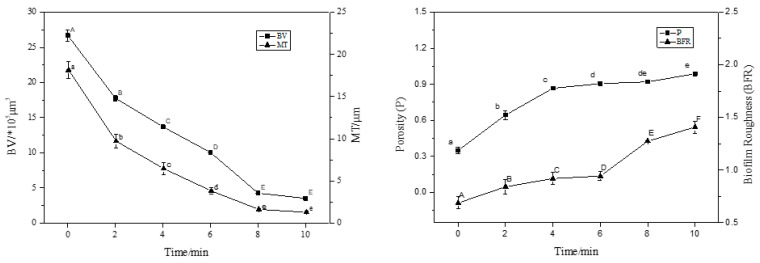
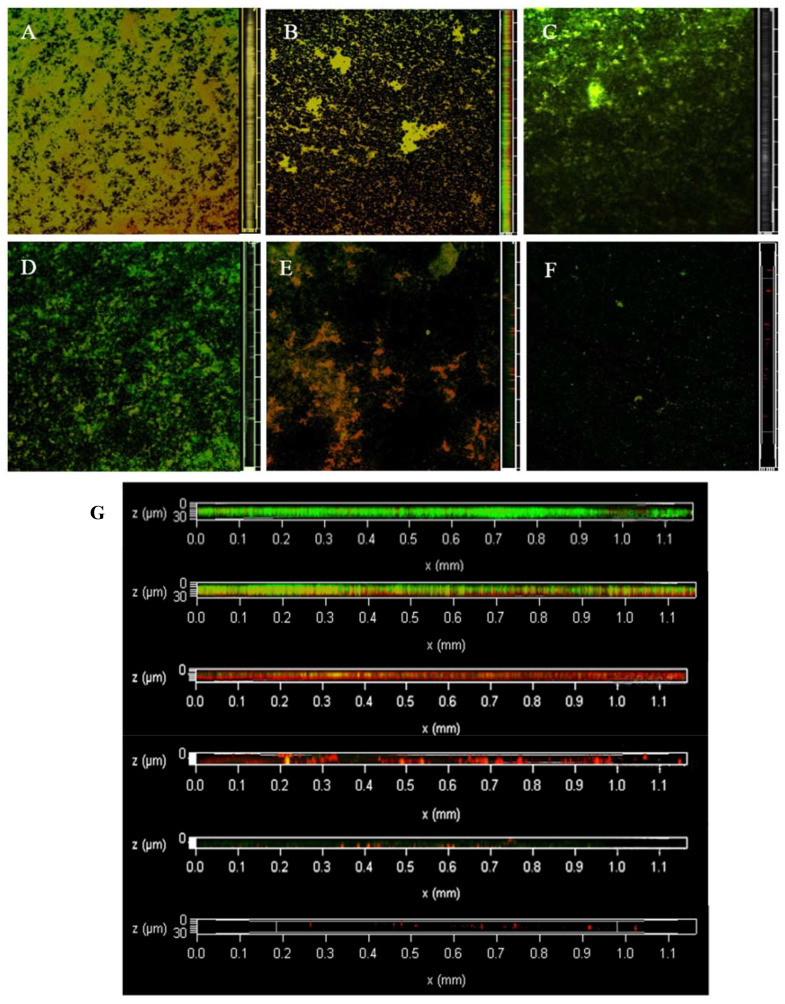
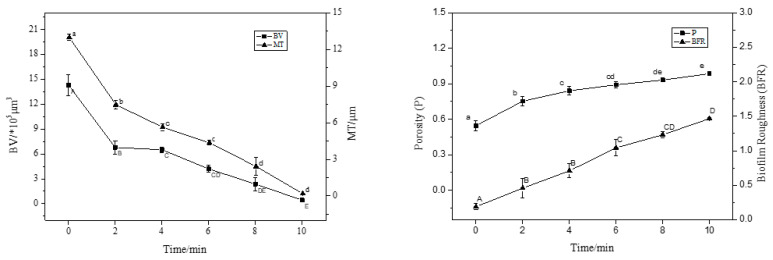
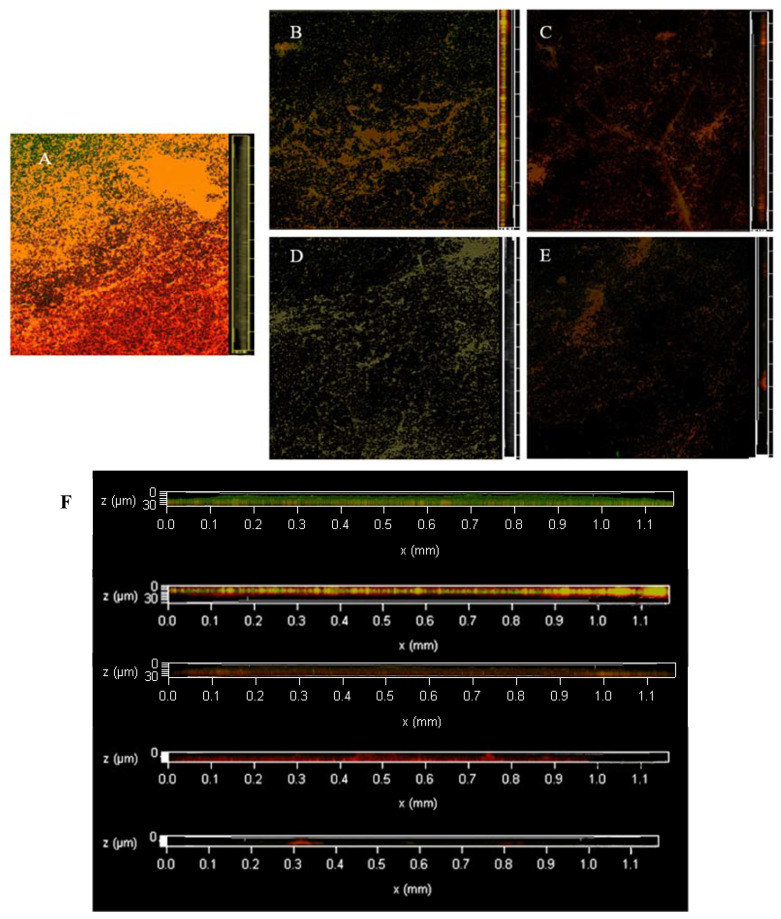
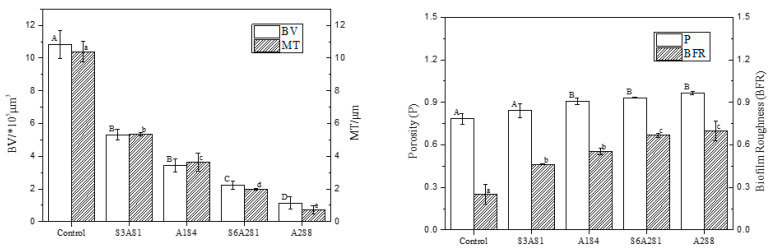
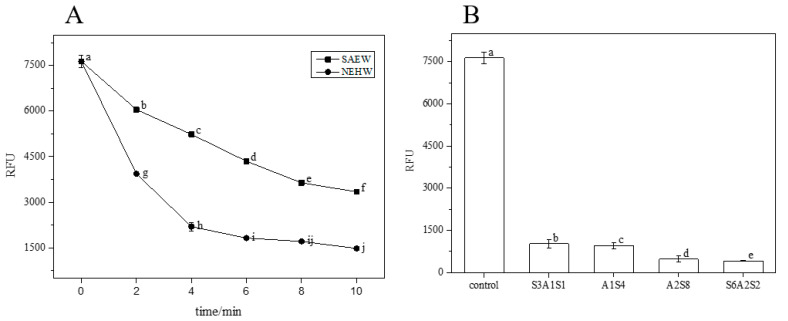
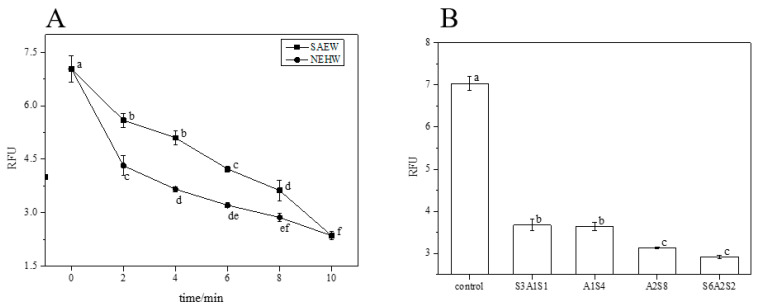
Biofilms are microbial communities that represent a high abundance of microbial life forms on Earth. Within biofilms, structural changes during clearance processes occur in three spatial and temporal dimensions; therefore, microscopy and quantitative image analysis are essential in elucidating their function. Here, we present confocal laser scanning microscopy (CLSM) in conjunction with ISA-2 software analysis for the automated and high-throughput quantification, analysis, and visualisation of biofilm interiors and overall biofilm properties in three spatial and temporal dimensions. This paper discusses the removal process of Listeria monocytogenes (LM) biofilms using slightly acidic electrolytic water, non-electrolytic hypochlorite water, and alternating the use of strongly acidic and strongly alkaline electrolytic water. The results show that the biofilm gradually thins and gutters from the initial viscous dense and thick morphology under the action of either biocide. This process is consistent with first-level kinetics. After CLSM filming to observe the biofilm structure, analysis software was used to process and quantify the biovolume, average biofilm thickness, biofilm roughness and other indicators; fluorescence enzyme markers were used to verify the remaining amount of extracellular nucleic acid. In this study, we proposed and validated the theory of layer-by-layer elimination of LM biofilm.

Keywords: Listeria monocytogenes; biofilms; confocal laser scanning microscopy; electrolysed water; layer-by-layer elimination.


Conflict of interest statement

The authors declare no competing financial or non-financial Interest.

Figures

Figure 1
Figure 1
The bactericidal rate of each treatment was determined by the coated plate method after treating LM biofilm with three groups of bactericides for different times. The different letters indicate significant differences (p < 0.05). Data were expressed by mean measurements ± standard deviation (SD), and all treatments and determinations were performed in triplicate. (A) is the bactericidal rate of SAEW. (B) is the bactericidal rate of NEHW. (C) is the bactericidal rate of AEW and ALEW. SAEW was the abbreviation of slightly acidic electrolytic water, and NEHW was the abbreviation of non-electrolytic hypochlorite water. In A1S4, A2S8, S3A1S1, and S6A2S2 treatment, S stands for strongly acidic electrolytic water, A stands for strongly alkaline electrolytic water, and the number represents the action time.
Figure 2
Figure 2
The changes of viable and dead colonies in LM biofilm after SAEW treatment observed by CLSM; each sample randomly selects three visual fields. Images include front and side views of the biofilm under CLSM. Scale bar—100 µm. (AF) represent the dead or alive status of the remaining bacteria after 0, 2, 4, 6, 8 and 10 min of treatment, respectively. (G) is an enlarged version of all the images on the right and is also a right-hand view of the biofilm, from top to bottom, for SAEW treatments 0, 2, 4, 6, 8 and 10 min respectively. SAEW was the abbreviation of slightly acidic electrolytic water. Green—live cells, red—dead cells.
Figure 3
Figure 3
The CLSM images analysed by ISA-2 software to determine the biovolume (BV), mean thickness (MT), porosity (P) and biofilm roughness (BFR) of the biofilm. Data were expressed by mean measurements ± standard deviation (SD), and all treatments and determinations were performed in triplicate. The different letters indicate significant differences (p < 0.05).
Figure 4
Figure 4
The changes of viable and dead colonies in LM biofilm after NEHW treatment observed by CLSM; each sample randomly selects three visual fields. Images include front and side views of the biofilm under CLSM. Scale bar—100 µm. (AF) represent the dead or alive status of the remaining bacteria after 0, 2, 4, 6, 8 and 10 min of treatment, respectively. (G) is an enlarged version of all the images on the right and is also a right-hand view of the biofilm, from top to bottom, for NEHW treatments 0, 2, 4, 6, 8 and 10 min respectively. NEHW was the abbreviation of non-electrolytic hypochlorite water. Green—live cells, red—dead cells. The arrows point to areas of denser biofilm.
Figure 5
Figure 5
The CLSM images analysed by ISA-2 software to determine the biovolume (BV), mean thickness (MT), porosity (P) and biofilm roughness (BFR) of the biofilm. Data were expressed by mean measurements ± standard deviation (SD), and all treatments and determinations were performed in triplicate. The different letters indicate significant differences (p < 0.05).
Figure 6
Figure 6
The changes of viable and dead colonies in LM biofilm after AEW and ALEW treatment observed by CLSM; each sample randomly selects three visual fields. Images include front and side views of the biofilm under CLSM. Scale bar—100 µm. (A) is control, (B) is S3A1S1 treatment, (C) is A1S4 treatment, (D) is S6A2S2 treatment, and (E) is A2S8 treatment. (F) is an enlarged version of all the images on the right and is also a right-hand view of the biofilm, from top to bottom, for AEW and NEHW treatments 0, 2, 4, 6, 8 and 10 min respectively. Green—live cells, red—dead cells. AEW was acidic electrolytic water, and ALEW was alkaline electrolysed water.
Figure 7
Figure 7
The CLSM images analysed by ISA-2 software to determine the biovolume (BV), mean thickness (MT), porosity (P) and biofilm roughness (BFR) of the biofilm. Data were expressed by mean measurements ± standard deviation (SD) and all treatments and determinations were performed in triplicate. The different letters indicate significant differences (p < 0.05).
Figure 8
Figure 8
The changes of eDNA and eRNA in LM biofilm after SAEW treatment observed by CLSM; each sample randomly selects three visual fields. Images include front and side views of the biofilm under CLSM. Scale bar—100 µm. (AF) represent treatment 0, 2, 4, 6, 8, 10 min, respectively. (G) is an enlarged version of all the images on the right and is also a right-hand view of the biofilm, from top to bottom, for SAEW treatments 0, 2, 4, 6, 8 and 10 min respectively. SAEW was the abbreviation of slightly acidic electrolytic water.
Figure 9
Figure 9
The CLSM images analysed by ISA-2 software to determine the biovolume (BV), mean thickness (MT), porosity (P) and biofilm roughness (BFR) of the biofilm. Data were expressed by mean measurements ± standard deviation (SD) and all treatments and determinations were performed in triplicate. The different letters indicate significant differences (p < 0.05).
Figure 10
Figure 10
The changes of eDNA and eRNA in LM biofilm after NEHW treatment observed by CLSM; each sample randomly selects three visual fields. Images include front and side views of the biofilm under CLSM. Scale bar—100 µm. (AF) represent treatment times of 0, 2, 4, 6, 8, and 10 min, respectively. (G) is an enlarged version of all the images on the right and is also a right-hand view of the biofilm, from top to bottom, for SAEW treatments 0, 2, 4, 6, 8 and 10 min respectively. NEHW was the abbreviation of non-electrolytic hypochlorite water.
Figure 11
Figure 11
The CLSM images analysed by ISA-2 software to determine the biovolume (BV), mean thickness (MT), porosity (P) and biofilm roughness (BFR) of the biofilm. Data were expressed by mean measurements ± standard deviation (SD) and all treatments and determinations were performed in triplicate. The different letters indicate significant differences (p < 0.05).
Figure 12
Figure 12
The changes of eDNA and eRNA in LM biofilm after AEW and ALEW treatment observed by CLSM; each sample randomly selects three visual fields. Images include front and side views of the biofilm under CLSM. Scale bar—100 µm. (A) is control, (B) is S3A1S1 treatment, (C) is A1S4 treatment, (D) is S6A2S2 treatment, and (E) is A2S8 treatment. (F) is an enlarged version of all the images on the right and is also a right-hand view of the biofilm, from top to bottom, for AEW and NEHW treatments 0, 2, 4, 6, 8 and 10 min respectively. AEW was acidic electrolytic water, and ALEW was alkaline electrolysed water.
Figure 13
Figure 13
The CLSM images analysed by ISA-2 software to determine the biovolume (BV), mean thickness (MT), porosity (P) and biofilm roughness (BFR) of the biofilm. Data were expressed by mean measurements ± standard deviation (SD) and all treatments and determinations were performed in triplicate. The different letters indicate significant differences (p < 0.05).
Figure 14
Figure 14
The RFU of residual eDNA content in each treatment. (A) is the RFU of residual eDNA after SAEW and NEHW treatment. (B) is the RFU of residual eDNA after AEW and ALEW treatment. The different letters indicate significant differences (p < 0.05). Data were expressed by mean measurements ± standard deviation (SD) and all treatments and determinations were performed in triplicate.
Figure 15
Figure 15
The RFU of residual eRNA content in each treatment group. (A) is the RFU of residual eRNA after SAEW and NEHW treatment. (B) is the RFU of residual eDNA after AEW and ALEW treatment. The different letters indicate significant differences (p < 0.05). Data were expressed by mean measurements ± standard deviation (SD) and all treatments and determinations were performed in triplicate.

Similar articles

References

    1. Liu Y., Sun W., Sun T., Gorris L.G.M., Wang X., Liu B., Dong Q. The prevalence of Listeria monocytogenes in meat products in China: A systematic literature review and novel meta-analysis approach. Int. J. Food Microbiol. 2020;312:108358. doi: 10.1016/j.ijfoodmicro.2019.108358. - DOI - PubMed
    1. Roy R., Tiwari M., Donelli G., Tiwari V. Strategies for combating bacterial biofilms: A focus on anti-biofilm agents and their mechanisms of action. Virulence. 2018;9:522–554. doi: 10.1080/21505594.2017.1313372. - DOI - PMC - PubMed
    1. Décard B., Thne J., Haghikia A., Brnke C., Anders A., Lukas C., Gold R. Listeria rhombencephalitis mimicking a demyelinating event in an immunocompetent young patient. SAGE Publ. 2017;23:123–125. doi: 10.1177/1352458516650522. - DOI - PubMed
    1. Ireton K., Mortuza R., Gyanwali G.C., Gianfelice A., Hussain M. Role of internalin proteins in the pathogenesis of Listeria monocytogenes. Mol. Microbiol. 2021;116:1407–1419. doi: 10.1111/mmi.14836. - DOI - PubMed
    1. Disson O., Moura A., Lecuit M. Making Sense of the Biodiversity and Virulence of Listeria monocytogenes—ScienceDirect. Trends Microbiol. 2021;29:811–822. doi: 10.1016/j.tim.2021.01.008. - DOI - PubMed

LinkOut - more resources