An Initial Study on the Use of Machine Learning and Radio Frequency Identification Data for Predicting Health Outcomes in Free-Range Laying Hens
- PMID: 37048458
- PMCID: PMC10093333
- DOI: 10.3390/ani13071202
An Initial Study on the Use of Machine Learning and Radio Frequency Identification Data for Predicting Health Outcomes in Free-Range Laying Hens
Abstract
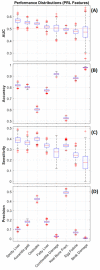
Maintaining the health and welfare of laying hens is key to achieving peak productivity and has become significant for assuring consumer confidence in the industry. Free-range egg production systems represent diverse environments, with a range of challenges that undermine flock performance not experienced in more conventional production systems. These challenges can include increased exposure to parasites and bacterial or viral infection, along with injuries and plumage damage resulting from increased freedom of movement and interaction with flock-mates. The ability to forecast the incidence of these health challenges across the production lifecycle for individual laying hens could result in an opportunity to make significant economic savings. By delivering the opportunity to reduce mortality rates and increase egg laying rates, the implementation of flock monitoring systems can be a viable solution. This study investigates the use of Radio Frequency Identification technologies (RFID) and machine learning to identify production system usage patterns and to forecast the health status for individual hens. Analysis of the underpinning data is presented that focuses on identifying correlations and structure that are significant for explaining the performance of predictive models that are trained on these challenging, highly unbalanced, datasets. A machine learning workflow was developed that incorporates data resampling to overcome the dataset imbalance and the identification/refinement of important data features. The results demonstrate promising performance, with an average 28% of Spotty Liver Disease, 33% round worm, and 33% of tape worm infections correctly predicted at the end of production. The analysis showed that monitoring hens during the early stages of egg production shows similar performance to models trained with data obtained at later periods of egg production. Future work could improve on these initial predictions by incorporating additional data streams to create a more complete view of flock health.
Keywords: aviary; big data; eggs; poultry; smart farming; welfare.
Conflict of interest statement
The authors declare no conflict of interest.
Figures


Similar articles
-
Managing Free-Range Laying Hens-Part A: Frequent and Non-Frequent Range Users Differ in Laying Performance but Not Egg Quality.Animals (Basel). 2020 Jun 6;10(6):991. doi: 10.3390/ani10060991. Animals (Basel). 2020. PMID: 32517207 Free PMC article.
-
Specific characteristics of the aviary housing system affect plumage condition, mortality and production in laying hens.Poult Sci. 2015 Sep;94(9):2008-17. doi: 10.3382/ps/pev187. Epub 2015 Jul 17. Poult Sci. 2015. PMID: 26188031
-
Outdoor stocking density in free-range laying hens: radio-frequency identification of impacts on range use.Animal. 2017 Jan;11(1):121-130. doi: 10.1017/S1751731116001154. Epub 2016 Jun 22. Animal. 2017. PMID: 27328829
-
The impacts of Ascaridia galli on performance, health, and immune responses of laying hens: new insights into an old problem.Poult Sci. 2019 Dec 1;98(12):6517-6526. doi: 10.3382/ps/pez422. Poult Sci. 2019. PMID: 31504894 Free PMC article. Review.
-
Review: What are the challenges facing the table egg industry in the next decades and what can be done to address them?Animal. 2021 Dec;15 Suppl 1:100282. doi: 10.1016/j.animal.2021.100282. Epub 2021 Jul 8. Animal. 2021. PMID: 34246597 Review.
Cited by
-
Pose Estimation and Behavior Classification of Jinling White Duck Based on Improved HRNet.Animals (Basel). 2023 Sep 10;13(18):2878. doi: 10.3390/ani13182878. Animals (Basel). 2023. PMID: 37760278 Free PMC article.
References
-
- Fanatico A. Alternative Poultry Production Systems and Outdoor Access. ATTRA, National Sustainable Agriculture Information Service; Butte, MT, USA: 2006.
-
- Knierim U. Animal welfare aspects of outdoor runs for laying hens: A review. NJAS Wagening. J. Life Sci. 2006;54:133–145. doi: 10.1016/S1573-5214(06)80017-5. - DOI
Grants and funding
LinkOut - more resources
Full Text Sources

