

5-Aza-2'-Deoxycytidine (5-Aza-dC, Decitabine) Inhibits Collagen Type I and III Expression in TGF-β1-Treated Equine Endometrial Fibroblasts
- PMID: 37048467
- PMCID: PMC10093662
- DOI: 10.3390/ani13071212
5-Aza-2'-Deoxycytidine (5-Aza-dC, Decitabine) Inhibits Collagen Type I and III Expression in TGF-β1-Treated Equine Endometrial Fibroblasts
Abstract
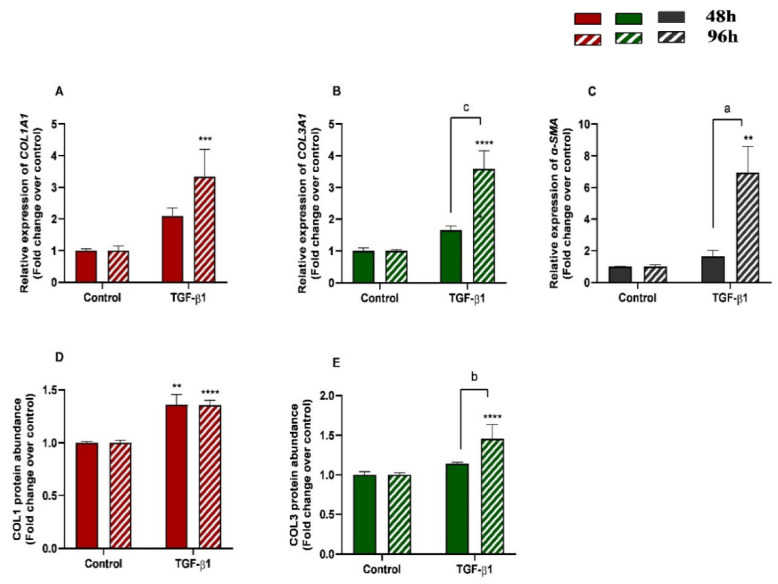
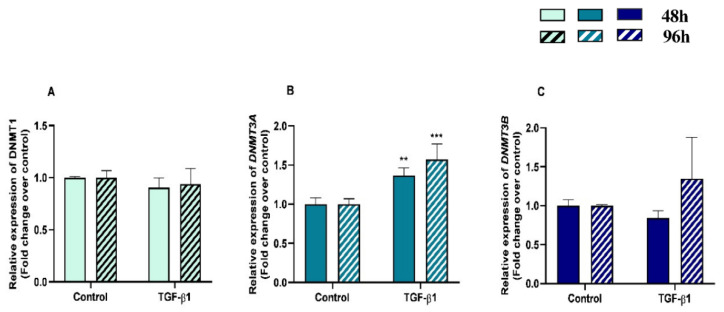
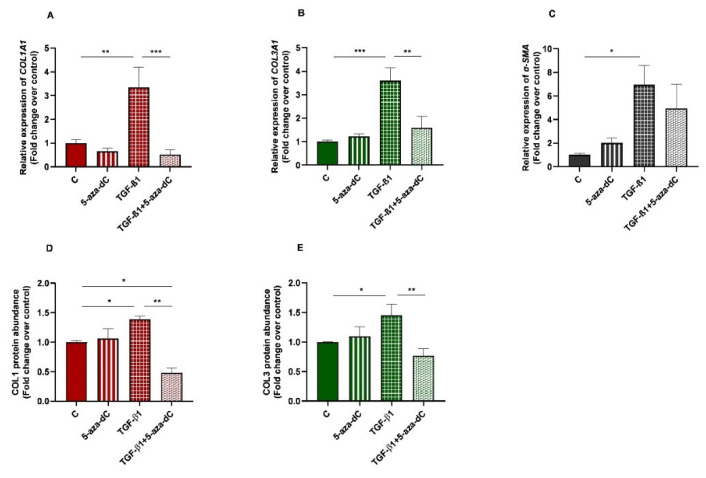
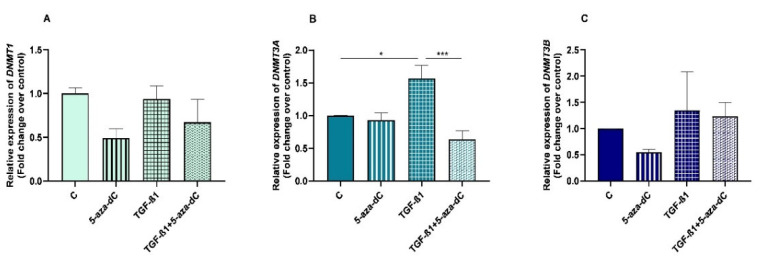
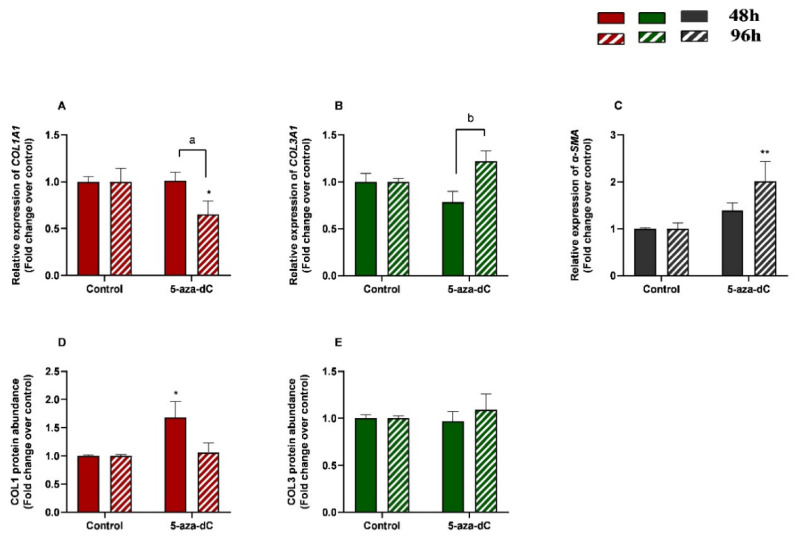
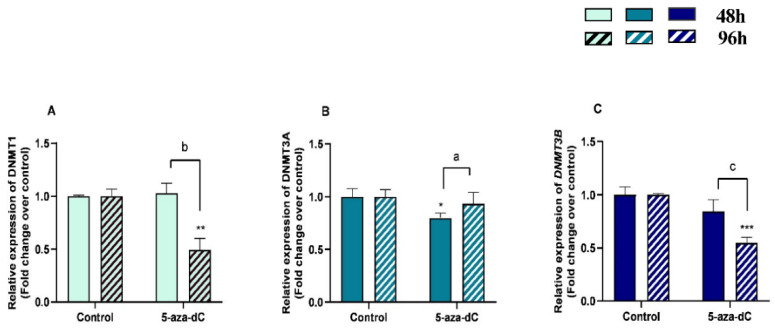
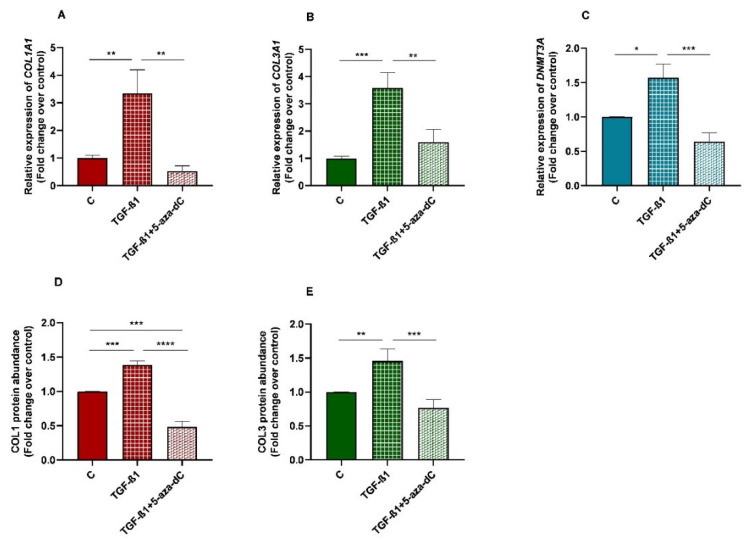
Endometrosis negatively affects endometrial function and fertility in mares, due to excessive deposition of type I (COL1) and type III (COL3) collagens. The pro-fibrotic transforming growth factor (TGF-β1) induces myofibroblast differentiation, characterized by α-smooth muscle actin (α-SMA) expression, and collagen synthesis. In humans, fibrosis has been linked to epigenetic mechanisms. To the best of our knowledge, this has not been described in mare endometrium. Therefore, this study aimed to investigate the in vitro epigenetic regulation in TGF-β1-treated mare endometrial fibroblasts and the use of 5-aza-2'-deoxycytidine (5-aza-dC), an epigenetic modifier, as a putative treatment option for endometrial fibrosis. Methods and Results: The in vitro effects of TGF-β1 and of 5-aza-dC on DNA methyltransferases (DNMT1, DNMT3A, and DNMT3B), COL1A1, COL3A1, and α-SMA transcripts were analyzed in endometrial fibroblasts, and COL1 and COL3 secretion in a co-culture medium. TGF-β1 upregulated DNMT3A transcripts and collagen secretion. In TGF-β1-treated endometrial fibroblasts, DNA methylation inhibitor 5-aza-dC decreased collagen transcripts and secretion, but not α-SMA transcripts. Conclusion: These findings suggest a possible role of epigenetic mechanisms during equine endometrial fibrogenesis. The in vitro effect of 5-aza-dC on collagen reduction in TGF-β1-treated fibroblasts highlights this epigenetic involvement. This may pave the way to different therapeutic approaches for endometrosis.
Keywords: 5-aza-dC; DNMTs; collagen; demethylating inhibitor; endometrosis; epigenetics; fibroblasts; mare.
Conflict of interest statement
The authors declare no conflicts of interest.
Figures
Similar articles
-
Effect of transforming growth factor -β1 on α-smooth muscle actin and collagen expression in equine endometrial fibroblasts.Theriogenology. 2019 Jan 15;124:9-17. doi: 10.1016/j.theriogenology.2018.10.005. Epub 2018 Oct 4. Theriogenology. 2019. PMID: 30321755
-
5-Aza-2'-deoxycytidine induces human Tenon's capsule fibroblasts differentiation and fibrosis by up-regulating TGF-β type I receptor.Exp Eye Res. 2017 Dec;165:47-58. doi: 10.1016/j.exer.2017.09.004. Epub 2017 Sep 9. Exp Eye Res. 2017. PMID: 28893564
-
Ovarian steroids modulate mRNA expression of ECM associated genes and collagen deposition induced by TGF β1 in equine endometrium in vitro.Sci Rep. 2025 Jan 2;15(1):538. doi: 10.1038/s41598-024-84250-1. Sci Rep. 2025. PMID: 39747561 Free PMC article.
-
TGF-β1 epigenetically modifies Thy-1 expression in primary lung fibroblasts.Am J Physiol Cell Physiol. 2015 Nov 1;309(9):C616-26. doi: 10.1152/ajpcell.00086.2015. Epub 2015 Sep 2. Am J Physiol Cell Physiol. 2015. PMID: 26333597 Free PMC article.
-
Collagens and DNA methyltransferases in mare endometrosis.Reprod Domest Anim. 2019 Sep;54 Suppl 3:46-52. doi: 10.1111/rda.13515. Reprod Domest Anim. 2019. PMID: 31512314
Cited by
-
MicroRNA-29a Mitigates Laminectomy-Induced Spinal Epidural Fibrosis and Gait Dysregulation by Repressing TGF-β1 and IL-6.Int J Mol Sci. 2023 May 23;24(11):9158. doi: 10.3390/ijms24119158. Int J Mol Sci. 2023. PMID: 37298111 Free PMC article.
-
In Vivo Genotoxicity and Cytotoxicity Kinetics of Trimethoprim Sulfamethoxazole in Well-nourished and Undernourished Young Rats.In Vivo. 2024 Mar-Apr;38(2):674-682. doi: 10.21873/invivo.13488. In Vivo. 2024. PMID: 38418144 Free PMC article.
-
The path to fertility: Current approaches to mare endometritis and endometrosis.Anim Reprod. 2024 Sep 13;21(3):e20240070. doi: 10.1590/1984-3143-AR2024-0070. eCollection 2024. Anim Reprod. 2024. PMID: 39286368 Free PMC article.
-
Epigenetic regulation-mediated disorders in dopamine transporter endocytosis: A novel mechanism for the pathogenesis of Parkinson's disease.Theranostics. 2025 Jan 13;15(6):2250-2278. doi: 10.7150/thno.107436. eCollection 2025. Theranostics. 2025. PMID: 39990232 Free PMC article. Review.
References
-
- Kenney R.M. Cyclic and pathological changes of the mare endometrium as detected by biopsy, with a note on early embryonic death. J. Am. Vet. Med. Assoc. 1978;172:241–262. - PubMed
Grants and funding
LinkOut - more resources
Full Text Sources
Miscellaneous
