

Genome-Wide Identification and Characterization of Olfactory Receptor Genes in Silver Sillago (Sillago sihama)
- PMID: 37048487
- PMCID: PMC10093537
- DOI: 10.3390/ani13071232
Genome-Wide Identification and Characterization of Olfactory Receptor Genes in Silver Sillago (Sillago sihama)
Abstract
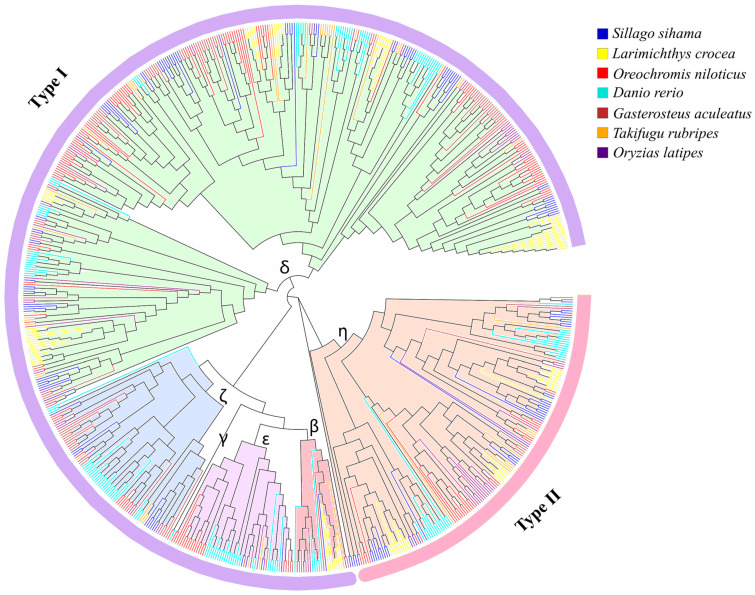
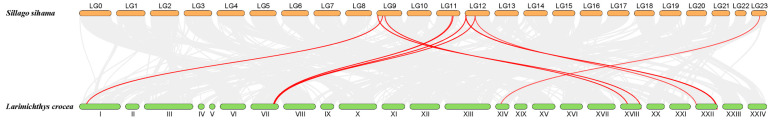
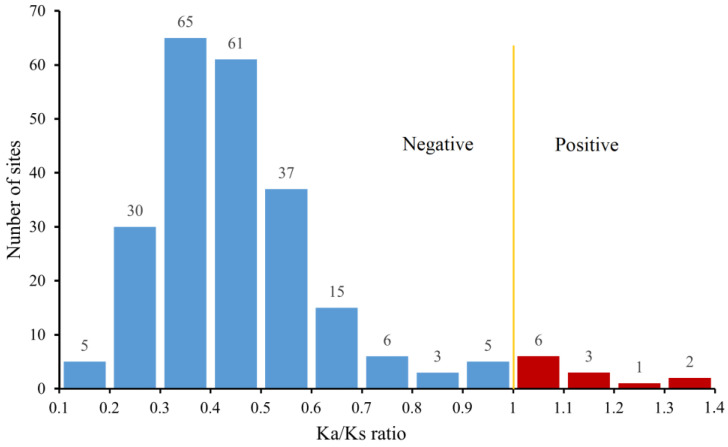
Olfactory receptor (OR) genes are essential in the specific recognition of diverse stimuli in fish. In this study, a total of 141 OR genes were identified in silver sillago (Sillago sihama), a marine fish sensitive to environmental stimuli, including 112 intact genes, 26 truncated genes, and three pseudogenes. A phylogenetic tree analysis elucidated that the OR genes of S. sihama were classified into six groups, of which β, γ, δ, ε, and ζ groups belonged to type I, and the η group belonged to type II. The type I OR genes contained almost all conserved motifs (n = 62), while type II OR genes mainly retained conserved motifs 7(3), 1, 10, 4, and 2 (n = 39). OR genes were mainly distributed on LG1, LG9, LG11, and LG12. Of all OR genes, 36.23% (50 genes) showed significant expansion in S. sihama. Ka/Ks analysis demonstrated that 227 sites were under purifying selection, while 12 sites were under positive selection, including eight genes in the OR2A12 gene subfamily. Sixty-one genes (44.20%) displayed differential expression under hypoxic stress. The identified OR genes explored the mechanism of environmental stress and ecological adaptation of S. sihama, and provided valuable genomic resources for further research on the olfaction of teleosts.
Keywords: Sillago sihama; adaptive evolution; gene expansion; olfactory receptor genes.
Conflict of interest statement
The authors declare no conflict of interest.
Figures


Similar articles
-
Genome-wide identification and expression profiling of the hemoglobin gene family under hypoxia stress in Sillago sihama.Comp Biochem Physiol Part D Genomics Proteomics. 2025 Sep;55:101500. doi: 10.1016/j.cbd.2025.101500. Epub 2025 Mar 28. Comp Biochem Physiol Part D Genomics Proteomics. 2025. PMID: 40174403
-
Chromosomal-Level Genome Assembly of Silver Sillago (Sillago sihama).Genome Biol Evol. 2021 Feb 3;13(2):evaa272. doi: 10.1093/gbe/evaa272. Genome Biol Evol. 2021. PMID: 33367716 Free PMC article.
-
Genome-wide identification and expression profiling of glutathione S-transferase family under hypoxia stress in silver sillago (Sillago sihama).Comp Biochem Physiol Part D Genomics Proteomics. 2021 Dec;40:100920. doi: 10.1016/j.cbd.2021.100920. Epub 2021 Sep 29. Comp Biochem Physiol Part D Genomics Proteomics. 2021. PMID: 34628157
-
Transcriptome Analysis of Male and Female Mature Gonads of Silver Sillago (Sillago sihama).Genes (Basel). 2019 Feb 11;10(2):129. doi: 10.3390/genes10020129. Genes (Basel). 2019. PMID: 30754713 Free PMC article.
-
Genome-wide identification of ATP binding cassette (ABC) transporter and heavy metal associated (HMA) gene families in flax (Linum usitatissimum L.).BMC Genomics. 2020 Oct 19;21(1):722. doi: 10.1186/s12864-020-07121-9. BMC Genomics. 2020. PMID: 33076828 Free PMC article. Review.
References
-
- Policarpo M., Bemis K.E., Tyler J.C., Metcalfe C.J., Laurenti P., Sandoz J.C., Rétaux S., Casane D. Evolutionary dynamics of the OR gene repertoire in teleost fishes: Evidence of an association with changes in olfactory epithelium shape. Mol. Biol. Evol. 2021;38:3742–3753. doi: 10.1093/molbev/msab145. - DOI - PMC - PubMed
Grants and funding
- 2021A1515010733/Guangdong Basic and Applied Basic Research Foundation
- 202210566003/National College Students Innovation and Entrepreneurship Training Program
- pdjh2022b0239/Special Funds for the Cultivation of Guangdong College Students' Scientific and Technological Innovation
- CXTD2023003/Undergraduate Innovation Team Project of Guangdong Ocean University
- K22221/the Modern Seed Industry Park for Whiteleg Shrimp of Guangdong Province
LinkOut - more resources
Full Text Sources
