Review
. 2023 Mar 29;12(7):2592.
doi: 10.3390/jcm12072592.

Update on the Utility of Optical Coherence Tomography in the Analysis of the Optic Nerve Head in Highly Myopic Eyes with and without Glaucoma

Affiliations
Review

Update on the Utility of Optical Coherence Tomography in the Analysis of the Optic Nerve Head in Highly Myopic Eyes with and without Glaucoma

Bachar Kudsieh et al. J Clin Med. .

Abstract

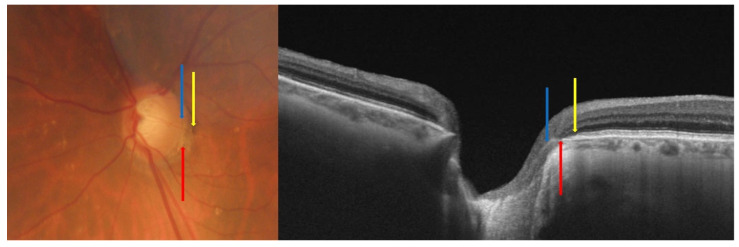
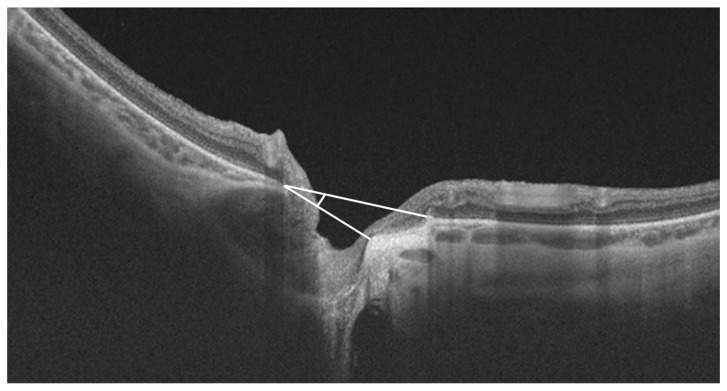
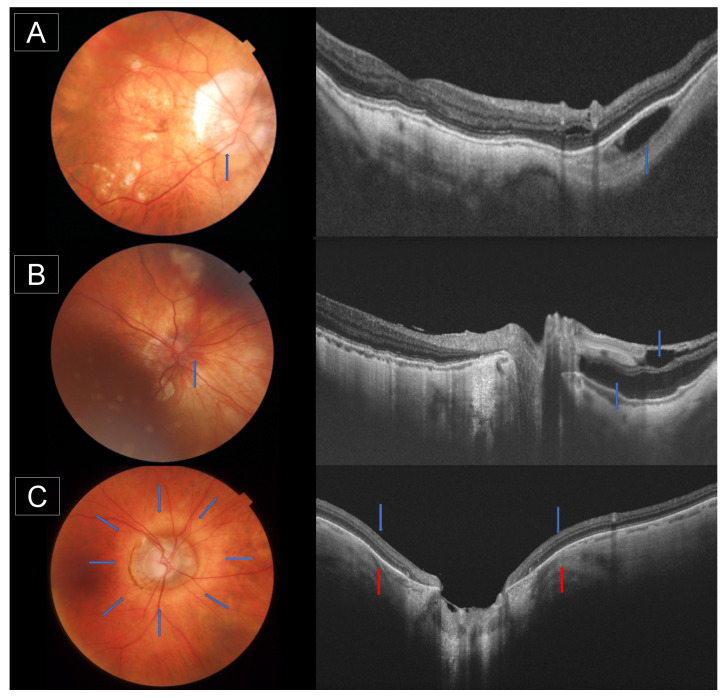
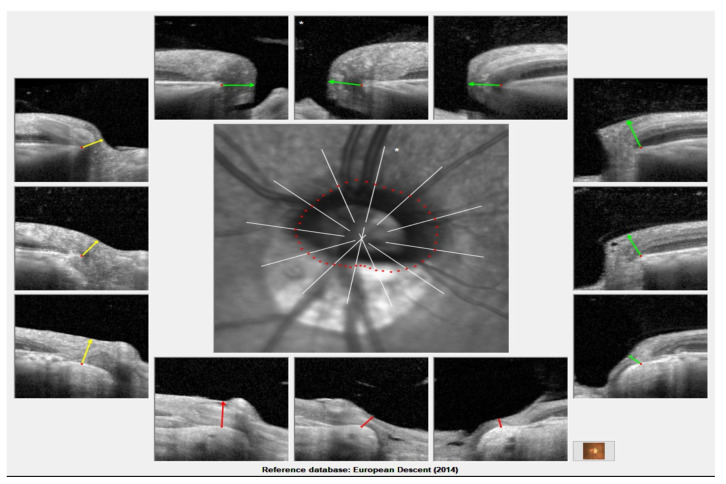
Glaucoma diagnosis in highly myopic subjects by optic nerve head (ONH) imaging is challenging as it is difficult to distinguish structural defects related to glaucoma from myopia-related defects in these subjects. Optical coherence tomography (OCT) has evolved to become a routine examination at present, providing key information in the assessment of glaucoma based on the study of the ONH. However, the correct segmentation and interpretation of the ONH data employing OCT is still a challenge in highly myopic patients. High-resolution OCT images can help qualitatively and quantitatively describe the structural characteristics and anatomical changes in highly myopic subjects with and without glaucoma. The ONH and peripapillary area can be analyzed to measure the myopic atrophic-related zone, the existence of intrachoroidal cavitation, staphyloma, and ONH pits by OCT. Similarly, the lamina cribosa observed in the OCT images may reveal anatomical changes that justify visual defects. Several quantitative parameters of the ONH obtained from OCT images were proposed to predict the progression of visual defects in glaucoma subjects. Additionally, OCT images help identify factors that may negatively influence the measurement of the retinal nerve fiber layer (RNFL) and provide better analysis using new parameters, such as Bruch's Membrane Opening-Minimum Rim Width, which serves as an alternative to RNFL measurements in highly myopic subjects due to its superior diagnostic ability.

Keywords: high myopia; intrachoroidal cavitation; myopic glaucoma; optic disc tilt; optic nerve head; optical coherence tomography; peripapillary atrophy; retinal nerve fiber layer.


Conflict of interest statement

The authors declare no conflict of interest.

Figures

Figure 1
Figure 1
Fundus photography and optical coherence tomography of the peripapillary region of a myopic subject. The blue arrow represents the temporal optic disc margin, the red arrow represents the end of Bruch’s membrane (BM), and the yellow arrow represents the end of the retinal pigment epithelium (RPE). The distance from the temporal optic disc margin (blue arrow) to the edge of BM (red arrow) is defined as peripapillary atrophy (PPA) beta and the distance from the edge of BM (red arrow) to the end of RPE is defined as PPA alpha.
Figure 2
Figure 2
Optic nerve head tilt angle measurement in myopic subject. The tilt angle represents the angle is between the upper white line connecting the inner edges of Bruch’s membrane on each side of the optic nerve head on the cross-sectional optical coherence tomography (OCT) image, and the lower white line connecting the two points marking the clinical disc margin along the OCT cross-sectional scan.
Figure 3
Figure 3
Fundus photography and optical coherence tomography (OCT) of the peripapillary region of a myopic subject. (A): Blue arrow represents peripapillary intrachoroidal cavitation observed in the photography as a yellowish peripapillary lesion and in the OCT image as a hyporeflective triangular thickening of the choroid with the base at the optic disc border, (B): Blue arrow represents peripapillary retinoschisis observed in the OCT image as cystoid hyporeflective spaces in the peripapillary region around retinal vessels, (C): Fundus photography and OCT image of peripapillary staphyloma, blue arrows showing the border of the staphyloma with arched posterior sclera and red arrows showing the thinned choroid at the edge of the staphyloma.
Figure 4
Figure 4
Bruch’s membrane opening-minimum rim width (BMO-MRW) measurement in a high myopic patient. Green, yellow, and red lines represent the least distance between Bruch’s membrane opening and the internal limiting membrane. Green, yellow, and red color of the lines represent the classification of BMO-MRW measurement within normal limits, borderline and out of normal limits, respectively.

Similar articles

Cited by

References

    1. Mitchell P., Hourihan F., Sandbach J., Wang J.J. The relationship between glaucoma and myopia. Ophthalmology. 1999;106:2010–2015. doi: 10.1016/S0161-6420(99)90416-5. - DOI - PubMed
    1. Xu L., Wang Y., Wang S., Wang Y., Jonas J.B. High Myopia and Glaucoma Susceptibility. Ophthalmology. 2007;114:216–220. doi: 10.1016/j.ophtha.2006.06.050. - DOI - PubMed
    1. Ha A., Kim C.Y., Shim S.R., Chang I.B., Kim Y.K. Degree of Myopia and Glaucoma Risk: A Dose-Response Meta-analysis. Am. J. Ophthalmol. 2022;236:107–119. doi: 10.1016/j.ajo.2021.10.007. - DOI - PubMed
    1. Tan N.Y.Q., Sng C.C.A., Jonas J.B., Wong T.Y., Jansonius N.M., Ang M. Glaucoma in myopia: Diagnostic dilemmas. Br. J. Ophthalmol. 2019;103:1347–1355. doi: 10.1136/bjophthalmol-2018-313530. - DOI - PubMed
    1. Hood D.C., La Bruna S., Tsamis E., Thakoor K.A., Rai A., Leshno A., de Moraes C.G., Cioffi G.A., Liebmann J.M. Detecting glaucoma with only OCT: Implications for the clinic, research, screening, and AI development. Prog. Retin. Eye Res. 2022;90:101052. doi: 10.1016/j.preteyeres.2022.101052. - DOI - PubMed

LinkOut - more resources