Review
. 2023 Apr 6;16(7):2902.
doi: 10.3390/ma16072902.

Hydrothermal Reduction of CO2 to Value-Added Products by In Situ Generated Metal Hydrides

Affiliations
Review

Hydrothermal Reduction of CO2 to Value-Added Products by In Situ Generated Metal Hydrides

Xu Zeng et al. Materials (Basel). .

Abstract

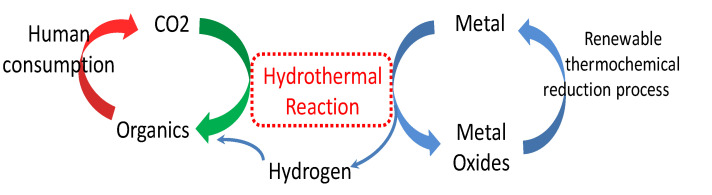
An integrated process by coupling hydrothermal reactions, including CO2 reduction and H2O dissociation with metals, is proposed. The hydrogen could be rapidly produced under hydrothermal conditions, owing to the special characteristics of high temperature water, generating metal hydrides as intermediates. Hydrogen production from the H2O dissociation under hydrothermal conditions is one of the most ideal processes due to its environmentally friendly impact. Recent experimental and theoretical studies on the hydrothermal reduction of CO2 to value-added products by in situ generated metal hydrides are introduced, including the production of formic acid, methanol, methane, and long-chain hydrocarbons. These results indicate that this process holds promise in respect to the conversion of CO2 to useful chemicals and fuels, and for hydrogen storage, which could help alleviate the problems of climate change and energy shortage.

Keywords: CO2; hydrogen storage; hydrogenation; hydrothermal reduction; metal hydrides.


Conflict of interest statement

The authors declare no conflict of interest.

Figures

Scheme 1
Scheme 1
Proposed process of CO2 reduction and hydrogen utilization [15].
Figure 1
Figure 1
Number of hydrogen bonds per water molecule [20].
Figure 2
Figure 2
Maximum theoretical hydrogen yield (a), reaction heat of the metal–water cycle (b) [25].
Figure 3
Figure 3
The effects of temperature and time on the yield of formic acid (a) and the yield of formic acid with longer reaction time (b) [13].
Figure 4
Figure 4
XRD patterns of ZnO (a) and the conversion rate of Zn into ZnO (b) (300 °C, Zn 10 mmol, NaHCO3 1 mmol) [14].
Figure 5
Figure 5
IR absorption spectra of samples (NaHCO3 1 mmol, 300 °C, Zn 10 mmol) [14].
Figure 6
Figure 6
Effects of Al and NaHCO3 amounts on the yield of formic acid (300 °C, 2 h) [32].
Figure 7
Figure 7
Effects of reaction time and temperature on the formic acid yield (Al 6 mmol, NaHCO3 1 mmol) [32].
Figure 8
Figure 8
Effects of reaction time and reaction temperature on the formic acid yield (NaHCO3 2 mmol, Fe 12 mmol) [34].
Figure 9
Figure 9
Effects of temperature and time on the yield of formic acid (NaHCO3 1 mmol, Mn 8 mmol) [39].
Figure 10
Figure 10
Zn5 cluster for the calculation [42].
Figure 11
Figure 11
Gibbs free energy of different patterns [42].
Scheme 2
Scheme 2
Proposed mechanism of CO2 reduction via zinc hydrides [43].
Figure 12
Figure 12
The geometries of TS (left) and activation energy of HCOO- formation [43].
Figure 13
Figure 13
IRC calculation (a), HOMO (b) and LUMO (c) orbital shapes of the TS [43].
Figure 14
Figure 14
The geometries and charge of initial state (a), TS (b) and final state (c) [48].
Figure 15
Figure 15
IRC calculation (a), HOMO (b) and LUMO (c) orbital shapes of the TS [48].
Figure 16
Figure 16
Optimized geometric parameters of the transition state and the final state [49].
Figure 17
Figure 17
Potential energy diagram for HCOO formation [49].
Figure 18
Figure 18
IRC calculation results (a) and HOMO (b) and LUMO (c) orbital shapes of the transition state [49].
Figure 19
Figure 19
Effect of Cu amount on the methanol yield (350 °C, 2 h; Zn 60 mmol, NaHCO3 40 mmol (or 60 mmol), HCl 2.0 M, water filling 50%) [53].
Figure 20
Figure 20
Proposed mechanism for the methanol formation [53].
Figure 21
Figure 21
In situ FTIR spectra of Cu/ZnO [55].
Figure 22
Figure 22
Effects of time and temperature on the methanol yield (a) 200 °C, (b) 70 h [60].
Figure 23
Figure 23
Proposed mechanism for methane formation [60].
Figure 24
Figure 24
Effects of reaction conditions on the methane yield (Ni 20 mmol, H2O 10 mL, CO2 13 mmol; (a) Fe 0.1 mol; (b) 4 h; (c) Fe 0.1 mol, 300 °C; (d) Fe 0.1 mol, 300 °C, 4 h) [61].
Figure 25
Figure 25
Identification of hydrocarbons synthesized by the hydrothermal reduction of NaHCO3 [70].
Figure 26
Figure 26
ATR-FTIR spectra (a), XRD patterns of solid products (b), and long-chain product distribution (c) [70].
Figure 27
Figure 27
Proposed pathways for the hydrocarbons formation [70].

References

    1. Song J.W., Yang Y., Yao G.D., Zhong H., He R.T., Jin B.B., Jing Z.Z., Jin F.M. Highly Efficient Synthesis of Hydrogen Storage Material of Formate from Bicarbonate and Water with General Zn Powder. Ind. Eng. Chem. Res. 2017;56:6349–6357. doi: 10.1021/acs.iecr.7b00190. - DOI
    1. Iqbal M., Azam M., Naeem M., Khwaja A.S., Anpalagan A. Optimization classification, algorithms and tools for renewable energy: A review. Renew. Sustain. Energy Rev. 2014;39:640–650. doi: 10.1016/j.rser.2014.07.120. - DOI
    1. Gross R., Leach M., Bauen A. Progress in renewable energy. Environ. Int. 2003;29:105–122. doi: 10.1016/S0160-4120(02)00130-7. - DOI - PubMed
    1. Belmonte N., Girgenti V., Florian P., Peano C., Luetto C., Rizzi P., Baricco M. A comparison of energy storage from renewable sources through batteries and fuel cells: A case study in Turin, Italy. Int. J. Hydrog. Energy. 2016;41:21427–21438. doi: 10.1016/j.ijhydene.2016.07.260. - DOI
    1. Allouhi A., El Fouih Y., Kousksou T., Jamil A., Zeraouli Y., Mourad Y. Energy consumption and efficiency in buildings: Current status and future trends. J. Clean. Prod. 2015;109:118–130. doi: 10.1016/j.jclepro.2015.05.139. - DOI

LinkOut - more resources