

Surface-Enhanced Raman Analysis of Uric Acid and Hypoxanthine Analysis in Fractionated Bodily Fluids
- PMID: 37049309
- PMCID: PMC10097234
- DOI: 10.3390/nano13071216
Surface-Enhanced Raman Analysis of Uric Acid and Hypoxanthine Analysis in Fractionated Bodily Fluids
Abstract
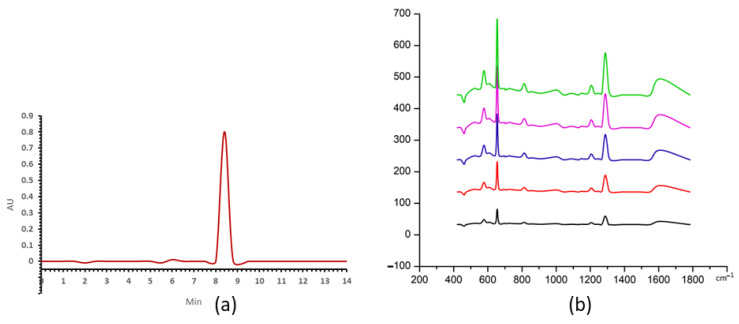
In recent years, the disease burden of hyperuricemia has been increasing, especially in high-income countries and the economically developing world with a Western lifestyle. Abnormal levels of uric acid and hypoxanthine are associated with many diseases, and therefore, to demonstrate improved methods of uric acid and hypoxanthine detection, three different bodily fluids were analysed using surface-enhanced Raman spectroscopy (SERS) and high-performance liquid chromatography (HPLC). Gold nanostar suspensions were mixed with series dilutions of uric acid and hypoxanthine, 3 kDa centrifugally filtered human blood serum, urine and saliva. The results show that gold nanostars enable the quantitative detection of the concentration of uric acid and hypoxanthine in the range 5-50 μg/mL and 50-250 ng/mL, respectively. The peak areas of HPLC and maximum peak intensity of SERS have strongly correlated, notably with the peaks of uric acid and hypoxanthine at 1000 and 640 cm-1, respectively. The r2 is 0.975 and 0.959 for uric acid and hypoxanthine, respectively. Each of the three body fluids has a number of spectral features in common with uric acid and hypoxanthine. The large overlap of the spectral bands of the SERS of uric acid against three body fluids at spectra peaks were at 442, 712, 802, 1000, 1086, 1206, 1343, 1436 and 1560 cm-1. The features at 560, 640, 803, 1206, 1290 and 1620 cm-1 from hypoxanthine were common to serum, saliva and urine. There is no statistical difference between HPLC and SERS for determination of the concentration of uric acid and hypoxanthine (p > 0.05). For clinical applications, 3 kDa centrifugal filtration followed by SERS can be used for uric acid and hypoxanthine screening is, which can be used to reveal the subtle abnormalities enhancing the great potential of vibrational spectroscopy as an analytical tool. Our work supports the hypnosis that it is possible to obtain the specific concentration of uric acid and hypoxanthine by comparing the SER signals of serum, saliva and urine. In the future, the analysis of other biofluids can be employed to detect biomarkers for the diagnosis of systemic pathologies.
Keywords: blood serum; bodily fluids; centrifugal filtration; gold nanostars; hypoxanthine; saliva; surface-enhanced Raman spectroscopy; uric acid; urine; vibrational spectroscopy.
Conflict of interest statement
The authors declare no conflict of interest.
Figures


Similar articles
-
High-Accuracy Renal Cell Carcinoma Discrimination through Label-Free SERS of Blood Serum and Multivariate Analysis.Biosensors (Basel). 2023 Aug 13;13(8):813. doi: 10.3390/bios13080813. Biosensors (Basel). 2023. PMID: 37622899 Free PMC article.
-
Surface-Enhanced Raman Spectroscopy Study of Fresh Human Urine: A Preliminary Study.Guang Pu Xue Yu Guang Pu Fen Xi. 2016 Jun;36(6):1987-91. Guang Pu Xue Yu Guang Pu Fen Xi. 2016. PMID: 30053365
-
Advancing Breast Cancer Diagnosis: Optimization of Raman Spectroscopy for Urine-Based Early Detection.Biomedicines. 2025 Feb 18;13(2):505. doi: 10.3390/biomedicines13020505. Biomedicines. 2025. PMID: 40002920 Free PMC article.
-
Label-free surface-enhanced Raman spectroscopy of biofluids: fundamental aspects and diagnostic applications.Anal Bioanal Chem. 2015 Nov;407(27):8265-77. doi: 10.1007/s00216-015-8697-z. Epub 2015 May 3. Anal Bioanal Chem. 2015. PMID: 25935674 Review.
-
Non-invasive determination of uric acid in human saliva in the diagnosis of serious disorders.Clin Chem Lab Med. 2020 Nov 30;59(5):797-812. doi: 10.1515/cclm-2020-1533. Print 2021 Apr 27. Clin Chem Lab Med. 2020. PMID: 33554551 Review.
Cited by
-
Developing New Diagnostic Tools Based on SERS Analysis of Filtered Salivary Samples for Oral Cancer Detection.Int J Mol Sci. 2023 Jul 28;24(15):12125. doi: 10.3390/ijms241512125. Int J Mol Sci. 2023. PMID: 37569501 Free PMC article.
-
Machine learning combined with infrared spectroscopy for detection of hypertension pregnancy: towards newborn and pregnant blood analysis.BMC Pregnancy Childbirth. 2025 Mar 27;25(1):358. doi: 10.1186/s12884-024-06941-x. BMC Pregnancy Childbirth. 2025. PMID: 40148838 Free PMC article.
-
Advancements in Nanomedicine for the Diagnosis and Treatment of Kidney Stones.Int J Nanomedicine. 2025 Feb 3;20:1401-1423. doi: 10.2147/IJN.S504318. eCollection 2025. Int J Nanomedicine. 2025. PMID: 39925679 Free PMC article. Review.
References
LinkOut - more resources
Full Text Sources
Miscellaneous
