

Longevity-Associated Core Gut Microbiota Mining and Effect of Mediated Probiotic Combinations on Aging Mice: Case Study of a Long-Lived Population in Guangxi, China
- PMID: 37049450
- PMCID: PMC10097023
- DOI: 10.3390/nu15071609
Longevity-Associated Core Gut Microbiota Mining and Effect of Mediated Probiotic Combinations on Aging Mice: Case Study of a Long-Lived Population in Guangxi, China
Abstract
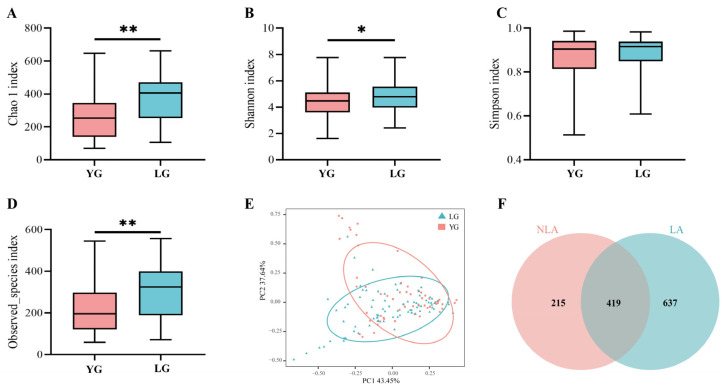
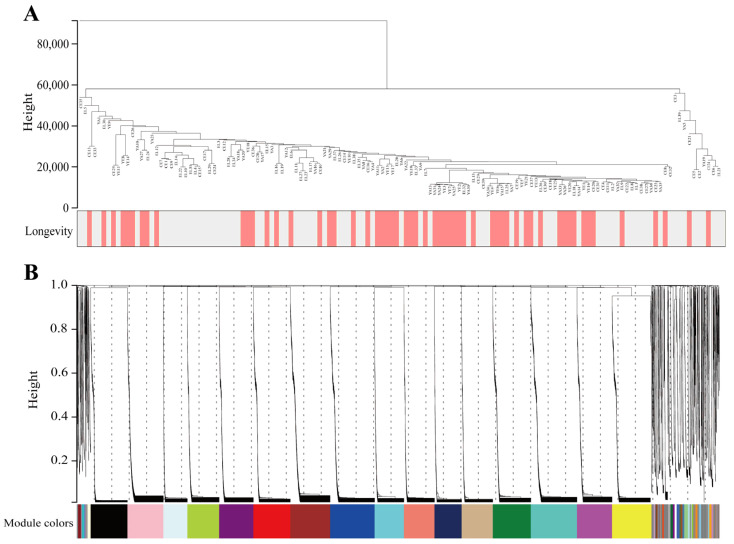
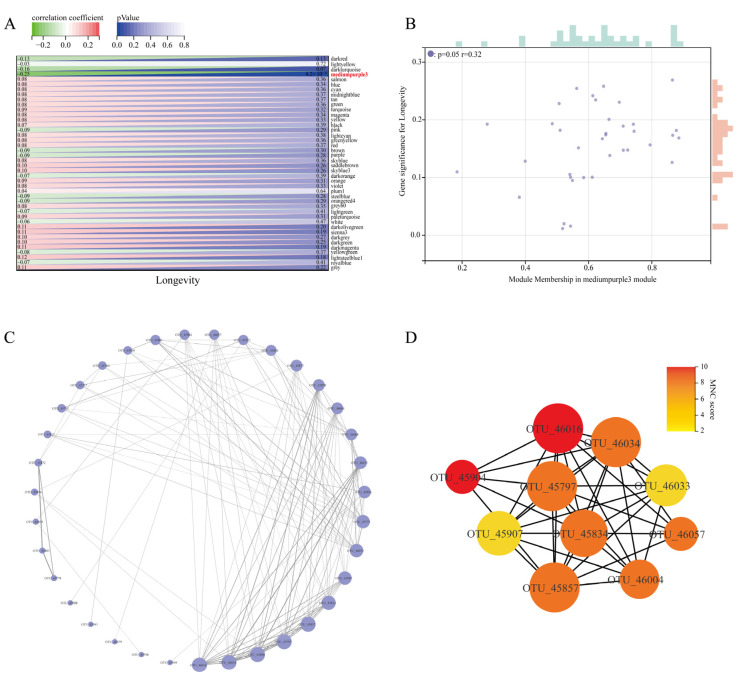
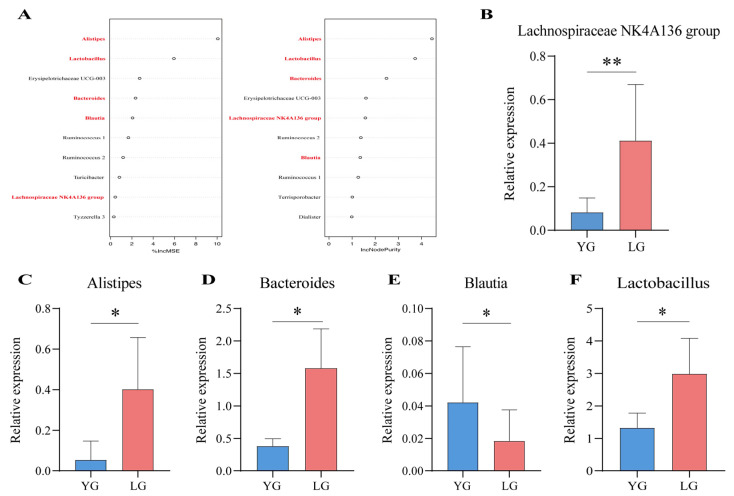
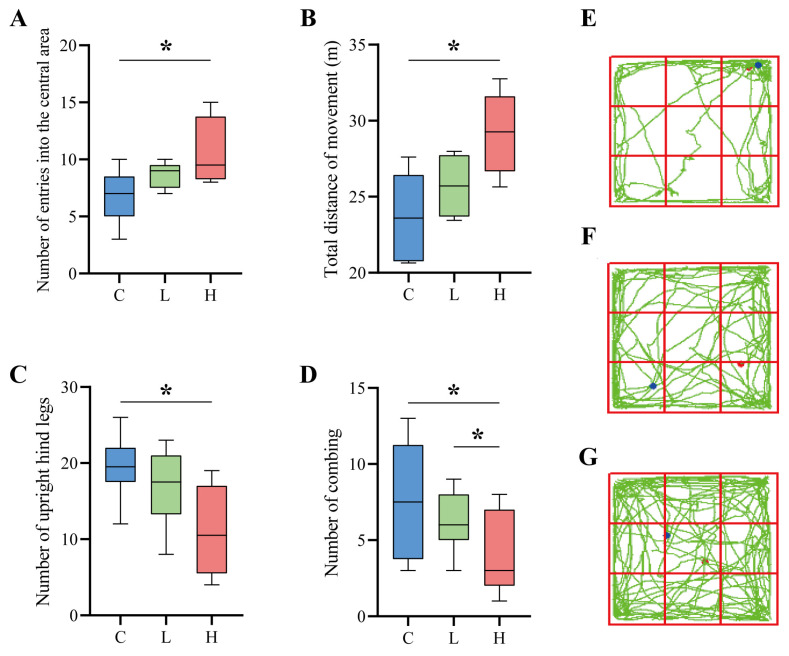
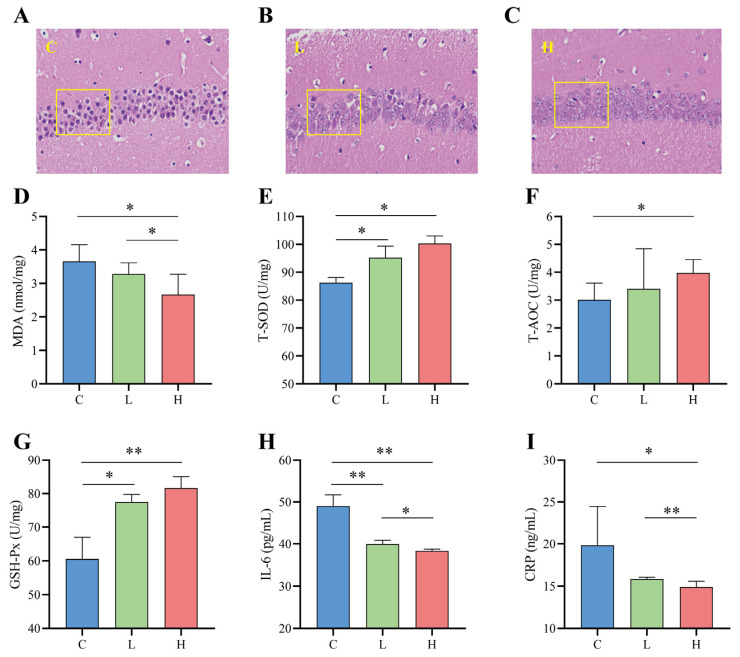
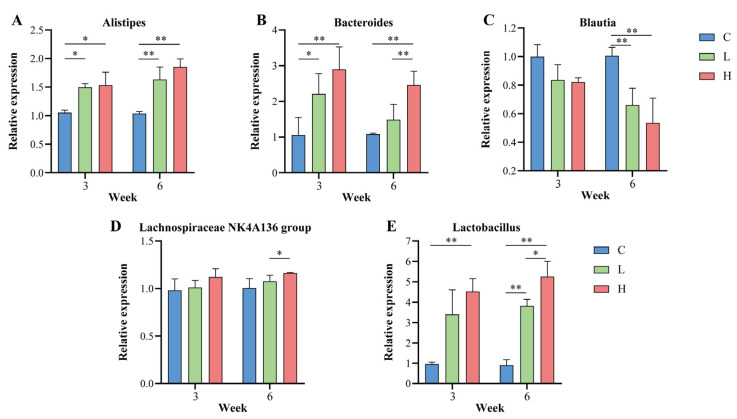
With an ageing population, healthy longevity is becoming an important scientific concern. The longevity phenomenon is closely related to the intestinal microflora and is highly complicated; it is challenging to identify and define the core gut microbiota associated with longevity. Therefore, in this study, 16S rRNA sequencing data were obtained from a total of 135 faecal samples collected as part of the latest sampling and pre-collection initiative in the Guangxi longevity area, and weighted gene co-expression network analysis (WGCNA) was used to find a mediumpurple3 network module significantly associated with the Guangxi longevity phenomenon. Five core genera, namely, Alistipes, Bacteroides, Blautia, Lachnospiraceae NK4A136 group, and Lactobacillus, were identified via network analysis and random forest (RF) in this module. Two potential probiotic strains, Lactobacillus fermentum and Bacteroides fragilis, were further isolated and screened from the above five core genera, and then combined and used as an intervention in naturally ageing mice. The results show a change in the key longevity gut microbiota in mice toward a healthy longevity state after the intervention. In addition, the results show that the probiotic combination effectively ameliorated anxiety and necrosis of hippocampal neuronal cells in senescent mice, improving their antioxidant capacity and reducing their inflammation levels. In conclusion, this longer-term study provides a new approach to the search for longevity hub microbiota. These results may also provide an important theoretical reference for the healthification of the intestinal microflora in the general population, and even the remodelling of the structure of the longevity-state intestinal microflora.
Keywords: antioxidant; core gut microbiota; long-lived seniors; network analysis.
Conflict of interest statement
The authors declare no conflict of interest.
Figures
Similar articles
-
Characterizing the oral and gastrointestinal microbiome associated with healthy aging: insights from long-lived populations in Northeastern China.Geroscience. 2025 Apr;47(2):2275-2292. doi: 10.1007/s11357-024-01419-2. Epub 2024 Nov 7. Geroscience. 2025. PMID: 39505797 Free PMC article.
-
Effects of probiotics and prebiotics on intestinal microbiota in mice with acute colitis based on 16S rRNA gene sequencing.Chin Med J (Engl). 2019 Aug 5;132(15):1833-1842. doi: 10.1097/CM9.0000000000000308. Chin Med J (Engl). 2019. PMID: 31268903 Free PMC article.
-
Probiotic alleviate fluoride-induced memory impairment by reconstructing gut microbiota in mice.Ecotoxicol Environ Saf. 2021 Jun 1;215:112108. doi: 10.1016/j.ecoenv.2021.112108. Epub 2021 Mar 30. Ecotoxicol Environ Saf. 2021. PMID: 33799132
-
Gut microbiome and aging nexus and underlying mechanism.Appl Microbiol Biotechnol. 2022 Sep;106(17):5349-5358. doi: 10.1007/s00253-022-12089-5. Epub 2022 Jul 27. Appl Microbiol Biotechnol. 2022. PMID: 35882675 Review.
-
The Gut Microbiota and Unhealthy Aging: Disentangling Cause from Consequence.Cell Host Microbe. 2020 Aug 12;28(2):180-189. doi: 10.1016/j.chom.2020.07.013. Cell Host Microbe. 2020. PMID: 32791111 Review.
Cited by
-
Exploring the Probiotic Potential of Bacteroides spp. Within One Health Paradigm.Probiotics Antimicrob Proteins. 2025 Apr;17(2):681-704. doi: 10.1007/s12602-024-10370-9. Epub 2024 Oct 8. Probiotics Antimicrob Proteins. 2025. PMID: 39377977 Free PMC article. Review.
-
Impact of Early-Life Microbiota on Immune System Development and Allergic Disorders.Biomedicines. 2025 Jan 7;13(1):121. doi: 10.3390/biomedicines13010121. Biomedicines. 2025. PMID: 39857705 Free PMC article. Review.
-
Winds of change a tale of: asthma and microbiome.Front Microbiol. 2023 Dec 11;14:1295215. doi: 10.3389/fmicb.2023.1295215. eCollection 2023. Front Microbiol. 2023. PMID: 38146448 Free PMC article. Review.
-
Structural characteristics of gut microbiota in longevity from Changshou town, Hubei, China.Appl Microbiol Biotechnol. 2024 Apr 15;108(1):300. doi: 10.1007/s00253-024-13140-3. Appl Microbiol Biotechnol. 2024. PMID: 38619710 Free PMC article.
-
Trends in intestinal aging: From underlying mechanisms to therapeutic strategies.Acta Pharm Sin B. 2025 Jul;15(7):3372-3403. doi: 10.1016/j.apsb.2025.05.011. Epub 2025 May 22. Acta Pharm Sin B. 2025. PMID: 40698139 Free PMC article. Review.
References
-
- Rampelli S., Soverini M., D’Amico F., Barone M., Tavella T., Monti D., Capri M., Astolfi A., Brigidi P., Biagi E., et al. Shotgun Metagenomics of Gut Microbiota in Humans with up to Extreme Longevity and the Increasing Role of Xenobiotic Degradation. Msystems. 2020;5:e00124-20. doi: 10.1128/mSystems.00124-20. - DOI - PMC - PubMed
MeSH terms
Substances
Grants and funding
LinkOut - more resources
Full Text Sources
