Review
. 2023 Mar 23;28(7):2890.
doi: 10.3390/molecules28072890.

Mutated Isocitrate Dehydrogenase (mIDH) as Target for PET Imaging in Gliomas

Affiliations
Review

Mutated Isocitrate Dehydrogenase (mIDH) as Target for PET Imaging in Gliomas

Felix Neumaier et al. Molecules. .

Abstract

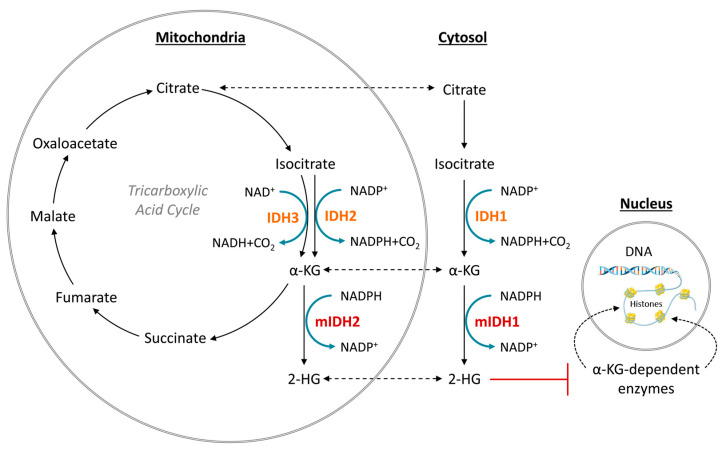
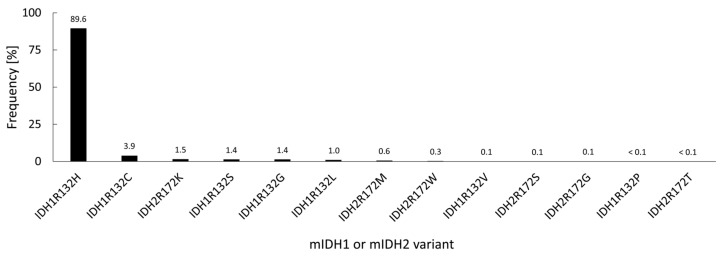
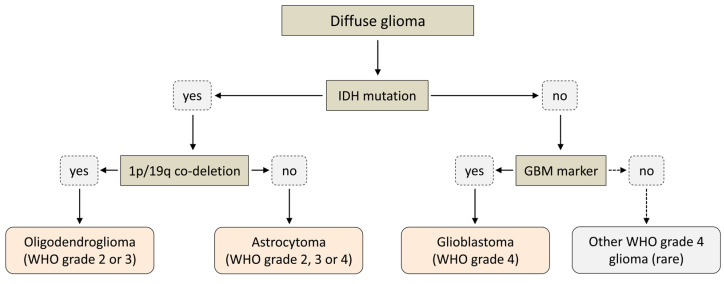
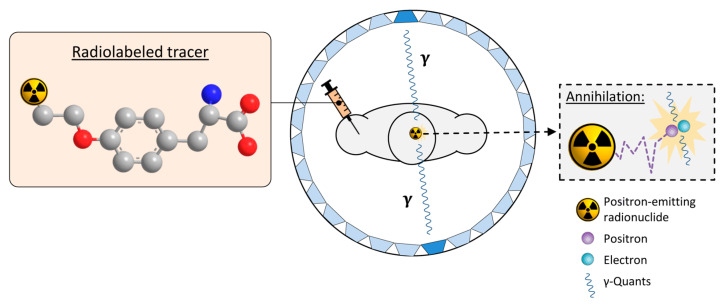
Gliomas are the most common primary brain tumors in adults. A diffuse infiltrative growth pattern and high resistance to therapy make them largely incurable, but there are significant differences in the prognosis of patients with different subtypes of glioma. Mutations in isocitrate dehydrogenase (IDH) have been recognized as an important biomarker for glioma classification and a potential therapeutic target. However, current clinical methods for detecting mutated IDH (mIDH) require invasive tissue sampling and cannot be used for follow-up examinations or longitudinal studies. PET imaging could be a promising approach for non-invasive assessment of the IDH status in gliomas, owing to the availability of various mIDH-selective inhibitors as potential leads for the development of PET tracers. In the present review, we summarize the rationale for the development of mIDH-selective PET probes, describe their potential applications beyond the assessment of the IDH status and highlight potential challenges that may complicate tracer development. In addition, we compile the major chemical classes of mIDH-selective inhibitors that have been described to date and briefly consider possible strategies for radiolabeling of the most promising candidates. Where available, we also summarize previous studies with radiolabeled analogs of mIDH inhibitors and assess their suitability for PET imaging in gliomas.

Keywords: fluorine-18; glioma; molecular imaging; mutated isocitrate dehydrogenase (mIDH); positron emission tomography (PET); radiotracer.


Conflict of interest statement

The authors declare no conflict of interest.

Figures

Figure 1
Figure 1
Function of normal (orange) and mutated (red) isocitrate dehydrogenase (IDH) isoforms. Redrawn and modified from [15].
Figure 2
Figure 2
Relative frequency of different IDH mutations in 3489 IDH-mutated gliomas from various studies, calculated based on the data compiled in [3].
Figure 3
Figure 3
Simplified scheme illustrating the 2021 WHO classification for adult-type diffuse glioma.
Figure 4
Figure 4
Principle of positron emission tomography (PET) imaging. A tracer labeled with a positron-emitting radionuclide (exemplified by the 18F-labeled amino acid O-([18F]fluoroethyl)tyrosine, with fluorine-18, carbon, nitrogen and oxygen atoms shown as orange, grey, blue or red spheres, respectively while hydrogen atoms are omitted for clarity) is injected into the subject. The subject is placed into the PET-scanner consisting of a ring of opposite detectors (indicated as blue trapezoids). The in vivo biodistribution of the tracer is then tracked by detecting the antiparallel γ-quants produced after the decay of the radionuclide and annihilation of the emitted positrons with electrons in surrounding tissues. Adapted from [45] (CC BY 4.0).
Figure 5
Figure 5
Overview of residues involved in binding of mIDH-selective inhibitors and proposed mechanism for selective inhibition of IDH1R132H. (A) Amino acid sequence of the allosteric pocket near the substrate binding site of IDH1R132H targeted by most mIDH1-selective inhibitors, and overview of residues involved in inhibitor binding. The mutated histidine residue and residues forming the allosteric pocket are highlighted in blue and orange, respectively, while residues that directly interact with different inhibitors or catalytic Mg2+ ions are indicated by arrows or stars, respectively. Note that the pan-mIDH1/2 inhibitor AG-881 binds to an alternative allosteric pocket at the dimer interface but directly interacts with one of the residues (Val255) lining the allosteric pocket targeted by mIDH1-selective inhibitors. (B) Cartoon representation of the allosteric pocket (indicated in turquoise) and regulatory segment 2 (indicated in red) in IDH1R132H as observed in the crystal structure of the open, inactive (middle, PDB: 3MAR), closed, active (right, PDB: 3INM) or an inhibitor-bound, inactive (left, PDB: 6o2y) conformation. The inhibitor (compound 4, for details, see Section 7.4) is shown in green, while the mutated residue (His132) is shown in yellow. Note that the regulatory segment is destabilized and (due to conformational motions) unresolved in the crystal structure of the inactive conformation (middle), so that inhibitor-binding to the allosteric pocket can lock the enzyme in a quasi-open, inactive conformation (left), while it assumes a long α-helix structure that prevents access to the allosteric pocket in the active conformation (right). Inset: Comparison of the allosteric pocket and regulatory segment 2 in the inactive conformations of IDH1WT (left, PDB: 1T09) and IDH1R132H (right, PDB: 3MAR). Note that interaction between Arg132 and Asp279 in the wildtype enzyme restricts the conformational flexibility of regulatory segment 2, which may limit access to the allosteric pocket in inactive wildtype enzymes.
Figure 6
Figure 6
Structure of phenylglycine-based inhibitors and radiolabeled analogs. (A) Structure of preclinical and clinical mIDH1-selective inhibitors with an N-acetyl phenylglycine amide backbone (highlighted in blue) [65,70,71,73]. (B) Overview of radiolabeled phenylglycine-based inhibitors of mIDH1 (radiolabels highlighted in red) [62,74].
Figure 7
Figure 7
Structure of pyrimidinyl-oxazolidinone-based inhibitors and their interaction with IDH1R132H. (A) Structure of preclinical and clinical mIDH1-selective inhibitors with a pyrimidinyl-oxazolidinone backbone (indicated in blue) [75,76,77,79]. (B) Scheme illustrating inhibitor-protein interactions in the crystal structures of IDH889 (top, PDB: 5TQH) or IDH305 (bottom, PDB: 6B0Z) in complex with IDH1R132H. Amino acid residues that directly interact with the inhibitors are shown in orange circles, with dotted lines indicating the formation of hydrogen bonds. In addition, key hydrophobic interactions of the inhibitors with the protein are indicated in turquoise.
Figure 8
Figure 8
Structure of aminobenzimidazole-based mIDH1 inhibitors and their interaction with IDH1R132H. (A) Structure of BAY1436032 and a structural analog from the lead optimization program (3) with the same 2-aminobenzimidazole backbone (indicated in blue) [80]. (B) Scheme illustrating inhibitor-protein interactions in the crystal structure of 3 in complex with IDH1R132H (PDB: 5LGE). Amino acid residues that directly interact with the inhibitor are shown in red or orange circles, with dotted lines indicating the formation of hydrogen bonds (orange) or salt bridges (red), respectively. In addition, key hydrophobic interactions of the inhibitor with the protein are indicated in turquoise.
Figure 9
Figure 9
Structure of quinolinone-based inhibitors and their interaction with IDH1R132H. (A) Structure of preclinical and clinical mIDH1-selective inhibitors with a 1H-quinolin-2-one backbone (indicated in blue) [83,84]. (B) Scheme illustrating inhibitor-protein interactions in the crystal structures of compound 4 (top, PDB: 6O2Y) and FT-2102 (bottom, PDB: 6U4J) in complex with IDH1R132H. Amino acid residues that directly interact with the inhibitors are shown in orange circles, with dotted lines indicating the formation of hydrogen bonds. In addition, key hydrophobic interactions of the inhibitors with the protein are indicated in turquoise. (C) Structure of radiolabeled mIDH inhibitors, with the radiolabels indicated in red [85].
Figure 10
Figure 10
(A) Structure of tetrahydropyrazolopyridine-based inhibitors and their interaction with IDH1R132H. Structure of preclinical mIDH1-selective inhibitors with a tetrahydropyrazolopyridine backbone (indicated in blue) [86]. (B) Scheme illustrating inhibitor-protein interactions in the crystal structure of GSK321 in complex with IDH1R132H (PDB: 5DE1). Amino acid residues that directly interact with the inhibitor are shown in orange circles, with dotted lines indicating the formation of hydrogen bonds. In addition, key hydrophobic interactions of the inhibitor with the protein are indicated in turquoise.
Figure 11
Figure 11
Structure of butyl-phenyl sulfonamide-based inhibitors and radiolabeled analogs. (A) Structure of mIDH1-inhibitors with a butyl-phenyl sulfonamide backbone (highlighted in blue) [69,104]. (B) Radiolabeled butyl-phenyl sulfonamide-based inhibitors with the radiolabels indicated in red [69].
Figure 12
Figure 12
Structure of aminotriazine-based inhibitors and their interaction with IDH1R132H and IDH2R140Q. (A) Structure of preclinical and clinical mIDH1/2-selective inhibitors with an aminotriazine backbone (indicated in blue) [87,88]. (B) Scheme illustrating inhibitor-protein interactions in the crystal structures of AG-881 in complex with IDH1R132H (left, PDB: 6VEI) or IDH2R140Q (right, PDB: 6VFZ) homodimers. Amino acid residues that directly interact with the inhibitors are shown in orange circles, with dotted circles indicating residues belonging to the second monomer and dotted lines indicating the formation of hydrogen (orange) or halogen (green) bonds, respectively. In addition, key hydrophobic interactions of the inhibitors with the protein are indicated in turquoise. (C) Structure of the only radiolabeled analog of the inhibitors shown in A that has been described, with the radiolabel indicated in red [61].

Similar articles

Cited by

References

    1. Ostrom Q.T., Gittleman H., Truitt G., Boscia A., Kruchko C., Barnholtz-Sloan J.S. CBTRUS Statistical Report: Primary Brain and Other Central Nervous System Tumors Diagnosed in the United States in 2011–2015. Neuro. Oncol. 2018;20:iv1–iv86. doi: 10.1093/neuonc/noy131. - DOI - PMC - PubMed
    1. Reitman Z.J., Yan H. Isocitrate Dehydrogenase 1 and 2 Mutations in Cancer: Alterations at a Crossroads of Cellular Metabolism. JNCI J. Natl. Cancer Inst. 2010;102:932–941. doi: 10.1093/jnci/djq187. - DOI - PMC - PubMed
    1. Horbinski C. What Do We Know about IDH1/2 Mutations so Far, and How Do We Use It? Acta Neuropathol. 2013;125:621–636. doi: 10.1007/s00401-013-1106-9. - DOI - PMC - PubMed
    1. Han S., Liu Y., Cai S.J., Qian M., Ding J., Larion M., Gilbert M.R., Yang C. IDH Mutation in Glioma: Molecular Mechanisms and Potential Therapeutic Targets. Br. J. Cancer. 2020;122:1580–1589. doi: 10.1038/s41416-020-0814-x. - DOI - PMC - PubMed
    1. Dang L., White D.W., Gross S., Bennett B.D., Bittinger M.A., Driggers E.M., Fantin V.R., Jang H.G., Jin S., Keenan M.C., et al. Cancer-Associated IDH1 Mutations Produce 2-Hydroxyglutarate. Nature. 2009;462:739–744. doi: 10.1038/nature08617. - DOI - PMC - PubMed

Substances