

A 7-Hydroxy 4-Methylcoumarin Enhances Melanogenesis in B16-F10 Melanoma Cells
- PMID: 37049801
- PMCID: PMC10096152
- DOI: 10.3390/molecules28073039
A 7-Hydroxy 4-Methylcoumarin Enhances Melanogenesis in B16-F10 Melanoma Cells
Abstract
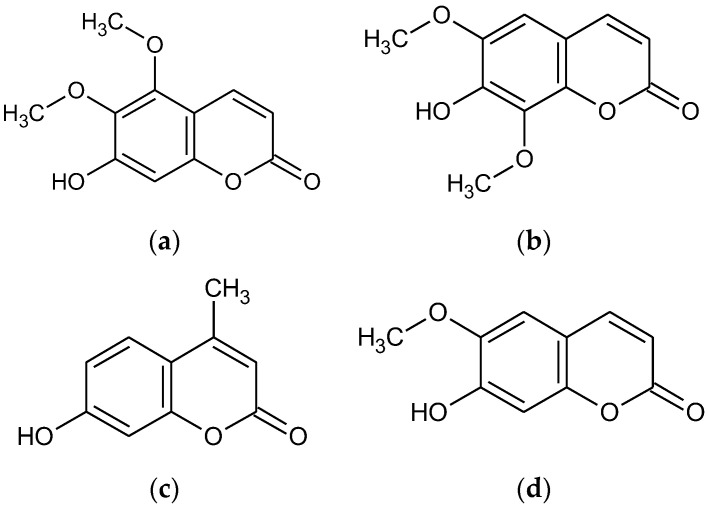
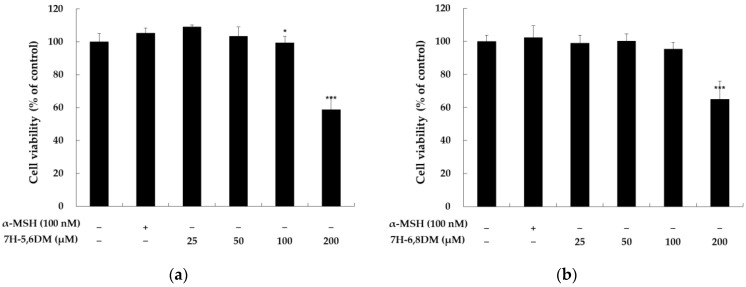
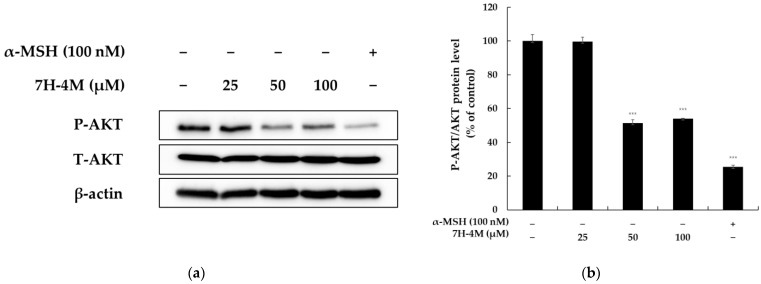
The objectives of this study were to investigate the melanogenetic potentials of the naturally occurring 7-hydroxy coumarin derivatives 7-hydroxy 5,6-dimethoxycoumarin (7H-5,6DM), 7-hydroxy 6,8-dimethoxycoumarin (7H-6,8DM), 7-hydroxy 6-methoxycoumarin (7H-6M), and 7-hydroxy 4-methylcoumarin (7H-4M) in the melanogenic cells model for murine B16F10 melanoma cells. The initial results indicated that melanin production and intracellular tyrosinase activity were significantly stimulated by 7H-4M but not by 7H-5,6DM, 7H-6,8DM, or 7H-6M. Therefore, our present study further investigated the melanogenic effects of 7H-4M in B16-F10 cells, as well as its mechanisms of action. In a concentration-dependent manner, 7H-4M increased intracellular tyrosinase activity, leading to the accumulation of melanin without affecting the viability of B16-F10 cells. Our study further investigated the effects of 7H-4M on melanogenesis, including its ability to promote tyrosinase activity, increase melanin content, and activate molecular signaling pathways. The results indicate that 7H-4M effectively stimulated tyrosinase activity and significantly increased the expression of melanin synthesis-associated proteins, such as microphthalmia-associated transcription factor (MITF), tyrosinase, tyrosinase-related protein-1 (TRP1), and TRP2. Based on our findings, we can conclude that 7H-4M has the ability to activate the melanogenesis process through the upregulation of cAMP-dependent protein kinase (PKA) and the cAMP response element-binding protein (CREB). Additionally, our study showed that 7H-4M induced melanogenic effects by downregulating the extracellular signal-regulated kinase (ERK) and the phosphatidylinositol 3 kinase (PI3K)/protein kinase B (Akt)/glycogen synthesis kinase-3β (GSK-3β) cascades, while upregulating the JNK and p38 signaling pathways. Finally, the potential of using 7H-4M in topical applications was tested through primary human skin irritation tests. During these tests, no adverse reactions were induced by 7H-4M. In summary, our results indicate that 7H-4M regulates melanogenesis through various signaling pathways such as GSK3β/β-catenin, AKT, PKA/CREB, and MAPK. These findings suggest that 7H-4M has the potential to prevent the development of pigmentation diseases.
Keywords: 7-hydroxy 4-methycoumarin; B16-F10; hypopigmentary; melanogenesis; signaling pathway.
Conflict of interest statement
The authors declare no conflict of interest.
Figures


Similar articles
-
Anti-Melanogenic Effects of L-Theanine on B16F10 Cells and Zebrafish.Molecules. 2025 Feb 19;30(4):956. doi: 10.3390/molecules30040956. Molecules. 2025. PMID: 40005265 Free PMC article.
-
Repurposing the Antibiotic D-Cycloserine for the Treatment of Hyperpigmentation: Therapeutic Potential and Mechanistic Insights.Int J Mol Sci. 2025 Aug 10;26(16):7721. doi: 10.3390/ijms26167721. Int J Mol Sci. 2025. PMID: 40869042 Free PMC article.
-
Imperatorin Positively Regulates Melanogenesis through Signaling Pathways Involving PKA/CREB, ERK, AKT, and GSK3β/β-Catenin.Molecules. 2022 Oct 2;27(19):6512. doi: 10.3390/molecules27196512. Molecules. 2022. PMID: 36235048 Free PMC article.
-
Natural sources of melanogenic inhibitors: A systematic review.Int J Cosmet Sci. 2022 Apr;44(2):143-153. doi: 10.1111/ics.12763. Epub 2022 Feb 22. Int J Cosmet Sci. 2022. PMID: 35048395
-
The melanin inhibitory effect of plants and phytochemicals: A systematic review.Phytomedicine. 2022 Dec;107:154449. doi: 10.1016/j.phymed.2022.154449. Epub 2022 Sep 6. Phytomedicine. 2022. PMID: 36126406
Cited by
-
6-Methylcoumarin Promotes Melanogenesis through the PKA/CREB, MAPK, AKT/PI3K, and GSK3β/β-Catenin Signaling Pathways.Molecules. 2023 Jun 5;28(11):4551. doi: 10.3390/molecules28114551. Molecules. 2023. PMID: 37299026 Free PMC article.
-
The Effects of 2'-Hydroxy-3,6'-Dimethoxychalcone on Melanogenesis and Inflammation.Int J Mol Sci. 2023 Jun 20;24(12):10393. doi: 10.3390/ijms241210393. Int J Mol Sci. 2023. PMID: 37373541 Free PMC article.
-
Metabolomic profiling reveals altered phenylalanine metabolism in Parkinson's disease in an Egyptian cohort.Front Mol Biosci. 2024 Mar 7;11:1341950. doi: 10.3389/fmolb.2024.1341950. eCollection 2024. Front Mol Biosci. 2024. PMID: 38516193 Free PMC article.
-
Fermentation of DaiDai fruit and its biological activity.Front Microbiol. 2024 Jul 15;15:1443283. doi: 10.3389/fmicb.2024.1443283. eCollection 2024. Front Microbiol. 2024. PMID: 39077743 Free PMC article.
-
Anti-Melanogenic and Anti-Inflammatory Effects of 2'-Hydroxy-4',6'-dimethoxychalcone in B16F10 and RAW264.7 Cells.Curr Issues Mol Biol. 2024 Jun 14;46(6):6018-6040. doi: 10.3390/cimb46060359. Curr Issues Mol Biol. 2024. PMID: 38921030 Free PMC article.
References
-
- Wang H.M., Qu L.Q., Ng J.P.L., Zeng W., Yu L., Song L.L., Wong V.K.W., Xia C.L., Law B.Y.K. Natural Citrus flavanone 5-demethylnobiletin stimulates melanogenesis through the activation of cAMP/CREB pathway in B16F10 cells. Phytomedicine. 2022;98:153941. doi: 10.1016/j.phymed.2022.153941. - DOI - PubMed
-
- Oh S.Y., Hyun C.G. Chrysoeriol Enhances Melanogenesis in B16F10 Cells Through the Modulation of the MAPK, AKT, PKA, and Wnt/β-Catenin Signaling Pathways. Nat. Prod. Commun. 2022;17:1934578X2110692. doi: 10.1177/1934578X211069204. - DOI
MeSH terms
Substances
LinkOut - more resources
Full Text Sources
Research Materials
Miscellaneous
