

An Overview on Fecal Profiles of Amino Acids and Related Amino-Derived Compounds in Children with Autism Spectrum Disorder in Tunisia
- PMID: 37050030
- PMCID: PMC10096484
- DOI: 10.3390/molecules28073269
An Overview on Fecal Profiles of Amino Acids and Related Amino-Derived Compounds in Children with Autism Spectrum Disorder in Tunisia
Abstract
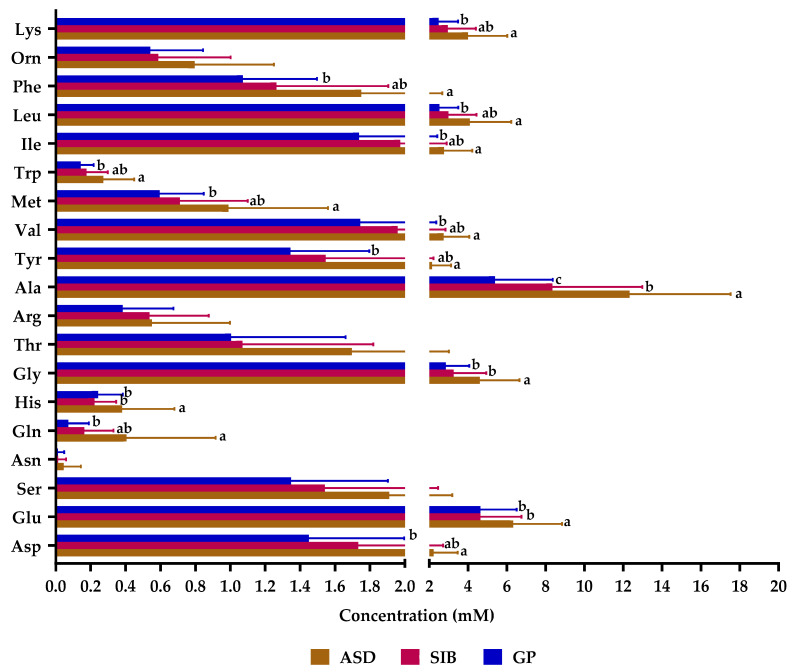
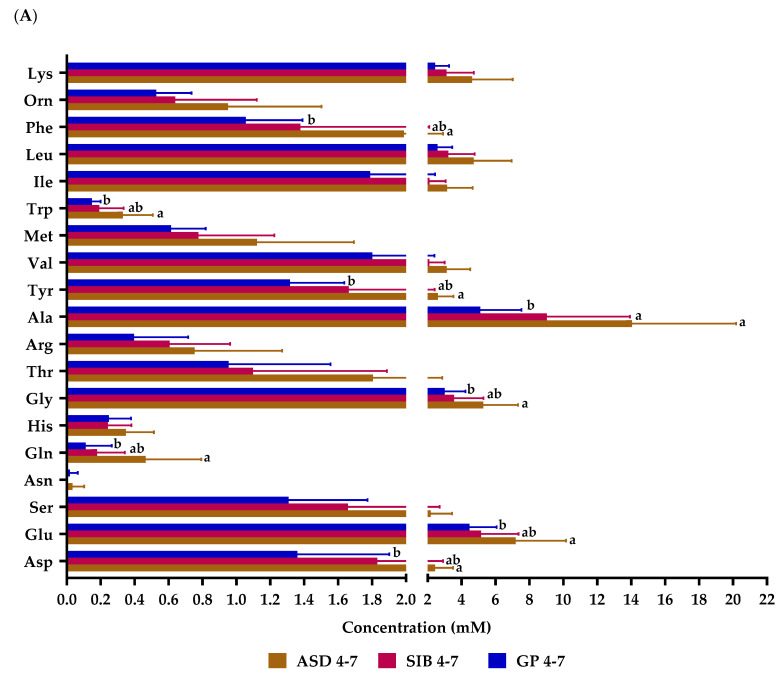
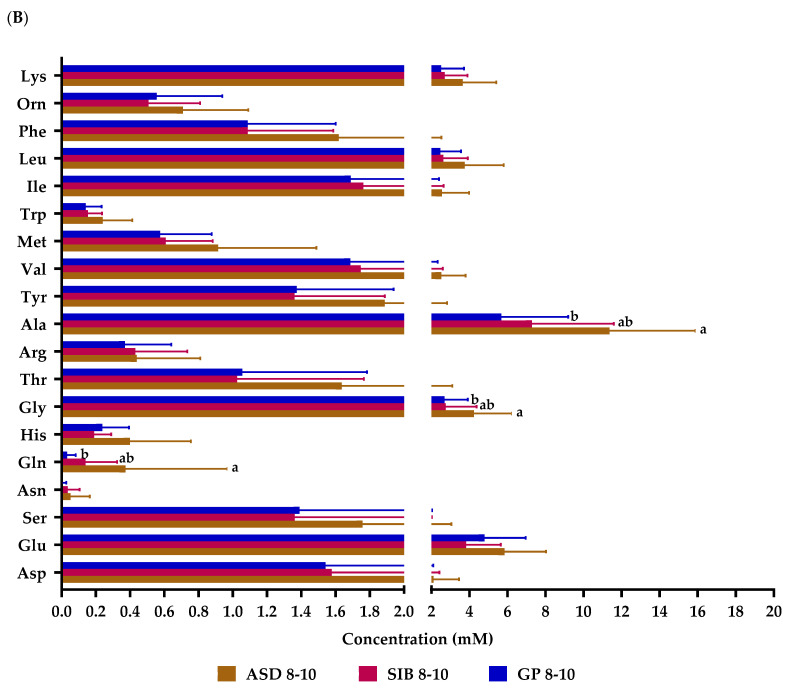
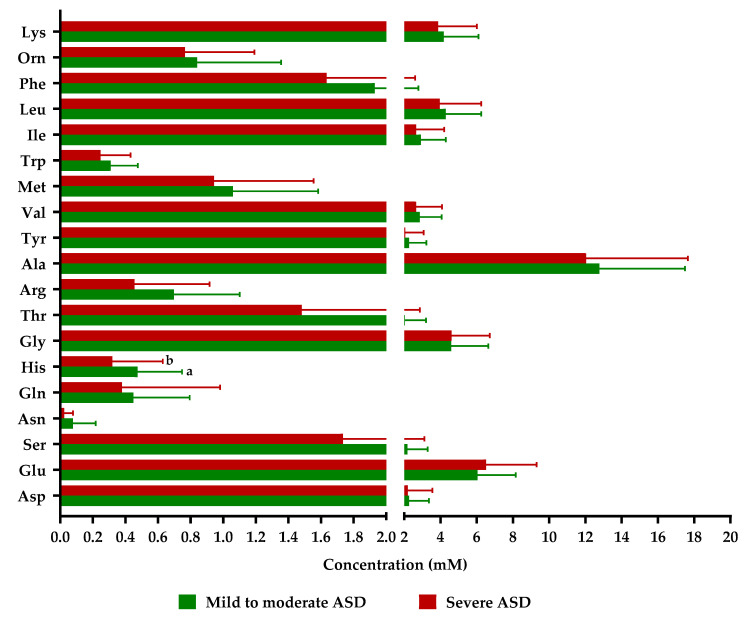
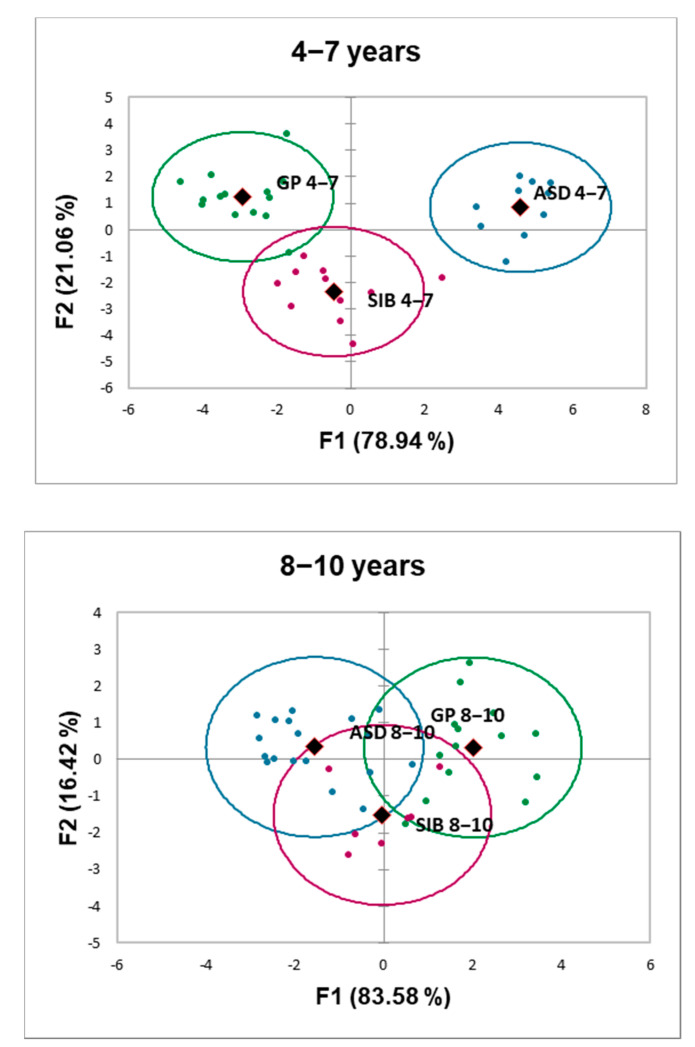
Autism spectrum disorder (ASD) is a neurodevelopmental pathology characterized by the impairment of social interaction, difficulties in communication, and repetitive behaviors. Alterations in the metabolism of amino acids have been reported. We performed a chromatographic analysis of fecal amino acids, ammonium, biogenic amines, and gamma aminobutyric acid (GABA) in Tunisian autistic children from 4 to 10 years, and results were compared with their siblings (SIB) and children from the general population (GP). ASD presented significantly higher levels of fecal amino acids than SIB and GP; differences being more pronounced in younger (4-7 years) than in older (8-10 years) individuals whereas no changes were found for the remaining compounds. Lower levels of histidine were the only difference related with severe symptoms of autism (CARS scale). A linear discriminant analysis (LDA) based on fecal amino acid profiles clearly separated ASD, SIB, and GP at 4 to 7 years but not at more advanced age (8-10 years), evidencing more pronounced alterations in younger children. The relationship of fecal amino acids with autism needs deeper research integrating blood analytical parameters, brain metabolism, and intestinal microbiota. Fecal amino acids could be targeted for designing personalized diets to prevent or minimize cognitive impairments associated with ASD.
Keywords: GABA; alanine; amino acids; autism; biogenic amines; feces; glutamate; neurotransmitters.
Conflict of interest statement
The authors declare no conflict of interest.
Figures
Similar articles
-
Age and severity-dependent gut microbiota alterations in Tunisian children with autism spectrum disorder.Sci Rep. 2023 Oct 25;13(1):18218. doi: 10.1038/s41598-023-45534-0. Sci Rep. 2023. PMID: 37880312 Free PMC article.
-
Altered gut microbiota and short chain fatty acids in Chinese children with autism spectrum disorder.Sci Rep. 2019 Jan 22;9(1):287. doi: 10.1038/s41598-018-36430-z. Sci Rep. 2019. PMID: 30670726 Free PMC article.
-
Distinct Fecal and Plasma Metabolites in Children with Autism Spectrum Disorders and Their Modulation after Microbiota Transfer Therapy.mSphere. 2020 Oct 21;5(5):e00314-20. doi: 10.1128/mSphere.00314-20. mSphere. 2020. PMID: 33087514 Free PMC article. Clinical Trial.
-
Biogenic Amine Metabolism and Its Genetic Variations in Autism Spectrum Disorder: A Comprehensive Overview.Biomolecules. 2025 Apr 7;15(4):539. doi: 10.3390/biom15040539. Biomolecules. 2025. PMID: 40305279 Free PMC article. Review.
-
Autism spectrum disorders and intestinal microbiota.Gut Microbes. 2015;6(3):207-13. doi: 10.1080/19490976.2015.1035855. Gut Microbes. 2015. PMID: 25835343 Free PMC article. Review.
Cited by
-
The Association Between Branched-Chain Amino Acid Concentrations and the Risk of Autism Spectrum Disorder in Preschool-Aged Children.Mol Neurobiol. 2024 Aug;61(8):6031-6044. doi: 10.1007/s12035-024-03965-4. Epub 2024 Jan 24. Mol Neurobiol. 2024. PMID: 38265552 Free PMC article.
-
Synthetic β-d-Glucuronides: Substrates for Exploring Glucuronide Degradation by Human Gut Bacteria.ACS Omega. 2024 Dec 20;10(1):1419-1428. doi: 10.1021/acsomega.4c09036. eCollection 2025 Jan 14. ACS Omega. 2024. PMID: 39829562 Free PMC article.
-
Intestinal Metabolome for Diagnosing and Prognosing Autism Spectrum Disorder in Children: A Systematic Review.Metabolites. 2025 Mar 21;15(4):213. doi: 10.3390/metabo15040213. Metabolites. 2025. PMID: 40278342 Free PMC article. Review.
-
A comparison between children and adolescents with autism spectrum disorders and healthy controls in biomedical factors, trace elements, and microbiota biomarkers: a meta-analysis.Front Psychiatry. 2024 Jan 9;14:1318637. doi: 10.3389/fpsyt.2023.1318637. eCollection 2023. Front Psychiatry. 2024. PMID: 38283894 Free PMC article.
-
A bibliometric analysis of autism spectrum disorder signaling pathways research in the past decade.Front Psychiatry. 2024 Feb 12;15:1304916. doi: 10.3389/fpsyt.2024.1304916. eCollection 2024. Front Psychiatry. 2024. PMID: 38410675 Free PMC article.
References
MeSH terms
Substances
Grants and funding
LinkOut - more resources
Full Text Sources
Medical
