

Genome Size Variation across a Cypriot Fabeae Tribe Germplasm Collection
- PMID: 37050095
- PMCID: PMC10096862
- DOI: 10.3390/plants12071469
Genome Size Variation across a Cypriot Fabeae Tribe Germplasm Collection
Abstract
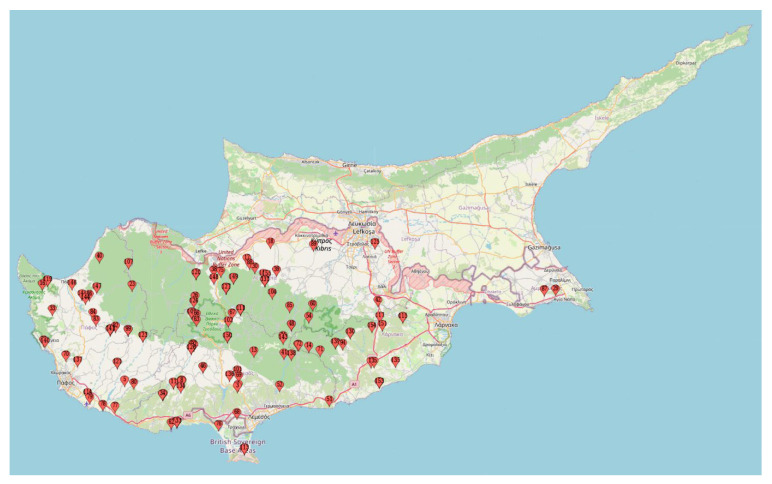
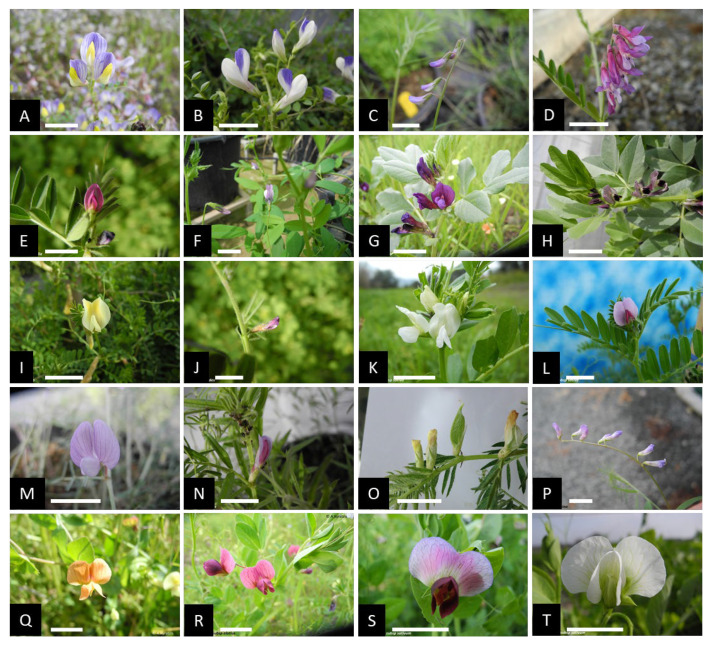
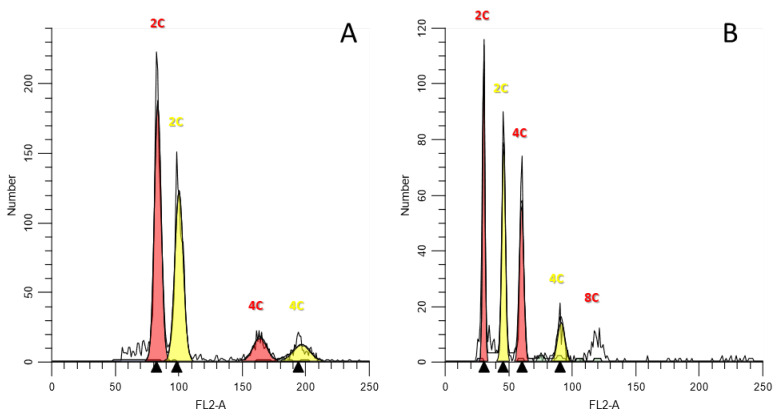
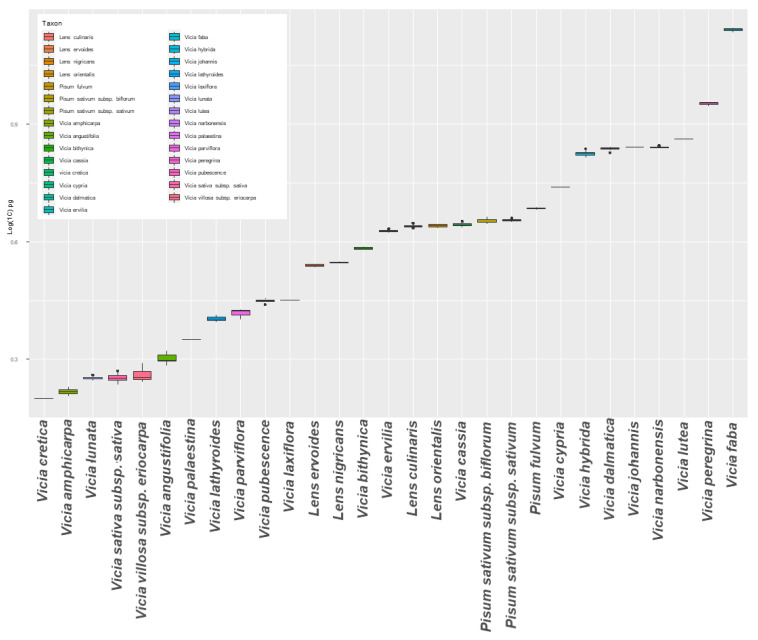
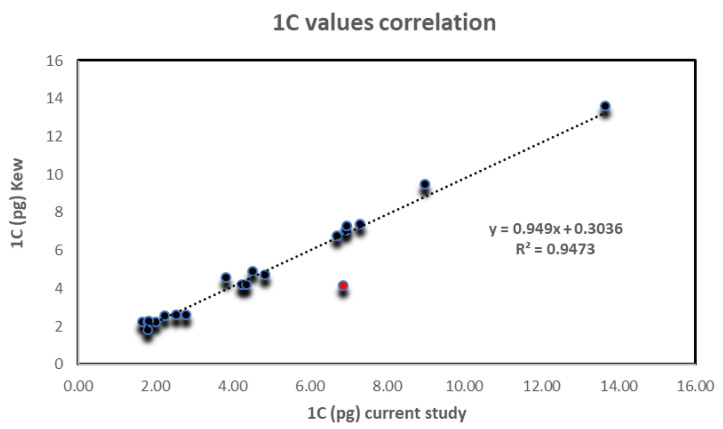
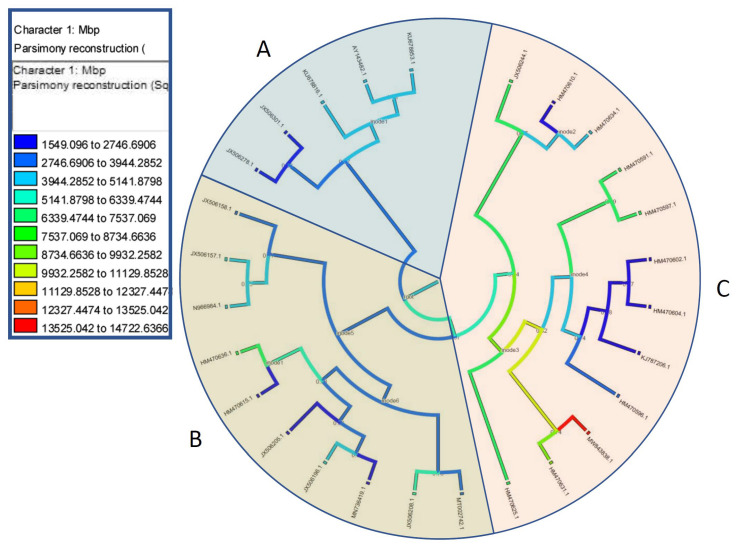
DNA content is an important trait linked to the evolutionary routes of taxa and often connected to speciation. In the present study, we studied C-values variation across the Cypriot Fabeae gene pool. Several hundred plants (Vicia spp., Lens spp., Pisum spp.) were sampled across Cyprus. Accurate estimates were established by flow cytometry and propidium iodine staining for 155 discrete populations/accessions. A ten-fold variation was detected across lineages with 1C DNA content varying from 1.584 pg for V. cretica (ARI02420) to 13.983 pg for V. faba (ARI00187). In general, flow cytometry was precise for the characterization of species, even though there were instances of genome overlapping across taxa. Most analyses in the current work refer to species that have not been characterized before by flow cytometry (or any other DNA content estimation method). Still, a correlation to C-values previously reported in Kew Plant DNA C-values database was attempted. A high degree of correlation except for V. dalmatica was established. The evaluation of genome size trait in relation with the Fabeae phylogeny, revealed that Pisum and Lens genera were rather homogenous, but an astonishing fluctuation was shown for Vicia spp. Moreover, it was established that genome up- or down-scaling was not directly linked to speciation drivers. The genomic size measurements presented here could deliver extra quality control for the identification and characterization of taxa in germplasm collections, particularly in cases where species share morphological characters.
Keywords: C-value; DNA content; flow cytometry; genetic resources; legumes.
Conflict of interest statement
The authors declare no conflict of interest.
Figures
Similar articles
-
Systematics, biogeography, and character evolution of the legume tribe Fabeae with special focus on the middle-Atlantic island lineages.BMC Evol Biol. 2012 Dec 25;12:250. doi: 10.1186/1471-2148-12-250. BMC Evol Biol. 2012. PMID: 23267563 Free PMC article.
-
In Depth Characterization of Repetitive DNA in 23 Plant Genomes Reveals Sources of Genome Size Variation in the Legume Tribe Fabeae.PLoS One. 2015 Nov 25;10(11):e0143424. doi: 10.1371/journal.pone.0143424. eCollection 2015. PLoS One. 2015. PMID: 26606051 Free PMC article.
-
Genome size variation and species relationships in Hieracium sub-genus Pilosella (Asteraceae) as inferred by flow cytometry.Ann Bot. 2007 Dec;100(6):1323-35. doi: 10.1093/aob/mcm218. Epub 2007 Oct 7. Ann Bot. 2007. PMID: 17921526 Free PMC article.
-
Phylogenetic significance of stylar features in genus Vicia (Leguminosae): an analysis with molecular phylogeny.J Plant Res. 2006 Sep;119(5):513-23. doi: 10.1007/s10265-006-0015-6. Epub 2006 Aug 29. J Plant Res. 2006. PMID: 16941065
-
Nuclear DNA amounts in angiosperms: targets, trends and tomorrow.Ann Bot. 2011 Mar;107(3):467-590. doi: 10.1093/aob/mcq258. Epub 2011 Jan 21. Ann Bot. 2011. PMID: 21257716 Free PMC article. Review.
Cited by
-
A Novel Sorbitol-Based Flow Cytometry Buffer Is Effective for Genome Size Estimation across a Cypriot Grapevine Collection.Plants (Basel). 2024 Mar 5;13(5):733. doi: 10.3390/plants13050733. Plants (Basel). 2024. PMID: 38475579 Free PMC article.
-
Genome Size Variation in Sesamum indicum L. Germplasm from Niger.Genes (Basel). 2024 May 29;15(6):711. doi: 10.3390/genes15060711. Genes (Basel). 2024. PMID: 38927647 Free PMC article.
References
-
- Macas J., Novak P., Pellicer J., Cizkova J., Koblizkova A., Neumann P., Fukova I., Dolezel J., Kelly L.J., Leitch I.J. In depth characterization of repetitive DNA in 23 plant genomes reveals sources of genome size variation in the legume tribe fabeae. PLoS ONE. 2015;10:e0143424. doi: 10.1371/journal.pone.0143424. - DOI - PMC - PubMed
-
- Fleischmann A., Michael T.P., Rivadavia F., Sousa A., Wang W., Temsch E.M., Greilhuber J., Müller K.F., Heubl G. Evolution of genome size and chromosome number in the carnivorous plant genus Genlisea (Lentibulariaceae), with a new estimate of the minimum genome size in angiosperms. Ann. Bot. 2014;114:1651–1663. doi: 10.1093/aob/mcu189. - DOI - PMC - PubMed
-
- Pellicer J., Fay M.F., Leitch I.J. The largest eukaryotic genome of them all? Bot. J. Linn. Soc. 2010;164:10–15.
LinkOut - more resources
Full Text Sources
Miscellaneous
