

Moringa oleifera Lam Leaf Extract Stimulates NRF2 and Attenuates ARV-Induced Toxicity in Human Liver Cells (HepG2)
- PMID: 37050167
- PMCID: PMC10097004
- DOI: 10.3390/plants12071541
Moringa oleifera Lam Leaf Extract Stimulates NRF2 and Attenuates ARV-Induced Toxicity in Human Liver Cells (HepG2)
Abstract
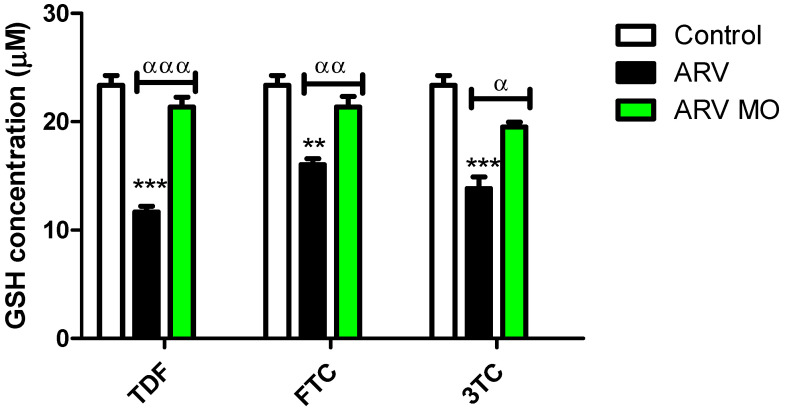
The World Health Organization (WHO) reported that there are 37 million individuals living with the human immunodeficiency virus (HIV) worldwide, with the majority in South Africa. This chronic disease is managed by the effective use of antiretroviral (ARV) drugs. However, with prolonged use, ARV drug-induced toxicity remains a clinically complex problem. This study investigated the toxicity of ARV drugs on mitochondria and the NRF2 antioxidant pathway and its possible amelioration using Moringa oleifera Lam (MO) leaf extracts. This medicinal plant has a range of functional bioactive compounds. Liver (HepG2) cells were treated with individual ARV drugs: Tenofovir disoproxil fumarate (TDF), Emtricitabine (FTC), and Lamivudine (3TC) for 96 h, followed by MO leaf extracts for 24 h. Intracellular ROS, cytotoxicity, lipid peroxidation, total and reduced glutathione (GSH), ATP, and mitochondrial polarisation were determined. Finally, protein (pNRF2, NRF2, SOD2, CAT, and Sirt3) and mRNA (NRF2, CAT, NQO1 SOD2, Sirt3, and PGC1α) expression were measured using Western blot and qPCR, respectively. TDF, FTC, and 3TC significantly increased intracellular ROS and extracellular levels of both MDA and LDH. ARVs also reduced the GSH and ATP levels and altered the mitochondrial polarization. Further, ARVs reduced the expression of NRF2 SOD2, Sirt3, CAT, NQO1, UCP2 and PGC1α mRNA and consequently pNRF2, NRF2, SOD2, Sirt3 and CAT protein. In contrast, there was a significant reduction in the extracellular MDA and LDH levels post-MO treatment. MO significantly reduced intracellular ROS while significantly increasing GSH, ATP, and mitochondrial membrane polarization. The addition of MO to ARV-treated cells significantly upregulated the expression of NRF2, SOD2, Sirt3, CAT, UCP2, PGC1α, and NQO1 mRNA and pNRF2, NRF2, SOD2, Sirt3 proteins. Thus, MO ameliorates ARV-induced hepatotoxicity by scavenging oxidants by inducing the NRF2 antioxidant pathway. MO shows great therapeutic potential and may be considered a potential supplement to ameliorate ARV drug toxicity.
Keywords: Moringa oleifera; NRF2 signalling; antioxidants; antiretroviral drugs; mitochondrial toxicity; oxidative stress.
Conflict of interest statement
The authors declare no conflict of interest.
Figures


Similar articles
-
Antiretrovirals Promote Metabolic Syndrome through Mitochondrial Stress and Dysfunction: An In Vitro Study.Biology (Basel). 2023 Apr 10;12(4):580. doi: 10.3390/biology12040580. Biology (Basel). 2023. PMID: 37106780 Free PMC article.
-
Fumonisin B1-induced oxidative stress triggers Nrf2-mediated antioxidant response in human hepatocellular carcinoma (HepG2) cells.Mycotoxin Res. 2019 Feb;35(1):99-109. doi: 10.1007/s12550-018-0335-0. Epub 2018 Nov 8. Mycotoxin Res. 2019. PMID: 30411198
-
Mitigating Hyperglycaemic Oxidative Stress in HepG2 Cells: The Role of Carica papaya Leaf and Root Extracts in Promoting Glucose Uptake and Antioxidant Defence.Nutrients. 2024 Oct 15;16(20):3496. doi: 10.3390/nu16203496. Nutrients. 2024. PMID: 39458491 Free PMC article.
-
The Hepatoprotective Effects of Moringa oleifera against Antiretroviral-Induced Cytotoxicity in HepG2 Cells: A Review.Plants (Basel). 2023 Sep 12;12(18):3235. doi: 10.3390/plants12183235. Plants (Basel). 2023. PMID: 37765399 Free PMC article. Review.
-
The Potential of Moringa oleifera to Ameliorate HAART-Induced Pathophysiological Complications.Cells. 2022 Sep 24;11(19):2981. doi: 10.3390/cells11192981. Cells. 2022. PMID: 36230942 Free PMC article. Review.
Cited by
-
Bioactive Compounds in Moringa oleifera: Mechanisms of Action, Focus on Their Anti-Inflammatory Properties.Plants (Basel). 2023 Dec 20;13(1):20. doi: 10.3390/plants13010020. Plants (Basel). 2023. PMID: 38202328 Free PMC article. Review.
-
Impact of Moringa oleifera leaf extract on renal histopathology, malondialdehyde, superoxide dismutase, and calcium oxalate crystals in rats (Rattus norvegicus) exposed to ethylene glycol.Open Vet J. 2025 Apr;15(4):1734-1746. doi: 10.5455/OVJ.2025.v15.i4.25. Epub 2025 Apr 30. Open Vet J. 2025. PMID: 40453835 Free PMC article.
References
-
- WHO Summary of the Global HIV Epidemic. [(accessed on 14 June 2022)];2020 Available online: https://www.who.int/data/gho/data/themes/hiv-aids.
-
- OMS UNAIDS-Global HIV & AIDS Statistics—2020 Fact Sheet. [(accessed on 12 July 2022)]; Available online: https://www.unaids.org/en/resources/fact-sheet.
-
- Department of Statistics South Africa STATISTICAL RELEASE-P0302 Mid-Year Population Estimates. [(accessed on 4 March 2022)];2021 Available online: https://www.statssa.gov.za/publications/P0302/P03022022.pdf.
Grants and funding
LinkOut - more resources
Full Text Sources
Miscellaneous
