. 2023 Mar 23;23(7):3377.
doi: 10.3390/s23073377.

Sensing Mechanisms of Rough Plasmonic Surfaces for Protein Binding of Surface Plasmon Resonance Detection

Affiliations

Sensing Mechanisms of Rough Plasmonic Surfaces for Protein Binding of Surface Plasmon Resonance Detection

Treesukon Treebupachatsakul et al. Sensors (Basel). .

Abstract

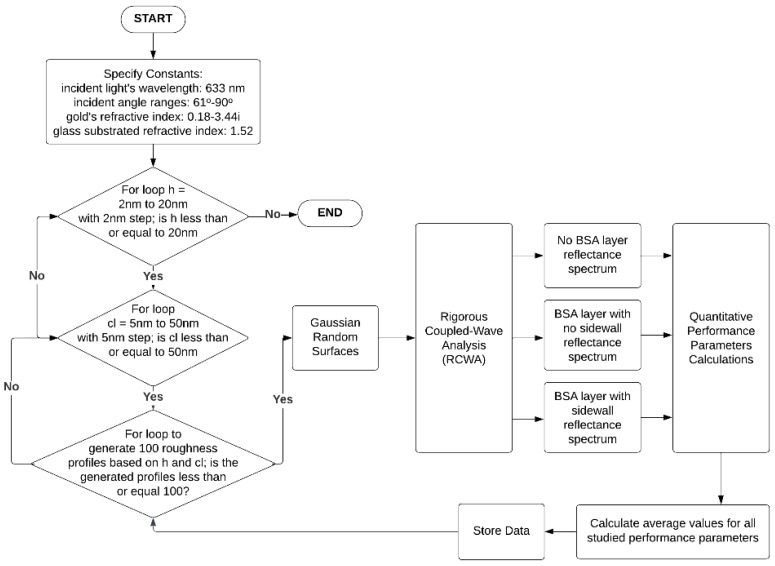
Surface plasmon resonance (SPR) has been utilized in various optical applications, including biosensors. The SPR-based sensor is a gold standard for protein kinetic measurement due to its ultrasensitivity on the plasmonic metal surface. However, a slight change in the surface morphology, such as roughness or pattern, can significantly impact its performance. This study proposes a theoretical framework to explain sensing mechanisms and quantify sensing performance parameters of angular surface plasmon resonance detection for binding kinetic sensing at different levels of surface roughness. The theoretical investigation utilized two models, a protein layer coating on a rough plasmonic surface with and without sidewall coatings. The two models enable us to separate and quantify the enhancement factors due to the localized surface plasmon polaritons at sharp edges of the rough surfaces and the increased surface area for protein binding due to roughness. The Gaussian random surface technique was employed to create rough metal surfaces. Reflectance spectra and quantitative performance parameters were simulated and quantified using rigorous coupled-wave analysis and Monte Carlo simulation. These parameters include sensitivity, plasmonic dip position, intensity contrast, full width at half maximum, plasmonic angle, and figure of merit. Roughness can significantly impact the intensity measurement of binding kinetics, positively or negatively, depending on the roughness levels. Due to the increased scattering loss, a tradeoff between sensitivity and increased roughness leads to a widened plasmonic reflectance dip. Some roughness profiles can give a negative and enhanced sensitivity without broadening the SPR spectra. We also discuss how the improved sensitivity of rough surfaces is predominantly due to the localized surface wave, not the increased density of the binding domain.

Keywords: binding-kinetics sensitivity; quantitative-sensing performance; sensing mechanisms; sensitivity-enhancement mechanisms; surface plasmon resonance; surface roughness.


Conflict of interest statement

The authors declare no conflict of interest.

Figures

Figure 1
Figure 1
(a) The Kretschmann configuration consisting of a water-based sensing region, BSA binding layer, noble metallic film, a glass substrate, and incident light, and (b) the SPR sensor’s outputs consisting of reflectance curves, measuring from the water-based environment sensing region shown in the blue curve and a 5 nm-thick BSA coating layer in water shown in the red curve.
Figure 2
Figure 2
The Gaussian random rough surface for h 20 nm of and cl of 5 nm for (a) no BSA protein coating case (bare gold case), (b) BSA protein without sidewall coating, and (c) BSA protein with sidewall coating. The figures on the right show the zoomed-in version of rough surfaces for the three models.
Figure 3
Figure 3
Simulated rough SPR sensor based on the Kretschmann configuration.
Figure 4
Figure 4
The flowchart of the overall simulation processes, including the rigorous coupled-wave analysis simulation, Monte Carlo simulation, and the performance parameters calculation.
Figure 5
Figure 5
The calculation procedures of the discussed quantitative performance parameters for the ideal uniform gold surface sensor, including (a) ΔI, FWHM, (b) S, and Isp.
Figure 6
Figure 6
(a) The convergence test for the four extreme cases of the rough surfaces constructed with h of 2 nm and cl of 5 nm (solid blue line), h of 2 nm and cl of 50 nm (dashed blue line), h of 20 nm and cl of 5 nm (solid red line), and h of 20 nm and cl of 50 nm (dashed red line), tested with the number of diffractions orders up to 171, and (b) The convergence test on the simulated columns for the rough surfaces at the same four extreme cases, illustrated as average plasmonic intensities of the no BSA model, the nonsidewall BSA model, and the sidewall BSA model.
Figure 7
Figure 7
SPR reflectance spectra simulated using the proposed procedure at different roughness parameters reported by Yang et al. [56].
Figure 8
Figure 8
S of the (a) nonsidewall BSA model, (b) sidewall BSA model at different roughness levels in rad/µm2, and (c) the increase of the protein density due to sidewalls in percent as the surface roughness increased.
Figure 9
Figure 9
(a) the reflectance spectra with a negative sensitivity at the operating point ‘a’, (b) degraded-sensitivity reflectance curves at the operating point ‘b’, (c) enhanced-sensitivity reflectance spectra at the operating point ‘c’, (d) highly enhanced-sensitivity reflectance spectra at the operating point ‘d’, and (e) the reflectance curves at the highly rough surface where the sensitivity cannot be computed at the operating point ‘e’. Note that the dotted curves indicate the plasmonic angles of the ideal uniform gold cases and the black arrows indicate the plasmonic angle shift direction.
Figure 10
Figure 10
(a) the average plasmonic dip location, n0sinθsp, for the three models at different roughness levels, and (b) the reflectance spectra from the nonprotein coated model at h of 0 nm (ideal smooth), 5 nm, 10 nm, and 15 nm, and the equivalent cl of 20 nm. (c) The FWHM of the SPR detection at different degrees of roughness and (d) reflectance spectra for the rough gold surface of h and cl of 18 nm and 40 nm, respectively, compared to the uniform gold surface. Note that the black arrows in (b) indicate the plasmonic angle shift direction when the h increased.
Figure 11
Figure 11
(a) the average ΔI and (b) the average Isp of both the nonsidewall BSA and the sidewall BSA models.
Figure 12
Figure 12
(a) the FoM1 of the BSA without the sidewall, (b) BSA with the sidewall model; (c) FoM2 for SPR detection [55] obtained from the BSA without the sidewall, and (d) BSA with the sidewall model.
Figure 13
Figure 13
The Δsinθsp for different deposited thicknesses of BSA from 0 nm (bare gold) to 10 nm for ideal smooth gold surface, rough gold surface with h of 9 nm, and cl of 8 nm for the no sidewall and sidewall coating cases.
Figure 14
Figure 14
(a) Intensity detection and (b) phase detection of the operating point ‘a’, ‘b’, ‘c’, ‘d’, and the theoretically uniform surface SPR-based sensor.
Figure 15
Figure 15
The plots of the total electric field intensity in the SI unit in the x-direction and z-direction (|Ex|2 + |Ez|2) on the gold-based SPR sensor with (a) an ideal smooth surface; (b) gratings structure with a gratings’ height of 24 nm, a gratings’ period of 500 nm, and a fill factor of 0.5; and (c) a rough sensing surface with h and cl of 9 nm and 8 nm, respectively (operating point ‘d’).

References

    1. Brongersma M.L., Kik P.G. Surface Plasmon Nanophotonics. Volume 131 Springer; Dordrecht, The Netherlands: 2007.
    1. Somekh M.G., Pechprasarn S. Handbook of Photonics for Biomedical Engineering. Springer; Dordrecht, The Netherlands: 2017. Surface plasmon, surface wave, and enhanced evanescent wave microscopy; pp. 503–543.
    1. Homola J., Yee S.S., Gauglitz G. Surface plasmon resonance sensors. Sens. Actuators B Chem. 1999;54:3–15. doi: 10.1016/S0925-4005(98)00321-9. - DOI
    1. Suda Y., Arano A., Fukui Y., Koshida S., Wakao M., Nishimura T., Kusumoto S., Sobel M. Immobilization and clustering of structurally defined oligosaccharides for sugar chips: An improved method for surface plasmon resonance analysis of protein-carbohydrate interactions. Bioconjug. Chem. 2006;17:1125–1135. doi: 10.1021/bc0600620. - DOI - PubMed
    1. Mariani S., Minunni M. Surface plasmon resonance applications in clinical analysis. Anal. Bioanal. Chem. 2014;406:2303–2323. doi: 10.1007/s00216-014-7647-5. - DOI - PMC - PubMed

MeSH terms

LinkOut - more resources