. 2023 Mar 27;23(7):3485.
doi: 10.3390/s23073485.

Bacterial Colony Phenotyping with Hyperspectral Elastic Light Scattering Patterns

Affiliations

Bacterial Colony Phenotyping with Hyperspectral Elastic Light Scattering Patterns

Iyll-Joon Doh et al. Sensors (Basel). .

Abstract

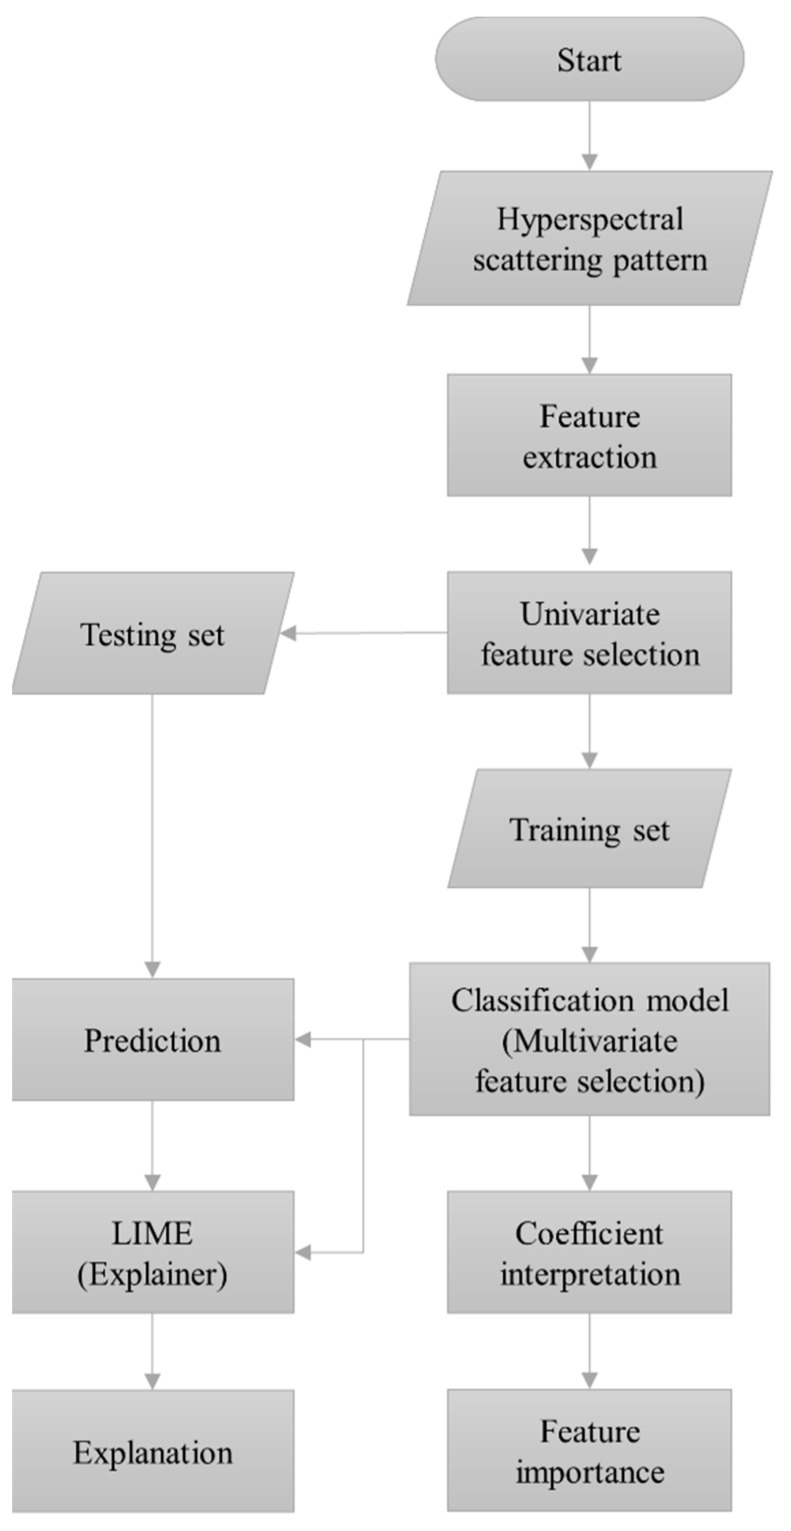
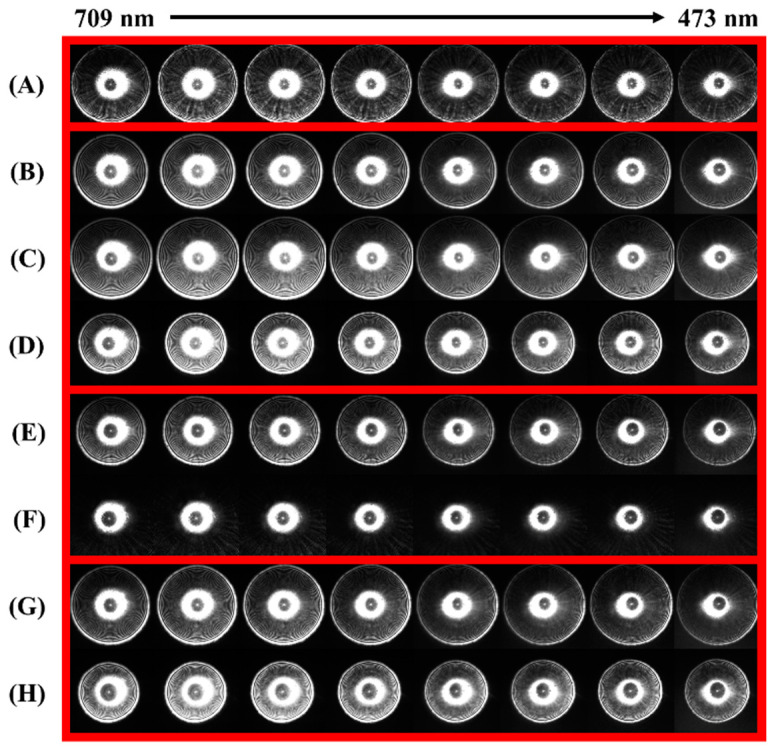
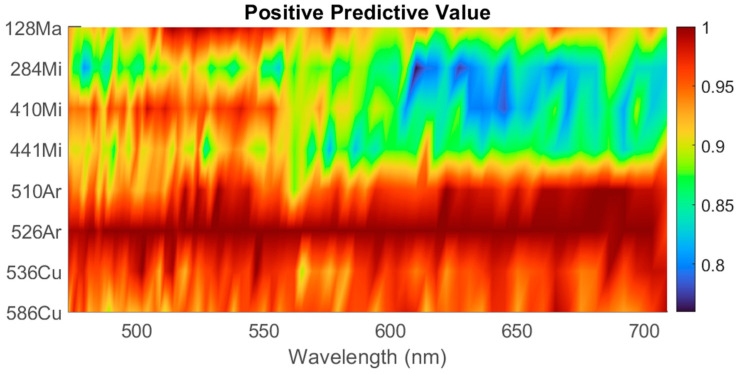
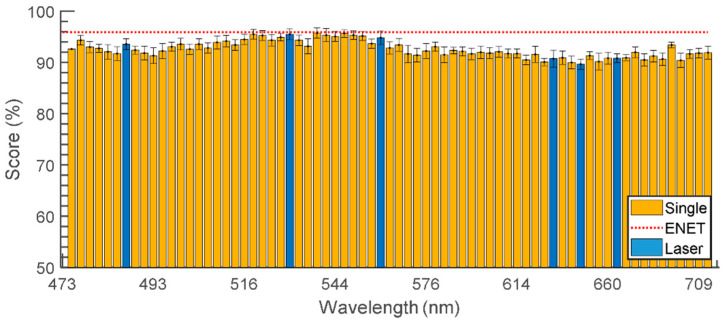
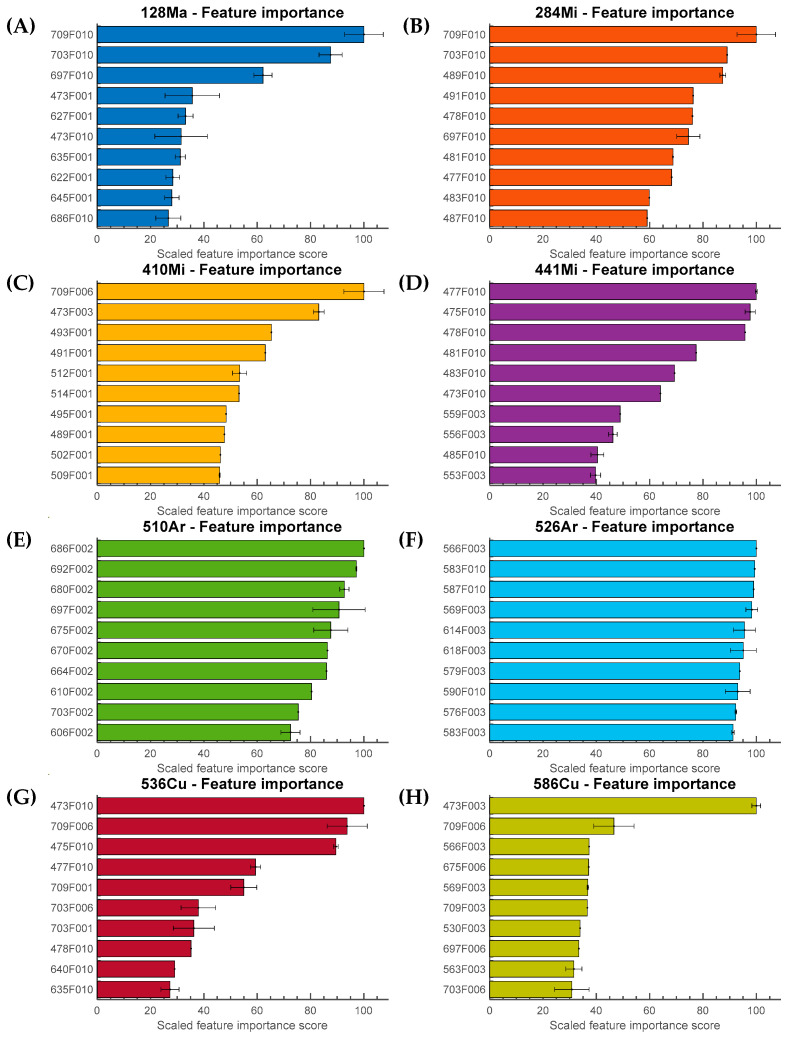
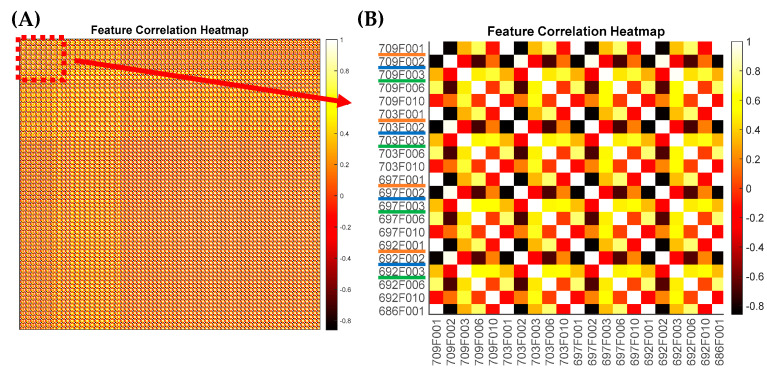
The elastic light-scatter (ELS) technique, which detects and discriminates microbial organisms based on the light-scatter pattern of their colonies, has demonstrated excellent classification accuracy in pathogen screening tasks. The implementation of the multispectral approach has brought further advantages and motivated the design and validation of a hyperspectral elastic light-scatter phenotyping instrument (HESPI). The newly developed instrument consists of a supercontinuum (SC) laser and an acousto-optic tunable filter (AOTF). The use of these two components provided a broad spectrum of excitation light and a rapid selection of the wavelength of interest, which enables the collection of multiple spectral patterns for each colony instead of relying on single band analysis. The performance was validated by classifying microflora of green-leafed vegetables using the hyperspectral ELS patterns of the bacterial colonies. The accuracy ranged from 88.7% to 93.2% when the classification was performed with the scattering pattern created at a wavelength within the 473-709 nm region. When all of the hyperspectral ELS patterns were used, owing to the vastly increased size of the data, feature reduction and selection algorithms were utilized to enhance the robustness and ultimately lessen the complexity of the data collection. A new classification model with the feature reduction process improved the overall classification rate to 95.9%.

Keywords: bacterial colony phenotyping; bacterial identification; elastic light scattering; hyperspectral imaging; light diffraction; optical sensing; supercontinuum laser.


Conflict of interest statement

The authors declare no conflict of interest.

Figures

Figure 1
Figure 1
A schematic diagram of the hyperspectral elastic light-scatter phenotyping instrument (HESPI) and flow chart of the measurement. The main components of the instrument are illustrated in different colors. The solid line represents the beam path whereas the dotted line is the sequence of controls.
Figure 2
Figure 2
A flowchart illustrating the feature processing methodology for the classification of hyperspectral ELS patterns. Univariate and multivariate feature selection techniques were utilized to alleviate the burden of high feature dimensionality, which increases the computational cost of classification and increases the likelihood of overfitting.
Figure 3
Figure 3
Representative images of the hyperspectral ELS patterns of the eight bacterial colonies: (A) 128—Massilia, (B) 284—Microbacterium, (C) 410—Microbacterium, (D) 441—Microbacterium, (E) 510—Arthrobacter, (F) 526—Arthrobacter, (G) 536—Curtobacterium, and (H) 586—Curtobacterium. The numbers before the bacteria name indicate the strain code that was assigned during the previous investigation. The wavelength ranged from 473 to 709 nm, and the sample organisms were grouped by their genera.
Figure 4
Figure 4
Positive predictive values for each organism in relation to the laser’s incident wavelength. The heatmap demonstrates that certain organisms are distinguished more effectively at specific wavelengths.
Figure 5
Figure 5
Classification performance of eight bacterial species utilizing the elastic net logistic regression classifier created with hyperspectral ELS data (n = 10).
Figure 6
Figure 6
Individual classification scores of SVM-based classifiers using single-wavelength ELS patterns where the bars highlighted in blue represent the common wavelength of diode lasers. The error bars represent the standard deviation. The dotted red line represents the classification score of the elastic net logistic regression model.
Figure 7
Figure 7
Top 10 contributing features and the normalized contribution values for individual organisms are presented: (A) 128-Massilia, (B) 284-Microbacterium, (C) 410-Microbacterium, (D) 441-Microbacterium, (E) 510-Arthrobacter, (F) 526-Arthrobacter, (G) 536-Curtobacterium, and (H) 586-Curtobacterium. The most contributing features for each organism are identified by LIME. The feature contribution was scaled based on the feature with the highest contribution value. The result is an average of 10 repetitions, and the error bar represents the standard deviation. The feature names are defined by their wavelength followed by “F” and the index position of the corresponding feature.
Figure 8
Figure 8
Top 10 predictive features and the normalized feature importance values for individual organisms are presented: (A) 128-Massilia, (B) 284-Microbacterium, (C) 410-Microbacterium, (D) 441-Microbacterium, (E) 510-Arthrobacter, (F) 526-Arthrobacter, (G) 536-Curtobacterium, and (H) 586-Curtobacterium. The most predictive features for each organism were identified by the ENET regression model coefficients. The feature importance was scaled based on the feature with the highest absolute coefficient value. The result is an average of 10 repetitions, and the error bar represents the standard deviation. The feature names are defined by their wavelength followed by ”F” and the index position of the corresponding feature.
Figure 9
Figure 9
A feature correlation heatmap is presented to demonstrate the correlation between the features across the wavelength: (A) shows the overall feature correlation heatmap, whereas (B) is the magnified area of the map closely viewing the correlation. The correlation value is between 1 and −1.

References

    1. Scallan E., Hoekstra R.M., Angulo F.J., Tauxe R.V., Widdowson M.-A., Roy S.L., Jones J.L., Griffin P.M. Foodborne Illness Acquired in the United States—Major Pathogens. Emerg. Infect. Dis. 2011;17:7–15. doi: 10.3201/eid1701.P11101. - DOI - PMC - PubMed
    1. Locke A., Fitzgerald S., Mahadevan-Jansen A. Advances in Optical Detection of Human-Associated Pathogenic Bacteria. Molecules. 2020;25:5256. doi: 10.3390/molecules25225256. - DOI - PMC - PubMed
    1. Bae E., Kim H., Rajwa B., Thomas J.G., Robinson J.P. Current Status and Future Prospects of Using Advanced Computer-Based Methods to Study Bacterial Colonial Morphology. Expert Rev. Anti Infect. Ther. 2016;14:207–218. doi: 10.1586/14787210.2016.1122524. - DOI - PubMed
    1. Minoni U., Signoroni A., Nassini G. On the Application of Optical Forward-Scattering to Bacterial Identification in an Automated Clinical Analysis Perspective. Biosens. Bioelectron. 2015;68:536–543. doi: 10.1016/j.bios.2015.01.047. - DOI - PubMed
    1. Marcoux P.R., Dupoy M., Cuer A., Kodja J.-L., Lefebvre A., Licari F., Louvet R., Narassiguin A., Mallard F. Optical Forward-Scattering for Identification of Bacteria within Microcolonies. Appl. Microbiol. Biotechnol. 2014;98:2243–2254. doi: 10.1007/s00253-013-5495-4. - DOI - PubMed

LinkOut - more resources