

General Purpose Transistor Characterized as Dosimetry Sensor of Proton Beams
- PMID: 37050831
- PMCID: PMC10098939
- DOI: 10.3390/s23073771
General Purpose Transistor Characterized as Dosimetry Sensor of Proton Beams
Abstract
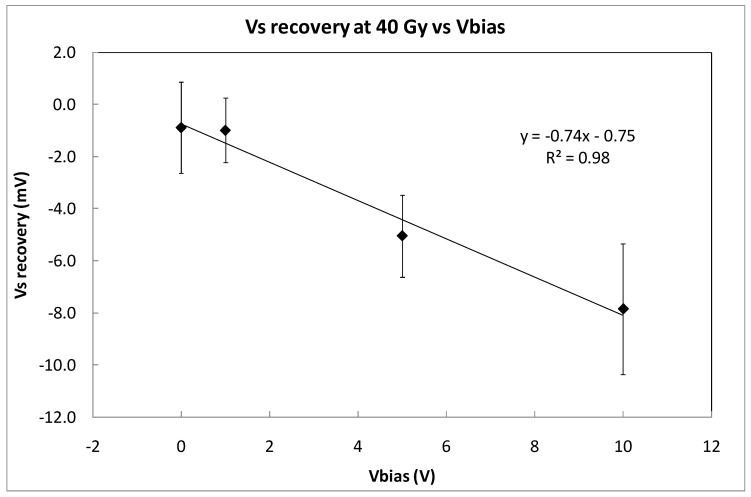
A commercial pMOS transistor (MOSFET), 3N163 from Vishay (USA), has been characterized as a low-energy proton beam dosimeter. The top of the samples' housing has been removed to guarantee that protons reached the sensitive area, that is, the silicon die. Irradiations took place at the National Accelerator Centre (Seville, Spain). During irradiations, the transistors were biased to improve the sensitivity, and the silicon temperature was monitored activating the parasitic diode of the MOSFET. Bias voltages of 0, 1, 5, and 10 V were applied to four sets of three transistors, obtaining an averaged sensitivity that was linearly dependent on this voltage. In addition, the short-fading effect was studied, and the uncertainty of this effect was obtained. The bias voltage that provided an acceptable sensitivity, (11.4 ± 0.9) mV/Gy, minimizing the uncertainty due to the fading effect (-0.09 ± 0.11) Gy was 1 V for a total absorbed dose of 40 Gy. Therefore, this off-the-shelf electronic device presents promising characteristics as a dosimeter sensor for proton beams.
Keywords: dosimetry; general purpose MOSFET; proton beams.
Conflict of interest statement
The funders had no role in the design of the study; in the collection, analyses, or interpretation of data; in the writing of the manuscript; or in the decision to publish the results.
Figures


Similar articles
-
Experimental evaluation of a MOSFET dosimeter for proton dose measurements.Phys Med Biol. 2006 Dec 7;51(23):6077-86. doi: 10.1088/0031-9155/51/23/009. Epub 2006 Nov 2. Phys Med Biol. 2006. PMID: 17110771
-
Thermal drift reduction with multiple bias current for MOSFET dosimeters.Phys Med Biol. 2011 Jun 21;56(12):3535-50. doi: 10.1088/0031-9155/56/12/006. Epub 2011 May 23. Phys Med Biol. 2011. PMID: 21606552
-
Calibration of GafChromic EBT3 for absorbed dose measurements in 5 MeV proton beam and (60)Co γ-rays.Med Phys. 2015 Aug;42(8):4678-84. doi: 10.1118/1.4926558. Med Phys. 2015. PMID: 26233195
-
Evaluation of a dual bias dual metal oxide-silicon semiconductor field effect transistor detector as radiation dosimeter.Med Phys. 1994 Apr;21(4):567-72. doi: 10.1118/1.597314. Med Phys. 1994. PMID: 8058024
-
Dosimetry of clinical neutron and proton beams: an overview of recommendations.Radiat Prot Dosimetry. 2004;110(1-4):565-72. doi: 10.1093/rpd/nch221. Radiat Prot Dosimetry. 2004. PMID: 15353710 Review.
Cited by
-
The SPICE Modeling of a Radiation Sensor Based on a MOSFET with a Dielectric HfO2/SiO2 Double-Layer.Sensors (Basel). 2025 Jan 18;25(2):546. doi: 10.3390/s25020546. Sensors (Basel). 2025. PMID: 39860914 Free PMC article.
References
LinkOut - more resources
Full Text Sources
