. 2023 Mar 27:10:1146442.
doi: 10.3389/fnut.2023.1146442. eCollection 2023.

Multimorbidity patterns and mortality in older adults: Results from the KORA-Age study

Affiliations

Multimorbidity patterns and mortality in older adults: Results from the KORA-Age study

Ava Arshadipour et al. Front Nutr. .

Abstract

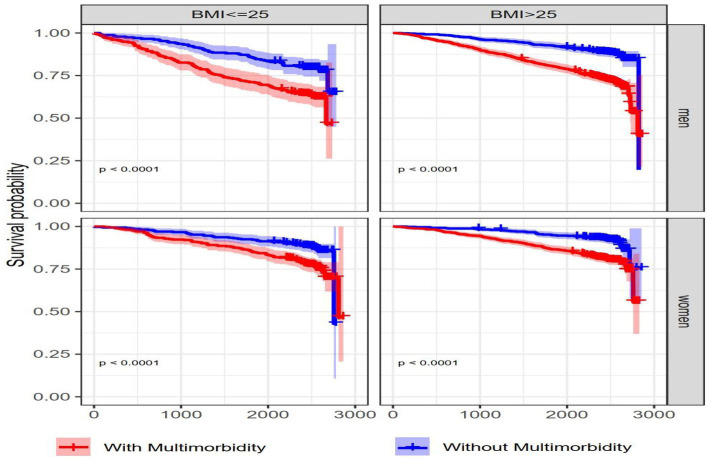
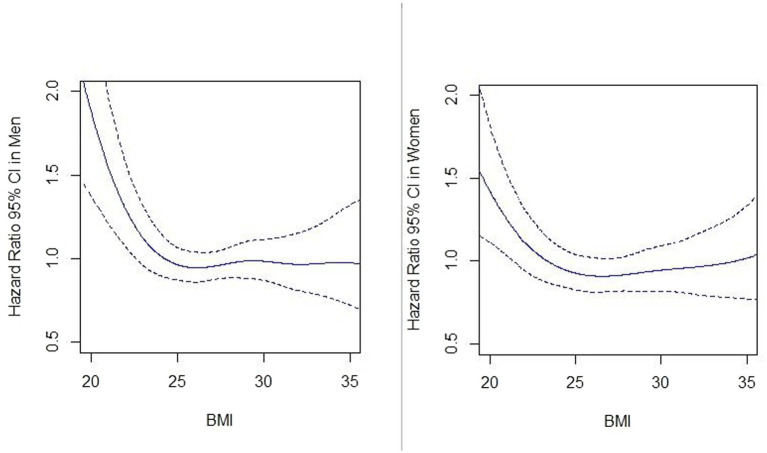
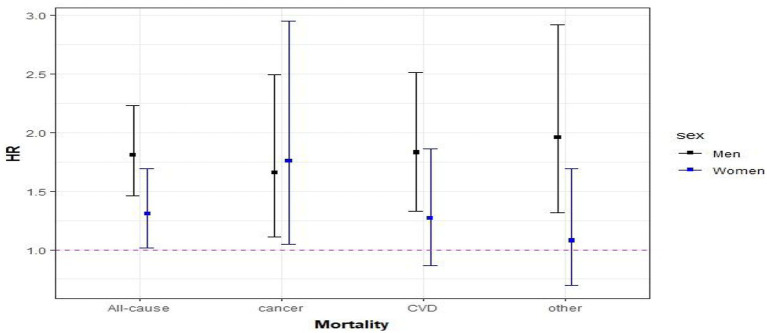
The coexistence of several chronic diseases is very common in older adults, making it crucial to understand multimorbidity (MM) patterns and associated mortality. We aimed to determine the prevalence of MM and common chronic disease combinations, as well as their impact on mortality in men and women aged 65 years and older using the population-based KORA-Age study, based in South of Germany. The chronic disease status of the participants was determined in 2008/9, and mortality status was followed up until 2016. MM was defined as having at least two chronic diseases. We used Cox proportional hazard models to calculate the hazard ratios (HRs) and the 95% confidence intervals (CIs) for associations between MM and all-cause mortality. During the study period 495 men (24.6%) and 368 women (17.4%) died. Although the MM prevalence was almost the same in men (57.7%) and women (60.0%), the overall effect of MM on mortality was higher in men (HR: 1.81, 95% CI: 1.47-2.24) than in women (HR: 1.28, 95% CI: 1.01-1.64; p-value for interaction <0.001). The type of disease included in the MM patterns had a significant impact on mortality risk. For example, when both heart disease and diabetes were included in the combinations of two and three diseases, the mortality risk was highest. The risk of premature death does not only depend on the number of diseases but also on the specific disease combinations. In this study, life expectancy depended strongly on a few diseases, such as diabetes, hypertension, and heart disease.

Keywords: chronic disease; hazard ratios; mortality; multimorbidity; older people; sex differences.


Conflict of interest statement

The authors declare that the research was conducted in the absence of any commercial or financial relationships that could be construed as a potential conflict of interest.

Figures

Figure 1
Figure 1
Kaplan–Meier survival curves for men and women with and without multimorbidity. Kaplan–Meier curve shows the time to death for individuals with and without MM. Censored data (vertical sign-on lines) denotes participants no longer available in KORA-Age 3 who did not experience death. There were statistically significant (p < 0.0001) differences in survival probability between 2 groups in both men and women based on the log-rank test.
Figure 2
Figure 2
Age stratified hazard ratios for the association of multimorbidity with all-cause mortality for men and women. Hazard ratios (95% CIs) for associations of MM with all-cause mortality were calculated for each age group and adjusted for education, family status, smoking habits, alcohol use, BMI, and physical activity.
Figure 3
Figure 3
Kaplan–Meier survival curves for men and women based on BMI and multimorbidity status. Kaplan–Meier curves show the comparison of survival probability between individuals with and without MM stratified by BMI category (<=25, >25) and sex. p-value <0.0001 are presented for the log-rank test.
Figure 4
Figure 4
Association between BMI (kg/m2) and all-cause mortality in men and women. Hazard ratios of all-cause mortality are calculated by the spline Cox proportional hazard model. Solid lines and dash lines, respectively, represent the hazard ratios and their 95% confidence intervals after adjusting for MM, age, education, family status, smoking habit, alcohol use, and physical activity.
Figure 5
Figure 5
Association between multimorbidity and cause-specific mortality. Hazard ratios (95% CIs) of MM were calculated for all-cause and cause-specific mortality and adjusted for education, family status, smoking habit, alcohol use, BMI, and physical activity.
Figure 6
Figure 6
Association between waist-hip ratio (WHR) with all-cause mortality in men and women. Hazard ratios of all-cause mortality are calculated by the spline Cox proportional hazard model. Solid lines and dash lines, respectively, represent the hazard ratios and their 95% confidence intervals after adjusting for MM, age, education, family status, smoking habit, alcohol use, and physical activity.

Similar articles

Cited by

References

    1. Uijen AA, van de Lisdonk EH. Multimorbidity in primary care: prevalence and trend over the last 20 years. Eur J Gen Pract. (2008) 14:28–32. doi: 10.1080/13814780802436093 - DOI - PubMed
    1. Kirchberger I, Meisinger C, Heier M, Zimmermann AK, Thorand B, Autenrieth CS, et al. . Patterns of multimorbidity in the aged population. Results from the KORA-age study. PLoS One. (2012) 7:e30556. doi: 10.1371/journal.pone.0030556, PMID: - DOI - PMC - PubMed
    1. Arshadipour A, Thorand B, Linkohr B, Rospleszcz S, Ladwig KH, Heier M, et al. . Impact of prenatal and childhood adversity effect around world war II on multimorbidity: results from the KORA-age study. BMC Geriatics. (2022) 22:115. doi: 10.1186/s12877-022-02793-2, PMID: - DOI - PMC - PubMed
    1. Agborsangaya CB, Lau D, Lahtinen M, Cooke T, Johnson JA. Health-related quality of life and healthcare utilization in multimorbidity: results of a cross-sectional survey. Qual Life Res. (2013) 22:791–9. doi: 10.1007/s11136-012-0214-7 - DOI - PubMed
    1. Soley-Bori M, Bisquera A, Ashworth M, Wang Y, Durbaba S, Dodhia H, et al. . Identifying multimorbidity clusters with the highest primary care use: 15 years of evidence from a multi-ethnic metropolitan population. Br J Gen Pract. (2021) 72:e190–8. doi: 10.3399/BJGP.2021.0325 - DOI - PMC - PubMed

LinkOut - more resources