. 2023 Mar 27:17:1142668.
doi: 10.3389/fnins.2023.1142668. eCollection 2023.

Retinal ganglion cells adapt to ionic stress in experimental glaucoma

Affiliations

Retinal ganglion cells adapt to ionic stress in experimental glaucoma

Andrew M Boal et al. Front Neurosci. .

Abstract

Introduction: Identification of early adaptive and maladaptive neuronal stress responses is an important step in developing targeted neuroprotective therapies for degenerative disease. In glaucoma, retinal ganglion cells (RGCs) and their axons undergo progressive degeneration resulting from stress driven by sensitivity to intraocular pressure (IOP). Despite therapies that can effectively manage IOP many patients progress to vision loss, necessitating development of neuronal-based therapies. Evidence from experimental models of glaucoma indicates that early in the disease RGCs experience altered excitability and are challenged with dysregulated potassium (K+) homeostasis. Previously we demonstrated that certain RGC types have distinct excitability profiles and thresholds for depolarization block, which are associated with sensitivity to extracellular K+.

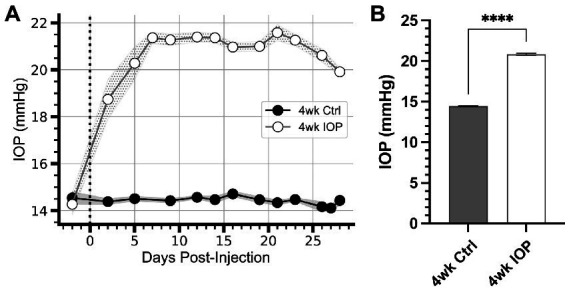
Methods: Here, we used our inducible mouse model of glaucoma to investigate how RGC sensitivity to K+ changes with exposure to elevated IOP.

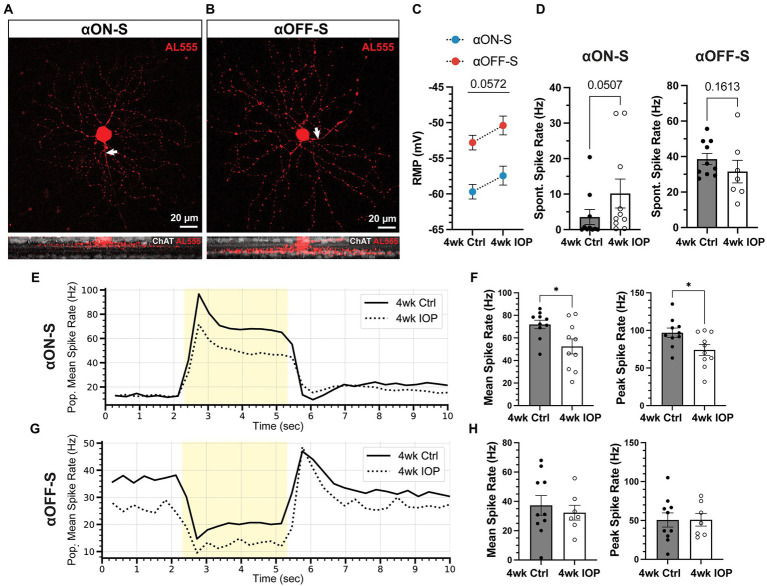
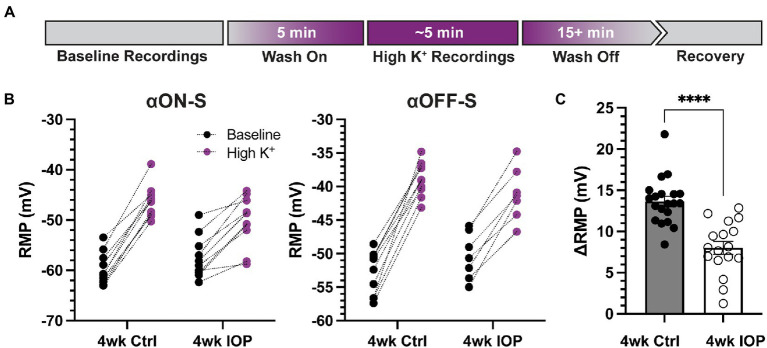
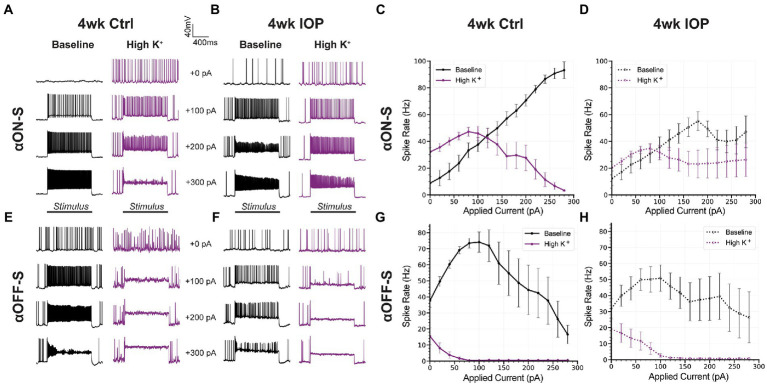
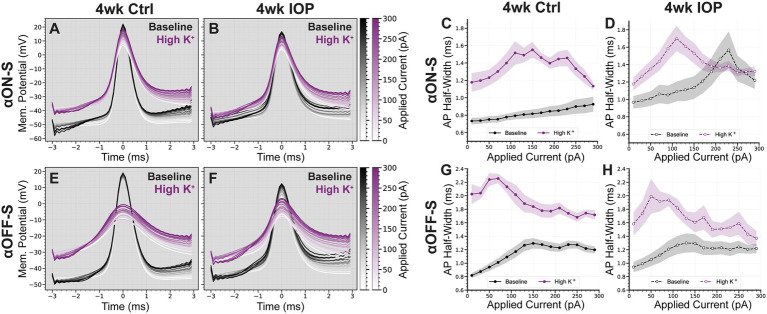
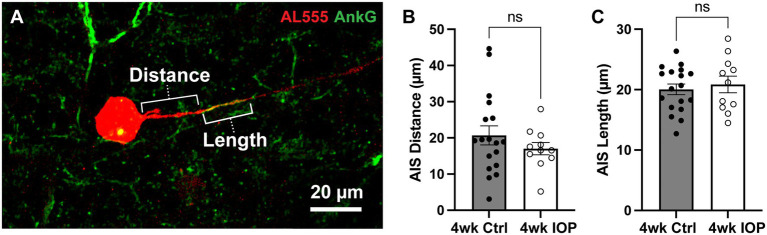
Results: In controls, conditions of increased K+ enhanced membrane depolarization, reduced action potential generation, and widened action potentials. Consistent with our previous work, 4 weeks of IOP elevation diminished RGC light-and current-evoked responses. Compared to controls, we found that IOP elevation reduced the effects of increased K+ on depolarization block threshold, with IOP-exposed cells maintaining greater excitability. Finally, IOP elevation did not alter axon initial segment dimensions, suggesting that structural plasticity alone cannot explain decreased K+ sensitivity.

Discussion: Thus, in response to prolonged IOP elevation RGCs undergo an adaptive process that reduces sensitivity to changes in K+ while diminishing excitability. These experiments give insight into the RGC response to IOP stress and lay the groundwork for mechanistic investigation into targets for neuroprotective therapy.

Keywords: action potential; excitability; glaucoma; neurodegeneration; physiology; potassium; retinal ganglion cells.


Conflict of interest statement

The authors declare that the research was conducted in the absence of any commercial or financial relationships that could be construed as a potential conflict of interest.

Figures

Figure 1
Figure 1
IOP elevation due to microbead occlusion of the anterior chamber. (A) Intraocular pressure (IOP) of microbead-injected eyes (4wk IOP) increases rapidly following injection (vertical dotted line) and remain elevated for the duration of the 4 weeks. The IOP of saline-injected eyes (4wk Ctrl) remains unchanged from baseline. Shaded region: ± standard error of the mean. (B) Mean IOP for each eye across all days following microbead injection significantly elevates compared to Ctrl (p = 0.000046, unpaired t-test). Error bars: ± standard error of the mean. ****p < 0.0001.
Figure 2
Figure 2
Elevated IOP alters membrane and light-evoked spiking characteristics in αON-S and αOFF-S RGCs. (A,B) Morphologic and physiologic characterization of retinal ganglion cells (RGCs). Patched cells were filled with Alexa-fluor 555 dye (AL555, red) and morphologically reconstructed with confocal microscopy. Representative maximum intensity projections of alpha ON-sustained (αON-S, A) and alpha OFF-sustained (αOFF-S, B) RGCs demonstrate characteristic soma size and dendritic branching patterns (upper). White arrows indicate the axonal projection. Orthogonal projections of representative AL555-filled cells co-labeled for choline acetyltransferase (ChAT, white) demonstrate the branching of αON-S and αOFF-S dendrites in the ON- and OFF-sublaminas of the inner plexiform layer, respectively (lower). (C) Resting membrane potentials (RMP) for both cell types from 4wk Ctrl and IOP groups. RGC RMPs in the 4wk IOP group are more depolarized than controls (p = 0.0572, 2-way ANOVA). (D) Spontaneous spiking rates for αON-S and αOFF-S RGCs. αON-S cells in the 4wk IOP group trend toward greater spontaneous spiking (p = 0.0507, Mann–Whitney test), whereas 4wk IOP αOFF-S cells trend toward less spontaneous spiking (p = 0.1613, Mann–Whitney test). (E) Mean firing rates of αON-S cells in the 4wk Ctrl and 4wk IOP groups binned into 200 ms intervals during light stimulation (yellow). (F) Mean (left) and peak (right) light-evoked spike rates for αON-S cells. 4wk IOP decreases both measures (mean: p = 0.0202, unpaired t-test; peak: p = 0.0251, unpaired t-test). (G) Mean firing rates of αOFF-S cells in the 4wk Ctrl and 4wk IOP groups binned into 200 ms intervals during light stimulation (yellow). (H) Mean (left) and peak (right) light-evoked spike rates for αOFF-S cells. Error bars: ± standard error of the mean. *p < 0.05.
Figure 3
Figure 3
Elevated IOP reduces the influence of extracellular potassium on RGC depolarization. (A) Timeline illustrating the design of acutely elevated extracellular potassium (High K+) experiments. Following baseline recordings, extracellular medium with an extra 5 mM KCl is washed on for 5 min until membrane potentials stabilized. High K+ recordings are done, and then high K+ is washed off with regular extracellular medium until full recovery of membrane potential and spontaneous spiking, at least 15 min. (B) Resting membrane potentials (RMPs) for αON-S and αOFF-S cells in both experimental groups before and after high K+ wash on. There is a significant interaction effect between K+ and IOP for both αON-S (p = 0.0002; 2-way repeated measures ANOVA) and αOFF-S (0.0063) cells. (C) The change in RMP following high K+ wash on for each cell, separated by experimental group. Cells exposed to 4wk IOP elevation are significantly less depolarized by high K+ (p = 0.00000091, Mann–Whitney test). Error bars: ± standard error of the mean. ****p < 0.0001.
Figure 4
Figure 4
Current-evoked spiking is less depressed by high K+ after IOP elevation. (A,B) Representative current-clamp responses of αON-S cells from both experimental groups to 0, 100, 200, and 300 pA pulses, before and after washing on high K+. (C,D) The spiking responses of αON-S cells to depolarizing current pulses ranging from 0 to 300 pA, before and after high K+. (E,F) Representative current-clamp responses of αOFF-S cells from both experimental groups before and after washing on high K+. (G,H) The spiking responses of αON-S cells to depolarizing current pulses, before and after high K+. The difference in spike rates between baseline and high K+ groups for all cells is lower in the 4wk IOP group than in the 4wk Ctrl (p = 0.0317, unpaired t-test). Error bars: ± standard error of the mean.
Figure 5
Figure 5
IOP elevation reduces the influence of high K+ on action potential shape. (A,B) Mean action potential (AP) shapes of αON-S cells in baseline and high K+ conditions at each current step, for 4wk Ctrl (A) and 4wk IOP (B) groups. (C,D) Action potential half-widths of αON-S cells in baseline and high K+ conditions at each current step, for 4wk Ctrl (C) and 4wk IOP (D) groups. (E,F) Mean action potential (AP) shapes of αOFF-S cells in baseline and high K+ conditions at each current step, for 4wk Ctrl (E) and 4wk IOP (F) groups. (G,H) Action potential half-widths of αOFF-S cells in baseline and high K+ conditions at each current step, for 4wk Ctrl (C) and 4wk IOP (D) groups. The potassium-induced widening of action potentials is lessened after 4wks IOP elevation (p = 0.0061, unpaired t-test). Shaded regions: ± standard error of the mean.
Figure 6
Figure 6
Axon initial segment dimensions are unchanged by IOP elevation. (A) Representative image of Alexa 555 (AL555, red) dye-filled RGC labeled for the axon initial segment (AIS) scaffolding protein ankyrin-G (AnkG, green). Annotations demonstrate the dimensions of AIS distance from soma and length which are quantified. (B,C) The AIS distance from the soma (B) and length (C) for all RGCs with AnkG-labeled axons. 4wk IOP does not significantly alter either of these dimensions (Distance: p = 0.3194, unpaired t-test; Length: p = 0.6007, unpaired t-test). Error bars: ± standard error of the mean.

Similar articles

Cited by

References

    1. Alexander T. D., Muqeem T., Zhi L., Tymanskyj S. R., Covarrubias M. L. (2022). Tunable action potential repolarization governed by Kv3.4 channels in dorsal root ganglion neurons. J. Neurosci. 42, 8647–8657. doi: 10.1523/JNEUROSCI.1210-22.2022, PMID: - DOI - PMC - PubMed
    1. Baden T., Berens P., Franke K., Roman Roson M., Bethge M., Euler T. (2016). The functional diversity of retinal ganglion cells in the mouse. Nature 529, 345–350. doi: 10.1038/nature16468, PMID: - DOI - PMC - PubMed
    1. Bae J. A., Mu S., Kim J. S., Turner N. L., Tartavull I., Kemnitz N., et al. . (2018). Digital Museum of Retinal Ganglion Cells with dense anatomy and physiology. Cell 173, 1293–1306.e19. doi: 10.1016/j.cell.2018.04.040, PMID: - DOI - PMC - PubMed
    1. Boal A. M., McGrady N. R., Risner M. L., Calkins D. J. (2022). Sensitivity to extracellular potassium underlies type-intrinsic differences in retinal ganglion cell excitability. Front. Cell. Neurosci. 16:966425. doi: 10.3389/fncel.2022.966425, PMID: - DOI - PMC - PubMed
    1. Boal A. M., Risner M. L., Cooper M. L., Wareham L. K., Calkins D. J. (2021). Astrocyte networks as therapeutic targets in glaucomatous neurodegeneration. Cells 10:1368. doi: 10.3390/cells10061368, PMID: - DOI - PMC - PubMed

LinkOut - more resources