. 2023 Apr 3:2023:1335201.
doi: 10.1155/2023/1335201. eCollection 2023.

eEF1A2 siRNA Suppresses MPP+-Induced Activation of Akt and mTOR and Potentiates Caspase-3 Activation in a Parkinson's Disease Model

Affiliations

eEF1A2 siRNA Suppresses MPP+-Induced Activation of Akt and mTOR and Potentiates Caspase-3 Activation in a Parkinson's Disease Model

Kawinthra Khwanraj et al. ScientificWorldJournal. .

Abstract

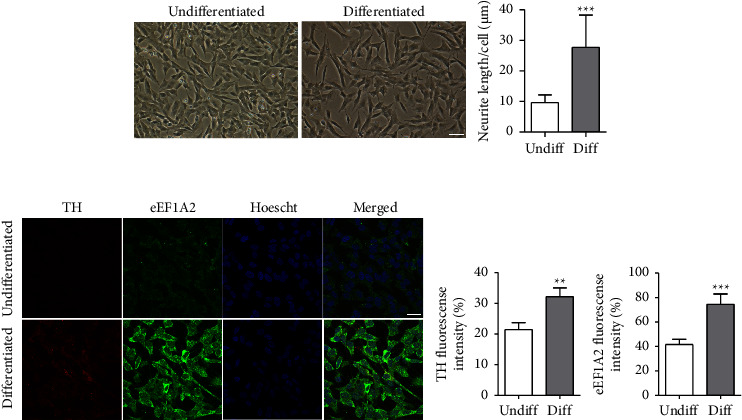
The tissue-specific protein eEF1A2 has been linked to the development of neurological disorders. The role of eEF1A2 in the pathogenesis of Parkinson's disease (PD) has yet to be investigated. The aim of this study was to determine the potential neuroprotective effects of eEF1A2 in an MPP+ model of PD. Differentiated SH-SY5Y cells were transfected with eEF1A2 siRNA, followed by MPP+ exposure. The expression of p-Akt1 and p-mTORC1 was determined using Western blotting. The expression of p53, Bax, Bcl-2, and caspase-3 was evaluated using qRT-PCR. Cleaved caspase-3 levels and Annexin V/propidium iodide flow cytometry were used to determine apoptosis. The effects of PI3K inhibition were examined. The results showed that eEF1A2 siRNA significantly reduced the eEF1A2 expression induced by MPP+. MPP+ treatment activated Akt1 and mTORC1; however, eEF1A2 knockdown suppressed this activation. In eEF1A2-knockdown cells, MPP+ treatment increased the expression of p53 and caspase-3 mRNA levels as well as increased apoptotic cell death when compared to MPP+ treatment alone. In cells exposed to MPP+, upstream inhibition of the Akt/mTOR pathway, by either LY294002 or wortmannin, inhibited the phosphorylation of Akt1 and mTORC1. Both PI3K inhibitors increased eEF1A2 expression in cells, whether or not they were also treated with MPP+. In conclusion, eEF1A2 may function as a neuroprotective factor against MPP+, in part by regulating the Akt/mTOR pathway upstream.


Conflict of interest statement

The authors declare that they have no conflicts of interest.

Figures

Figure 1
Figure 1
Differentiation of SH-SY5Y cells. (a) SH-SY5Y cells were treated with 10 μM retinoic acid for 3 days. Phase-contrast micrographs shows morphological changes in SH-SY5Y cells after differentiation. Graph represents the length of neurite outgrowths of differentiated cells. Scale bar = 40 µm. Data are expressed as mean ± SD. ∗∗∗p < 0.001. (b) Confocal immunofluorescence micrographs showing the expression of the TH and eEF1A2 proteins in differentiated SH-SY5Y cells. Scale bar = 25 µm. Graphs represent the fluorescence intensity of TH and eEF1A2. Data are expressed as mean ± SEM from three experiments with triplicates each. ∗∗p < 0.01, ∗∗∗p < 0.001. Hoechst, nuclear stain; eEF1A2, eukaryotic elongation factor alpha 2; TH, tyrosine hydroxylase.
Figure 2
Figure 2
eEF1A2 knockdown reduces eEF1A2 expression and reduces phosphorylation of Akt1 and mTORC1 induced by MPP+. Western blot assays were performed in SH-SY5Y neuronal cells after eEF1A2 siRNA transfection and MPP+ treatment. (a) Immunoblots of eEF1A2 protein. (b) Immunoblots of phospho-Akt1 protein. (c) Immunoblots of phospho-mTORC1 protein. The density of the bands was normalized with that of β-actin protein. Data are expressed as mean ± SEM (n = 3). p < 0.05, ∗∗p < 0.01, ∗∗∗p < 0.001 versus untransfected control; ###p < 0.001 versus MPP+. NC, negative control; 1A2, eEF1A2.
Figure 3
Figure 3
Effects of eEF1A2 knockdown on apoptosis induced by MPP+ in SH-SY5Y neuronal cells. (a) Cell viability using an MTT assay. (b–d) Expression of p53, Bax/Bcl-2 ratio, and caspase-3 using quantitative real-time PCR. The expression levels of the mRNAs were normalized to the expression level of β-actin. (e) Apoptotic nuclear morphology observed using Hoechst 33258 staining. Scale bar = 30 µm. Graph represents the percentage of cells with apoptotic nuclei. (f) Graphs represent the percentage of Annexin V-positive cells obtained by Annexin V/PI flow cytometry. (g) Graph represents the relative ratio of cleaved caspase-3 to procaspase-3 protein expression obtained from Western blot assay. The density of the bands was normalized with that of β-actin protein. Data are represented as mean ± SEM from three experiments with triplicates each. p < 0.05, ∗∗p < 0.01, and ∗∗∗p < 0.001 versus untransfected control; #p < 0.05, ##p < 0.01, and ###p < 0.001 versus MPP+ treatment alone. 1A2, eEF1A2.
Figure 4
Figure 4
PI3K inhibitors reduce phospho-Akt and phospho-mTOR and potentiate cell death in MPP+-treated SH-SY5Y neuronal cells. (a) Immunoblots of phospho-Akt protein. (b) Immunoblots of phospho-mTOR protein. The density of the bands was normalized with that of β-actin protein. (c) Cell viability examined using the MTT assay. (d) Apoptotic nuclear morphology observed using Hoechst 33258 staining. Scale bar = 30 µm. Graph represents the percentage of cells with apoptotic nuclei. (e) Graphs represent the percentage of Annexin V-positive cells obtained from Annexin V/PI flow cytometry. Data are expressed as mean ± SEM (n = 3). p < 0.05, ∗∗p < 0.01, ∗∗∗p < 0.001 versus control; #p < 0.05, ##p <  0.01, ###p < 0.001 versus MPP+ treatment.
Figure 5
Figure 5
PI3K inhibitors increase eEF1A2 expression. SH-SY5Y neuronal cells were pretreated with 50 μM LY294002 or 1 μM wortmannin for 1 h followed by exposure to 1000 μM of MPP+ for 24 h. Western blot assay was used to detect the expression of eEF1A2. The density of the bands was normalized with that of β-actin protein. Data are expressed as mean ± SEM (n = 3). ∗∗∗p < 0.001 versus control; ##p < 0.01 versus MPP+.
Figure 6
Figure 6
Conceptualized diagram of the effect of eEF1A2 knockdown on the Akt/mTOR pathway in MPP+-treated SH-SY5Y neuronal cells.

Similar articles

Cited by

References

    1. Sivan G., Aviner R., Elroy-Stein O. Mitotic modulation of translation elongation factor 1 leads to hindered tRNA delivery to ribosomes. Journal of Biological Chemistry . 2011;286(32):27927–27935. doi: 10.1074/jbc.M111.255810. - DOI - PMC - PubMed
    1. Knudsen S. M., Frydenberg J., Clark B. F. C., Leffers H. Tissue-dependent variation in the expression of elongation factor-1alpha isoforms: i. European Journal of Biochemistry . 1993;215(3):549–554. doi: 10.1111/j.1432-1033.1993.tb18064.x. - DOI - PubMed
    1. Kahns S., Lund A., Kristensen P., et al. The elongation factor 1 A-2 isoform from rabbit: cloning of the cDNA and characterization of the protein. Nucleic Acids Research . 1998;26(8):1884–1890. doi: 10.1093/nar/26.8.1884. - DOI - PMC - PubMed
    1. Chambers D. M., Peters J., Abbott C. M. The lethal mutation of the mouse wasted (wst) is a deletion that abolishes expression of a tissue-specific isoform of translation elongation factor 1α, encoded by the Eef1a2 gene. Proceedings of the National Academy of Sciences of the U S A . 1998;95(8):4463–4468. doi: 10.1073/pnas.95.8.4463. - DOI - PMC - PubMed
    1. Worst T. S., Waldbillig F., Abdelhadi A., et al. The EEF1A2 gene expression as risk predictor in localized prostate cancer. BMC Urology . 2017;17(1):p. 86. doi: 10.1186/s12894-017-0278-3. - DOI - PMC - PubMed

MeSH terms