

Molecular signature of methotrexate response among rheumatoid arthritis patients
- PMID: 37051216
- PMCID: PMC10084884
- DOI: 10.3389/fmed.2023.1146353
Molecular signature of methotrexate response among rheumatoid arthritis patients
Abstract
Background: Methotrexate (MTX) is the first line treatment for rheumatoid arthritis (RA), but failure of satisfying treatment response occurs in a significant proportion of patients. Here we present a longitudinal multi-omics study aimed at detecting molecular and cellular processes in peripheral blood associated with a successful methotrexate treatment of rheumatoid arthritis.
Methods: Eighty newly diagnosed patients with RA underwent clinical assessment and donated blood before initiation of MTX, and 3 months into treatment. Flow cytometry was used to describe cell types and presence of activation markers in peripheral blood, the expression of 51 proteins was measured in serum or plasma, and RNA sequencing was performed in peripheral blood mononuclear cells (PBMC). Response to treatment after 3 months was determined using the EULAR response criteria. We assessed the changes in biological phenotypes during treatment, and whether these changes differed between responders and non-responders with regression analysis. By using measurements from baseline, we also tried to find biomarkers of future MTX response or, alternatively, to predict MTX response.
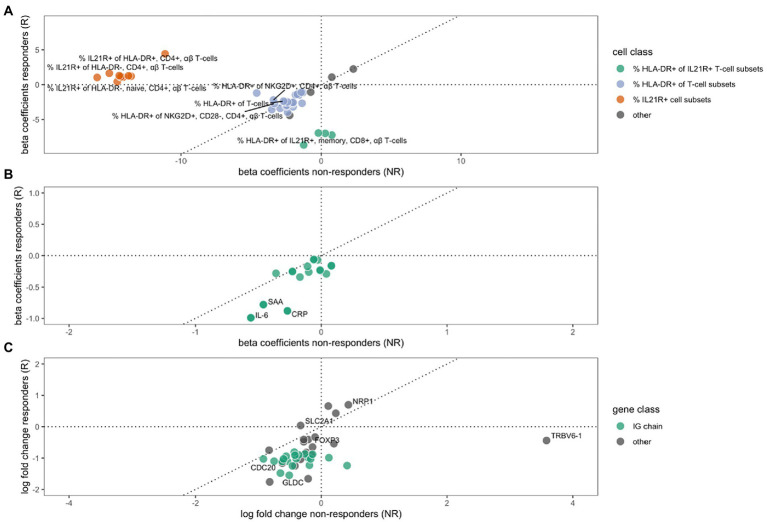
Results: Among the MTX responders, (Good or Moderate according to EULAR treatment response classification, n = 60, 75%), we observed changes in 29 partly overlapping cell types proportions, levels of 13 proteins and expression of 38 genes during treatment. These changes were in most cases suppressions that were stronger among responders compared to non-responders. Within responders to treatment, we observed a suppression of FOXP3 gene expression, reduction of immunoglobulin gene expression and suppression of genes involved in cell proliferation. The proportion of many HLA-DR expressing T-cell populations were suppressed in all patients irrespective of clinical response, and the proportion of many IL21R+ T-cells were reduced exclusively in non-responders. Using only the baseline measurements we could not detect any biomarkers or prediction models that could predict response to MTX.
Conclusion: We conclude that a deep molecular and cellular phenotyping of peripheral blood cells in RA patients treated with methotrexate can reveal previously not recognized differences between responders and non-responders during 3 months of treatment with MTX. This may contribute to the understanding of MTX mode of action and explain non-responsiveness to MTX therapy.
Keywords: flow cytometry; gene expression; methotrexate; plasma proteins; rheumatoid anhritis; transcriptomics; treatment response.
Copyright © 2023 Brynedal, Yoosuf, Ulfarsdottir, Ziemek, Maciejewski, Folkersen, Westerlind, Müller, Sahlström, Jelinsky, Hensvold, Padyukov, Pomiano, Catrina, Klareskog and Berg.
Conflict of interest statement
SJ, MMa, and DZ were employed by Pfizer. LF was employed by Novo Nordisk A/S during data generation for this study and currently is employed by Nucleus Genomics. The remaining authors declare that the research was conducted in the absence of any commercial or financial relationships that could be construed as a potential conflict of interest.
Figures

Similar articles
-
Identification of gene expression biomarkers to predict clinical response to methotrexate in patients with rheumatoid arthritis.Clin Rheumatol. 2024 Jan;43(1):511-519. doi: 10.1007/s10067-023-06814-2. Epub 2023 Nov 17. Clin Rheumatol. 2024. PMID: 37978145 Free PMC article.
-
CD39 positive regulatory T cell frequency as a biomarker of treatment response to methotrexate in rheumatoid arthritis.Int J Rheum Dis. 2018 Aug;21(8):1548-1556. doi: 10.1111/1756-185X.13333. Int J Rheum Dis. 2018. PMID: 30146748
-
Good response to methotrexate is associated with a decrease in the gene expression of ABCG2, a drug transporter, in patients with rheumatoid arthritis.Mod Rheumatol. 2021 Nov;31(6):1079-1086. doi: 10.1080/14397595.2021.1879429. Epub 2021 Feb 9. Mod Rheumatol. 2021. PMID: 33492182
-
Tofacitinib for Treating Rheumatoid Arthritis After the Failure of Disease-Modifying Anti-rheumatic Drugs: An Evidence Review Group Perspective of a NICE Single Technology Appraisal.Pharmacoeconomics. 2018 Sep;36(9):1063-1072. doi: 10.1007/s40273-018-0639-0. Pharmacoeconomics. 2018. PMID: 29546668 Review.
-
Pharmacomicrobiology of Methotrexate in Rheumatoid Arthritis: Gut Microbiome as Predictor of Therapeutic Response.Front Immunol. 2021 Dec 16;12:789334. doi: 10.3389/fimmu.2021.789334. eCollection 2021. Front Immunol. 2021. PMID: 34975886 Free PMC article. Review.
Cited by
-
Differences in IDO1+ dendritic cells and soluble CTLA-4 are associated with differential clinical responses to methotrexate treatment in rheumatoid arthritis.Front Immunol. 2024 May 22;15:1352251. doi: 10.3389/fimmu.2024.1352251. eCollection 2024. Front Immunol. 2024. PMID: 38840915 Free PMC article.
-
Predicting treatment response to methotrexate: are we closer to solving the enigma?Rheumatology (Oxford). 2024 May 3;63(6):1479-1480. doi: 10.1093/rheumatology/kead622. Rheumatology (Oxford). 2024. PMID: 38019954 Free PMC article. No abstract available.
-
Peripheral blood cellular dynamics of rheumatoid arthritis treatment informs about efficacy of response to disease modifying drugs.Sci Rep. 2023 Jun 21;13(1):10058. doi: 10.1038/s41598-023-36999-0. Sci Rep. 2023. PMID: 37344505 Free PMC article.
-
Common genetic variants do not impact clinical prediction of methotrexate treatment outcomes in early rheumatoid arthritis.J Intern Med. 2025 Jun;297(6):693-701. doi: 10.1111/joim.20087. Epub 2025 Apr 6. J Intern Med. 2025. PMID: 40190030 Free PMC article.
-
CXCL9 and its Receptor CXCR3, an Important Link Between Inflammation and Cardiovascular Risks in RA Patients.Inflammation. 2023 Dec;46(6):2374-2385. doi: 10.1007/s10753-023-01884-5. Epub 2023 Aug 5. Inflammation. 2023. PMID: 37542661
References
-
- van Riel PL. The development of the disease activity score (DAS) and the disease activity score using 28 joint counts (DAS28). Clin Exp Rheumatol. (2014) 32:S65–74. - PubMed
LinkOut - more resources
Full Text Sources
Research Materials