Host-specific differences in top-expanded TCR clonotypes correlate with divergent outcomes of anti-PD-L1 treatment in responders versus non-responders
- PMID: 37051229
- PMCID: PMC10084475
- DOI: 10.3389/fimmu.2023.1100520
Host-specific differences in top-expanded TCR clonotypes correlate with divergent outcomes of anti-PD-L1 treatment in responders versus non-responders
Abstract
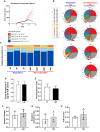
Immune checkpoint inhibitors (ICIs) have revolutionized cancer treatment; however, the responses to ICI treatment are highly variable in different individuals and the underlying mechanisms remain poorly understood. Here, we employed a mouse squamous cell carcinoma (SCC) model where tumor-bearing recipients diverged into responders (R) versus non-responders (NR) upon anti-PD-L1 treatment. We performed in-depth TCRβ sequencing with immunoSEQ platform to delineate the differences in CD8 tumor-infiltrating lymphocytes (TILs). We found that R and NR CD8 TILs both exhibited evidence of clonal expansion, suggesting activation regardless of response status. We detected no differences in clonal expansion or clonal diversity indexes between R vs. NR. However, the top expanded (>1%) TCRβ clonotypes appeared to be mutually exclusive between R and NR CD8 TILs, showing a preferential expansion of distinct TCRβ clonotypes in response to the same SCC tumor in R vs. NR. Notably, the mutual exclusivity of TCR clonotypes in R vs. NR was only observed when top TCRβ clonotypes were counted, because such top-expanded clonotypes are present in the opposite outcome group at a much lower frequency. Many TCRβ sequences were detected in only one recipient at a high frequency, implicating highly individualized anti-tumor immune responses. We conclude that differences in the clonal frequency of top TCR clonotypes between R and NR CD8 TILs may be one of the factors underlying differential anti-PD-L1 responses. This notion may offer a novel explanation for variable ICI responses in different individuals, which may substantially impact the development of new strategies for personalized cancer immunotherapy.
Keywords: T cell receptor sequencing; TCR repertoire; head and neck squamous cell carcinoma (HNSCC); immune checkpoint inhibitor (ICI); individualized anti-tumor immune responses.
Copyright © 2023 John, Chen, Woolaver, Ge, Vashisht, Huang, Chen and Wang.
Conflict of interest statement
The authors declare that the research was conducted in the absence of any commercial or financial relationships that could be construed as a potential conflict of interest.
Figures


Similar articles
-
Divergent outcomes of anti-PD-L1 treatment coupled with host-intrinsic differences in TCR repertoire and distinct T cell activation states in responding versus non-responding tumors.Front Immunol. 2022 Oct 18;13:992630. doi: 10.3389/fimmu.2022.992630. eCollection 2022. Front Immunol. 2022. PMID: 36330507 Free PMC article.
-
Differences in TCR repertoire and T cell activation underlie the divergent outcomes of antitumor immune responses in tumor-eradicating versus tumor-progressing hosts.J Immunother Cancer. 2021 Jan;9(1):e001615. doi: 10.1136/jitc-2020-001615. J Immunother Cancer. 2021. PMID: 33414263 Free PMC article.
-
Cetuximab Responses in Patients with HNSCC Correlate to Clonal Expansion Feature of Peripheral and Tumor-Infiltrating T Cells with Top T-Cell Receptor Clonotypes.Clin Cancer Res. 2023 Feb 1;29(3):647-658. doi: 10.1158/1078-0432.CCR-22-2355. Clin Cancer Res. 2023. PMID: 36315045 Free PMC article.
-
PD-L1 Checkpoint Inhibition Narrows the Antigen-Specific T Cell Receptor Repertoire in Chronic Lymphocytic Choriomeningitis Virus Infection.J Virol. 2020 Aug 31;94(18):e00795-20. doi: 10.1128/JVI.00795-20. Print 2020 Aug 31. J Virol. 2020. PMID: 32641478 Free PMC article.
-
Why responses to immune checkpoint inhibitors are heterogeneous in head and neck cancers: Contributions from tumor-intrinsic and host-intrinsic factors.Front Oncol. 2022 Oct 18;12:995434. doi: 10.3389/fonc.2022.995434. eCollection 2022. Front Oncol. 2022. PMID: 36330485 Free PMC article. Review.
Cited by
-
Persistence and enrichment of dominant T cell clonotypes in expanded tumor-infiltrating lymphocytes of breast cancer.Br J Cancer. 2024 Jul;131(1):196-204. doi: 10.1038/s41416-024-02707-6. Epub 2024 May 15. Br J Cancer. 2024. PMID: 38750113 Free PMC article.
References
Publication types
MeSH terms
Substances
Grants and funding
LinkOut - more resources
Full Text Sources
Molecular Biology Databases
Research Materials

