. 2023 Mar 27:11:1126507.
doi: 10.3389/fcell.2023.1126507. eCollection 2023.

Cell-specific occupancy dynamics between the pioneer-like factor Opa/ZIC and Ocelliless/OTX regulate early head development in embryos

Affiliations

Cell-specific occupancy dynamics between the pioneer-like factor Opa/ZIC and Ocelliless/OTX regulate early head development in embryos

Kelli D Fenelon et al. Front Cell Dev Biol. .

Abstract

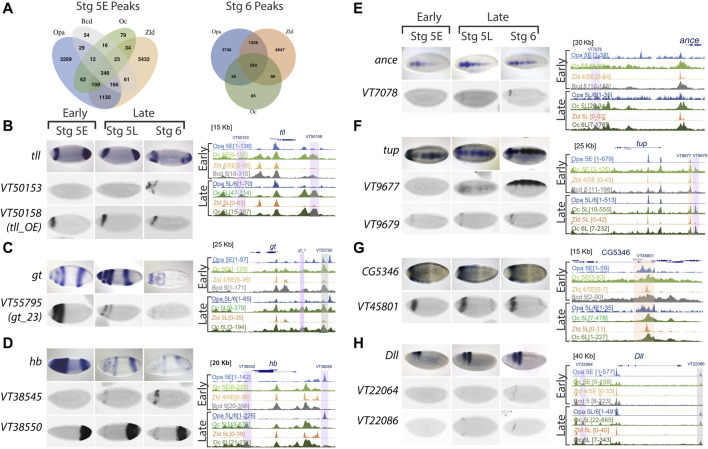
During development, embryonic patterning systems direct a set of initially uncommitted pluripotent cells to differentiate into a variety of cell types and tissues. A core network of transcription factors, such as Zelda/POU5F1, Odd-paired (Opa)/ZIC3 and Ocelliless (Oc)/OTX2, are conserved across animals. While Opa is essential for a second wave of zygotic activation after Zelda, it is unclear whether Opa drives head cell specification, in the Drosophila embryo. Our hypothesis is that Opa and Oc are interacting with distinct cis-regulatory regions for shaping cell fates in the embryonic head. Super-resolution microscopy and meta-analysis of single-cell RNAseq datasets show that opa's and oc's overlapping expression domains are dynamic in the head region, with both factors being simultaneously transcribed at the blastula stage. Additionally, analysis of single-embryo RNAseq data reveals a subgroup of Opa-bound genes to be Opa-independent in the cellularized embryo. Interrogation of these genes against Oc ChIPseq combined with in situ data, suggests that Opa is competing with Oc for the regulation of a subgroup of genes later in gastrulation. Specifically, we find that Oc binds to late, head-specific enhancers independently and activates them in a head-specific wave of zygotic transcription, suggesting distinct roles for Oc in the blastula and gastrula stages.

Keywords: Drosophila embryo; Oc/OTX; Opa/ZIC; embryonic head development; epigenetics.


Conflict of interest statement

The authors declare that the research was conducted in the absence of any commercial or financial relationships that could be construed as a potential conflict of interest.

Figures

FIGURE 1
FIGURE 1
opa and oc dynamic overlap within the developing embryo. (A) At nc14B, a clear overlap between oc and opa domains can be observed (above) as is visualized graphically by batch plotting of AP FISH image fluorescence intensity below (n = 4,3). (B) By initiation of gastrulation, oc and opa expression domains become nearly distinct, as verified by batch plotting of AP FISH image fluorescence intensity (n = 7,7). (C) Venn diagrams representing ChIP peaks for Opa (green) and Oc (red) at early and late stages. (p <.0001, χ2) (D–E) Consensus binding data from JASPAR show that the Drosophila (Dmel) Opa (D), and Oc (E) consensus binding sites are conserved in Human (Hsap). (F–G) Homer de novo motifs for Opa (F) and Oc (G) for early and late stages.
FIGURE 2
FIGURE 2
Enrichment of Opa and Oc de novo motifs in subsets of peaks that correspond to Opa-only, Oc-only, or Opa/Oc-bound regions identified by ChIPseq (A,D) and (G) Stage 5E HOMER de novo motif analyses for Oc-only (no Opa) (A), Opa-only (no Oc) (D), and Opa and Oc-only (G) peaks. (B,E) and (H) Stage 6 HOMER de novo motif analyses for Oc-only (no Opa) (B), Opa-only (no Oc) (E), Opa- and Oc-only (H) peaks. (C,F) and (I) Enrichment plots of Stage 6 Oc-only (C), Opa-only (F), and Oc-Opa overlapping peak (I) motifs at Oc (red) or Opa- and Oc-only (green) (Distance in bp).
FIGURE 3
FIGURE 3
Opa/Oc subcellular protein and transcriptional dynamics. (A) Super resolution microscopy reveals simultaneous transcription of opa (green arrow region) and oc (bounded by orange dotted line) within individual nuclei (grey dotted lines) in the opa/oc overlap region. (B) Nuclei counts of opa/oc overlap region width by stage from the onset of opa expression to St6. The overlapping region is significantly lower at St6 than any of the cellularization stages (p <.05 compared to all other individual stages) (nc14b: n = 8, nc14C: n = 7, nc14D: n = 3, St6: n = 8). (C) Neural network age prediction plot of oc and opa expression from publicly available scRNAseq datasets (Karaiskos et al., 2017; Calderon et al., 2022). X-axis values are neural network age prediction pseudotimes between stage 4 and 12 (D, E) Stage 5E (D) and Stage 6 (E) Opa, Zld and Oc ChIPseq peak correlation by promoter or distal enhancer subclusters, as indicated in the key. (D′, E′) Stage 5E (D′) and Stage 6 (E′) H3K4me3, H3K4me1 and H3K27ac at nc14a and at nc14C signal intensities centered at different ChIP-seq regions (promoters or distal enhancers). For the two different timepoints nc14A and nc14C, different Zld and Oc ChIP data were used, as indicated in methods.
FIGURE 4
FIGURE 4
Oc ChIPseq data demonstrates binding in both AP and DV axis, including some stage 5 enhancers, as well as other later acting enhancers. (A) Venn diagrams of Opa, Oc, Bcd, and Zld peaks at distal enhancers at stages 5E and 6. (B–H) ChIPseq data and enhancer expression patterns for important developmental factors. ChIPseq datasets: Opa at stage 5 early (light blue), Oc at stage 5 early (light green), Zld at stage 4/5 early (light orange), Bcd at stage 5 (grey), Opa at stage 5 late/stage 6 (dark blue), Oc at stage 5 late (olive green), Zld at stage 5 late (dark orange), and Oc at stage 6 late (dark green) from previous studies were aligned using UCSC genome browser. Numbers in square brackets indicate maximal peak heights and colored highlights marking the peaks indicate enhancers of interest with different occupancy in our study. The grey highlights mark Oc/Opa binding, light purple indicates Opa or Oc individually bound regions, and orange highlights mark Zld-bound enhancers. For each panel (B–H), endogenous expression patterns for (B) tailless (tll), (C) giant (gt), (D) hunchback (hb), (E) angiotensin converting enzyme (ance), (F) tailup (tup), (G) CG5346, and (H) distal-less (Dll) are extracted from publicly available Fruitfly database, and expression patterns of highlighted enhancers (Vienna tile ID in blue above).
FIGURE 5
FIGURE 5
Oc and Opa play diverse roles in embryonic head development. (A) and (B) oc depletion by shRNAi results in an failure of late second hb band to resolve from broad early expression when Oc ChIPseq shows Oc occupancy, complimenting the V38545 enhancer expression pattern shown in Figure 4D. (wt: Early: n = 4, Late: n = 3 |oc-RNAi: Early: n = 5, Late: n = 3) (C) and (D) Model illustration: Overlapping opa and oc expression generates a progenitor pool during cellularization (C, Left) which eventually begets the brain (C). At the genome level, early transcription factors bind promoters and enhancers to switch on genes, fascilitated by the pioneer factor activity of TFs like Opa and Bcd (D, Left). Later during embryonic development, pioneer factor activity is no longer required and independent roles for Oc and downstream TFs drive brain development (D, right). (C,D) partially created with BioRender.com).

Similar articles

Cited by

References

    1. Acampora D., Di Giovannantonio L. G., Di Salvio M., Mancuso P., Simeone A. (2009). Selective inactivation of Otx2 mRNA isoforms reveals isoform-specific requirement for visceral endoderm anteriorization and head morphogenesis and highlights cell diversity in the visceral endoderm. Mech. Dev. 126, 882–897. 10.1016/j.mod.2009.07.003 - DOI - PubMed
    1. Acampora D., Gulisano M., Simeone A. (2000). Genetic and molecular roles of Otx homeodomain proteins in head development. Gene 246, 23–35. 10.1016/s0378-1119(00)00070-6 - DOI - PubMed
    1. Asp M., Bergenstråhle J., Lundeberg J. (2020). Spatially resolved transcriptomes—next generation tools for tissue exploration. BioEssays 42, 19002211–e1900316. 10.1002/bies.201900221 - DOI - PubMed
    1. Berg S., Kutra D., Kroeger T., Straehle C. N., Kausler B. X., Haubold C., et al. (2019). Ilastik: Interactive machine learning for (bio) image analysis. Nat. Methods 16, 1226–1232. 10.1038/s41592-019-0582-9 - DOI - PubMed
    1. Bridi J. C., Ludlow Z. N., Hirth F. (2019). Lineage-specific determination of ring neuron circuitry in the central complex of Drosophila. Biol. open 8, 1. 10.1242/bio.045062 - DOI - PMC - PubMed

LinkOut - more resources