. 2023 Aug;33(8):965-973.
doi: 10.1089/thy.2022.0687. Epub 2023 May 15.

The RCAN1.4 Metastasis Suppressor Is Hypermethylated at Intron 1 in Thyroid Cancer

Affiliations

The RCAN1.4 Metastasis Suppressor Is Hypermethylated at Intron 1 in Thyroid Cancer

Tilak Khanal et al. Thyroid. 2023 Aug.

Abstract

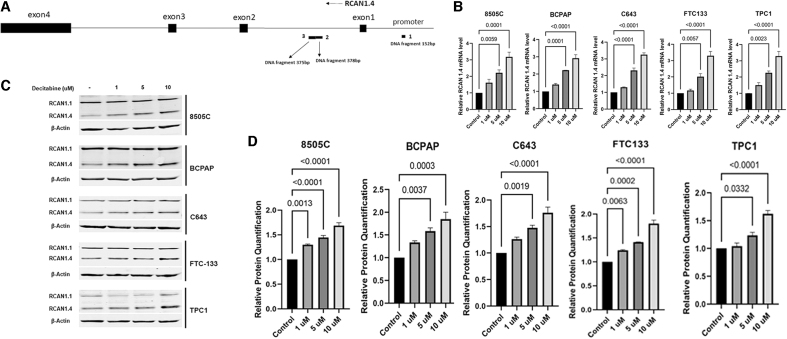
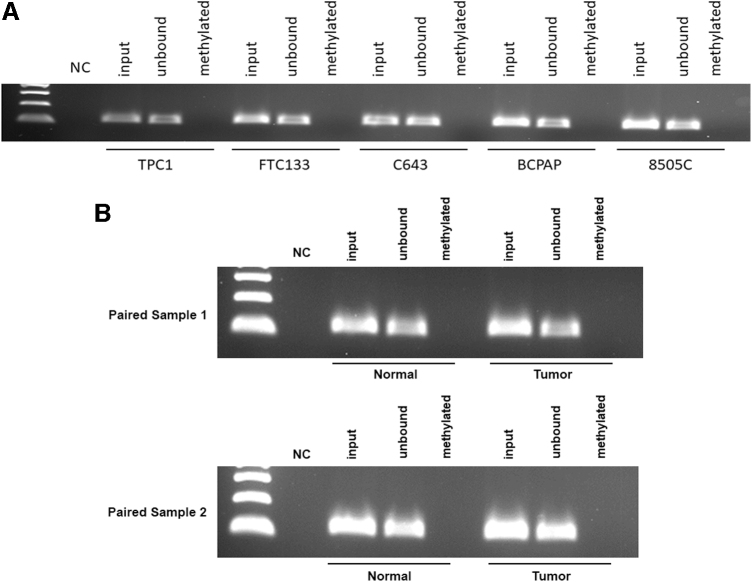
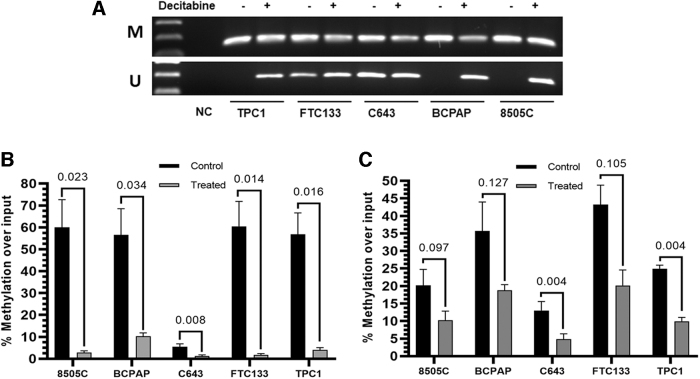
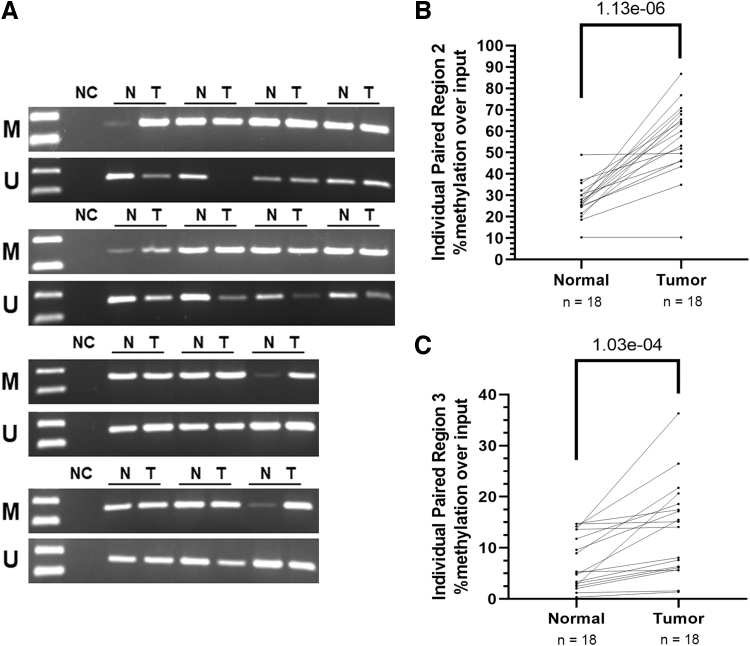
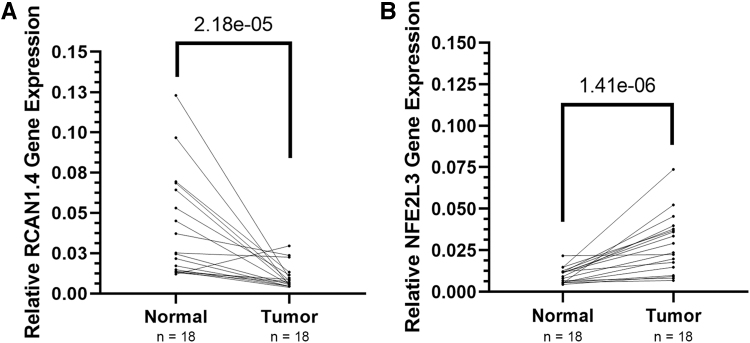
Background: Regulator of calcineurin 1.4 (RCAN1.4) is a functionally downregulated metastasis progression suppressor (MPS) in thyroid cancer; however, the mechanisms for RCAN1.4 loss in thyroid cancer have not yet been reported. The RCAN1.4 promoter and gene contain several cytosine-guanine (CG)-rich regions, some of which are reported to be hypermethylated in nonthyroid tissues. We, therefore, hypothesized that RCAN1.4 downregulation in thyroid cancer was in part due to hypermethylation. Methods: Studies were performed in 5 thyroid cancer cell lines (TPC1, FTC133, BCPAP, C643, and 8505C) with different genetic drivers, and in 18 paired normal and thyroid cancer human thyroid cancer tissues. Basal RCAN1.4 messenger RNA (mRNA) and protein levels were assessed in all of the cell lines. Cell lines with lowest RCAN1.4 expression levels were treated with the DNA methyl transferase inhibitor, decitabine. Normal/tumor tissue pairs were analyzed for methylation of three CG-rich regions both by capture of methylated DNA by MBD2 protein and by methylation-specific polymerase chain reaction (MSPCR). Results: In all assessed cell lines, RCAN1.4 mRNA and protein levels increased after decitabine treatment. In silico analysis of the RCAN1.4 gene identified 3 CG-rich regions as possible methylation targets: 1 in the proximal promoter and 2 in intron 1. Hypermethylation of the intron 1 CG-rich regions was identified by both the capture method and MSPCR. In contrast, hypermethylation of the CG-rich region of the proximal promoter was not identified. Gene expression confirmed that hypermethylation in thyroid cancer samples in intron 1 of RCAN1.4 was associated with lower levels of RCAN1.4 mRNA. Finally, the cancer samples demonstrated increased NFE2L3 expression, a downstream marker of functional RCAN1.4 loss. Conclusions: The MPS gene, RCAN1.4, is downregulated in thyroid cancer cells and human thyroid cancer in part by hypermethylation of CG-rich regions in intron 1.

Keywords: NFE2L3; gene regulation; metastatic dormancy.


Conflict of interest statement

The authors all declare that there are no conflicts of interest.

Figures

FIG. 1.
FIG. 1.
Decitabine increases protein and mRNA levels. (A) Diagram of RCAN1.4 showing the three CG-rich regions in the promoter and intron 1 with the sizes of the DNA fragments. (B) Cells were treated with increasing doses of decitabine (0, 1, 5, and 10 μM) for 48 hours, mRNA levels were measured; RCAN1.4 levels increased after treatment with 5 or 10 μM decitabine. (C, D) Cells were treated with increasing doses of decitabine (0, 1, 5, and 10 μM) for 72 hours. RCAN1.4 protein levels increased in all cell lines with 5 or 10 μM dosing. β-actin was used as loading control, n = 3 for all experiments. Statistical comparisons were performed using one-way ANOVA; p < 0.05 is significant. ANOVA, analysis of variance; mRNA, messenger RNA; RCAN1.4, regulator of calcineurin 1.4.
FIG. 2.
FIG. 2.
(A) Promoter region shows no hypermethylation in all five cell lines. (A) DNA was isolated from five cell lines and quantitative capture of methylated DNA by MBD2 protein bead precipitation and PCR was performed, n = 3. (B) DNA from 18 paired normal and tumor thyroid samples were analyzed by quantitative capture of methylated DNA by MBD2 protein bead precipitation. Two samples shown in Figure 2, all samples are shown in Supplementary Figure S1. NC, negative control; PCR, polymerase chain reaction.
FIG. 3.
FIG. 3.
- Decitabine decreases RCAN1.4 intron 1 methylation in thyroid cancer cell lines (A) Cells were treated with decitabine (10 μM) for 72 hours and DNA isolated. Qualitative methylation-specific PCR for both regions of intron 1 was performed and demonstrated relatively less methylation after decitabine treatment for most samples. (B, C) Quantitative capture of methylated DNA by MBD2 protein bead precipitation and PCR was performed for region 2 (B) and region 3 (C). Significant reductions of methylation were identified for region 2 in all cell lines and in 2 of 5 cell lines for region 3 (n = 3). Student t-tests were used to compare results in (B, C), p < 0.05 is considered significant. M, methylated; U, unmethylated.
FIG. 4.
FIG. 4.
RCAN1.4 intron 1 is hypermethylated in tumor PTC vs. paired normal tissue samples. Paired thyroid cancer normal and tumor samples were analyzed for RCAN1.4 methylation of intron 1. (A) Qualitative methylation-specific PCR was performed to assess methylation of intron 1 (both regions) in 14 PTC normal and tumor paired samples with adequate DNA with results suggesting relatively higher methylated: unmethylated DNA in tumor samples. (B) Quantitative capture of methylated DNA by MBD2 at RCAN1.4 intron 1 for all 18 pairs confirmed higher levels of methylation in both regions 2 and 3 in thyroid cancer samples. Paired Student t-test was used for statistical analysis; p < 0.05 is significant. N, normal; PTC, papillary thyroid cancer; T, tumor.
FIG. 5.
FIG. 5.
RCAN1.4 gene expression is downregulated while NFE2L3 gene expression is upregulated in PTC tissues. RCAN1.4 and NFE2L3 gene expression levels in 18 paired papillary thyroid cancer normal and tumor samples were assessed by qRT-PCR. (A) Reduced levels of RCAN1.4 mRNA were found in 16 of 18 samples (p = 2.18e-05). (B) Increased levels of NFE2L3 were identified in 17 of 18 samples (p = 1.41e-06). Graphs represent relative gene expression compared with normal tumor samples, with each normal sample paired with the corresponding tumor sample. Data were log2 transformed and analyses were performed using paired Student t-tests; p < 0.05 is significant. qRT-PCR, quantitative real-time PCR.

Similar articles

Cited by

References

    1. Surveillance, Epidemiology, and End Results Program (SEER). SEER Cancer Stat Facts: Thyroid Cancer. Bethesda, MD; 2022. Available from: https://seer.cancer.gov/statfacts/html/thyro.html [Last accessed: December 1, 2022].
    1. American Cancer Society (ACS). Thyroid Cancer Survival Rates, by Type and Stage. 2022. Available from: https://www.cancer.org/cancer/thyroid-cancer/detection-diagnosis-staging... [Last accessed: December 1, 2022].
    1. Pereira M, Williams VL, Johnson JH, et al. . Thyroid Cancer Incidence Trends in the United States: Association with Changes in Professional Guideline Recommendations. Thyroid 2020;30(8):9., doi:10.1089/thy.2019.0415 - DOI - PubMed
    1. Rajan N, Khanal T, Ringel MD. Progression and dormancy in metastatic thyroid cancer: Concepts and clinical implications. Endocrine 2020;70(1):12; doi: 10.1007/s12020-020-02453-8 - DOI - PMC - PubMed
    1. Robenshtok E, Neeman B, Reches L, et al. . Adverse histological features of differentiated thyroid cancer are commonly found in autopsy studies: Implications for treatment guidelines. Thyroid 2022;32(1):37–45; doi: 10.1089/thy.2021.0268 - DOI - PubMed

Publication types

MeSH terms

LinkOut - more resources