. 2023 Nov;56(11):e13480.
doi: 10.1111/cpr.13480. Epub 2023 Apr 13.

Derivation of new pluripotent stem cells from human extended pluripotent stem cells with formative features and trophectoderm potential

Affiliations

Derivation of new pluripotent stem cells from human extended pluripotent stem cells with formative features and trophectoderm potential

Pinmou Zhu et al. Cell Prolif. 2023 Nov.

Abstract

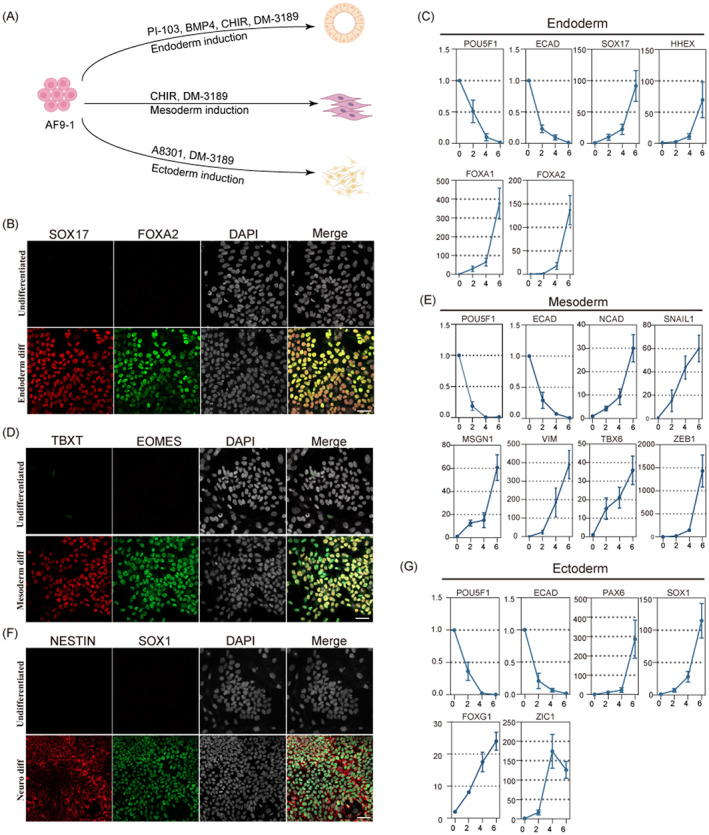
Previous studies have demonstrated the existence of intermediate stem cells, which have been successfully obtained from human naive pluripotent stem cells (PSCs) and peri-implantation embryos. However, it is not known whether human extended pluripotent stem cells (hEPSCs) can be directly induced into intermediate stem cells. Moreover, the ability of extra-embryonic lineage differentiation in intermediate stem cells has not been verified. In this issue, we transformed hEPSCs into a kind of novel intermediate pluripotent stem cell resembling embryonic days 8-9 (E8-E9) epiblasts and proved its feature of formative epiblasts. We engineered hEPSCs from primed hPSCs under N2B27-LCDM (N2B27 plus Lif, CHIR, DiH and MiH) conditions. Then, we added Activin A, FGF and XAV939 to modulate signalling pathways related to early humans' embryogenesis. We performed RNA-seq and CUT&Tag analysis to compare with AF9-hPSCs from different pluripotency stages of hPSCs. Trophectoderm (TE), primordial germ cells-like cells (PGCLC) and endoderm, mesoderm, and neural ectoderm induction were conducted by specific small molecules and proteins. AF9-hPSCs transcription resembled that of E8-E9 peri-implantation epiblasts. Signalling pathway responsiveness and histone methylation further revealed their formative pluripotency. Additionally, AF9-hPSCs responded directly to primordial germ cells (PGCs) specification and three germ layer differentiation signals in vitro. Moreover, AF9-hPSCs could differentiate into the TE lineage. Therefore, AF9-hPSCs represented an E8-E9 formative pluripotency state between naïve and primed pluripotency, opening new avenues for studying human pluripotency development during embryogenesis.


Conflict of interest statement

The authors declare that the research was conducted in the absence of any commercial or financial relationships that could be construed as a potential conflict of interest.

Figures

FIGURE 1
FIGURE 1
In vitro deriving for intermediate pluripotent stem cells from human EPSCs. (A) A schematic diagram showing AF9‐hPSCs generation from primed human PSCs. (B) Representative bright‐field images showing typical colony morphology of primed hPSCs, hEPSCs and formative AF9‐hPSCs. Scale bars indicate 100 μm. (C) Representative IF images showing that hEPSC‐1 expressed core pluripotency markers (OCT4, SOX2 and NANOG). Scale bars indicate 50 μm. (D) Representative IF images showing that AF9‐1 expressed core pluripotency markers (OCT4, SOX2 and NANOG). Scale bars indicate 50 μm. (E) Representative IF images showing the formative‐specific gene LEFTY1 was expressed in formative AF9‐1 PSCs but not expressed in primed DYR0 iPSCs and hEPSC‐1. Scale bars indicate 50 μm. (F) Heatmap clustering of differentially expressed genes in primed hPSCs (DYR0 iPSC and H1 ESC), hEPSCs (hEPSC‐1 and hEPSC‐2) and AF9‐hPSCs (AF9‐1 and AF9‐2). (G) GO analysis of 2387 specifically expressed genes of AF9‐hPSCs in (E). ESC, embryonic stem cells; EPSCs, extended pluripotent stem cells; GO, gene ontology; hEPSC‐1, human extended pluripotent stem cells‐1; IF, immunofluorescence.
FIGURE 2
FIGURE 2
AF9‐hPSCs harbour intermediate pluripotency features. (A) A PCA plot of RNA‐seq data from in vitro (4i hESCs, H9 naïve and primed ESCs, hXPSCs, hFSCs and AF9‐hPSCs) and in vitro (human E6, E8, E10, E12 and E14 epiblast) samples from Xiang et al (2021). (B) Matrix antigen plot showing mean Fragments per Kilobase Million (FPKM) value against fold change per gene in AF9‐1 versus hEPSC‐1. Gene symbols are shown for selected formative (red), EPS (blue) and pluripotency (green) genes. (C) Kyoto encyclopedia of genes and genomes pathway analysis in AF9‐hPSCs compared to hEPSCs. (D) GSEA pathway analysis in AF9‐hPSCs compared to hEPSCs based on the WikiPathways database. (E) Average H3K4me3 and H3K27me3 signalling in all RefSeq genes in AF9‐hPSCs (AF9‐1), hEPSCs (hEPSC‐1) and primed hPSCs (DYR0 iPSC), represented as normalized RPKM values. (F) RNA‐seq, H3K4me3 and H3K27me3 tracks of selected pluripotency and formative genes in DYR0 iPSC, hEPSC‐1 and AF9‐1. ESC, embryonic stem cells; EPSCs, extended pluripotent stem cells; GO, gene ontology; hEPSC‐1, human extended pluripotent stem cells‐1; IF, immunofluorescence.
FIGURE 3
FIGURE 3
AF9‐hPSCs respond productively to lineage induction cues in vitro. (A) A schematic diagram showing in vitro endoderm, mesoderm and ectoderm induction from AF9‐hPSCs. (B) SOX17 and FOXA2 immunostaining of AF9‐hPSCs after endoderm induction. Scale bar, 50 μm. (C) qRT‐PCR analysis of AF9‐hPSCs differentiated into endoderm for 6 days. Error bars represent SD from technical triplicates. (D) TBXT and EOMES immunostaining of AF9‐hPSCs after mesoderm induction. Scale bar, 50 μm. (E) qRT‐PCR analysis of AF9‐hPSCs differentiated into mesoderm for 6 days. Error bars represent SD from technical triplicates. (F) NESTIN and SOX1 immunostaining of AF9‐hPSCs after neural ectoderm induction. Scale bar, 50 μm. (G) qRT‐PCR analysis of AF9‐hPSCs differentiated into neural ectoderm for 6 days. Error bars represent SD from technical triplicates. qRT‐PCR, quantitative reverse transcription‐polymerase chain reaction.
FIGURE 4
FIGURE 4
AF9‐hPSCs exhibit PGC competence. (A) A scheme for the PGCLC induction from AF9‐hPSCs. (B) Typical examples for the bright‐field images and FACS analysis during PGCLC induction from day 2 to day 4. Scale bars, 100 μm. (C) Representative IF (SOX17, TFAP2C and BLIMP1) images of PGCLC induction from AF9‐hPSCs. Scale bars, 50 μm. (D) Gene expression dynamics during PGCLC induction from AF9‐hPSCs (mean ± SD; n = 3, biological replicates). (E) Heatmap of correlation coefficients of the gene‐expression profiles among the indicated cells. AF9‐1, AF9‐hPSCs induced by hEPSC‐1; AF9‐PGC d4, 4 days after PGCLC induction of AF9‐1; hiPSC, established by Sasaki et al.; PGCLC d4, d6, d8, 4, 6, 8 days PGCLC induction of hiPSCs by Sasaki et al. (F) PCA of the indicated cell types during PGCLC induction. The cells as annotated are plotted in two‐dimensional spaces defined by PC1 and 2. (G) Heatmap of the relative expression of selected genes associated with DYR0 iPSC, AF9‐1, AF9‐PGC d4, hiPSC, PGCLC d2, d4, d6 and d8. PGCLC, primordial germ‐cells like cells.
FIGURE 5
FIGURE 5
AF9‐hPSCs possess trophectoderm (TE) lineage potential. (A) Schematic of human trophoblast development. TE in pre‐implantation embryos differentiates into cytotrophoblasts (CT) during implantation. (B) A scheme for the trophoblast stem cell (TSC) induction from AF9‐hPSCs and representative bright‐field images showing typical colony morphology of extended pluripotent stem (EPS) cells derived TSCs and AF9‐hPSCs derived TSCs. Scale bar, 100 μm. (C) Representative images of EPS‐TSC and AF9‐TSC, detecting the expressing TE lineage‐specific markers (GATA3, TFAP2C and CK7). Scale bar, 50 μm. (D) Heatmap of correlation coefficients of the gene‐expression profiles among the indicated cells. Naïve, naïve PSCs; hEPSC‐1,‐2, hEPSC induced by DYR0 iPSC and H1 ESC, respectively; AF9‐1, ‐2, AF9‐hPSCs induced by hEPSC‐1 and hEPSC‐2, receptively; AF9‐1‐TSC, TSC induced by AF9‐1; hEPSC‐1‐TSC, TSC induced by hEPSC‐1; 7 w, 9 w and 11 w CT, TACSTD+ENPEP+SIGLEC6+ placental chorionic villi at 7, 9 and 11 gestational weeks reported by Io et al., respectively; CT30, placenta‐derived TS cells established by Okae et al. nCT, naive PSC‐derived TE differentiates into CTs reported by Io et al. Yolk sac samples reported by Cindrova‐Davies et al. (E) PCA of indicated cell types in (D). (F) Heatmap of the relative expression of selected genes associated with cell types in (D).

References

    1. Nichols J, Smith A. Naive and primed pluripotent states. Cell Stem Cell. 2009;4:487‐492. - PubMed
    1. Boroviak T, Loos R, Bertone P, Smith A, Nichols J. The ability of inner‐cell‐mass cells to self‐renew as embryonic stem cells is acquired following epiblast specification. Nat Cell Biol. 2014;16:513‐525. - PMC - PubMed
    1. Brons IGM, Smithers LE, Trotter MWB, et al. Derivation of pluripotent epiblast stem cells from mammalian embryos. Nature. 2007;448:191‐195. - PubMed
    1. Tesar PJ, Chenoweth JG, Brook FA, et al. New cell lines from mouse epiblast share defining features with human embryonic stem cells. Nature. 2007;448:196‐199. - PubMed
    1. Angeles ADL, Ferrari F, Xi R, et al. Hallmarks of pluripotency. Nature. 2015;525:469‐478. - PubMed