

Macroperiodic Oscillations: A Potential Novel Biomarker of Outcome in Neonatal Encephalopathy
- PMID: 37052470
- PMCID: PMC10567988
- DOI: 10.1097/WNP.0000000000001011
Macroperiodic Oscillations: A Potential Novel Biomarker of Outcome in Neonatal Encephalopathy
Abstract
Purpose: Neonatal encephalopathy (NE) is a common cause of neurodevelopmental morbidity. Tools to accurately predict outcomes after therapeutic hypothermia remain limited. We evaluated a novel EEG biomarker, macroperiodic oscillations (MOs), to predict neurodevelopmental outcomes.
Methods: We conducted a secondary analysis of a randomized controlled trial of neonates with moderate-to-severe NE who underwent standardized clinical examination, magnetic resonance (MR) scoring, video EEG, and neurodevelopmental assessment with Bayley III evaluation at 18 to 24 months. A non-NE cohort of neonates was also assessed for the presence of MOs. The relationship between clinical examination, MR score, MOs, and neurodevelopmental assessment was analyzed.
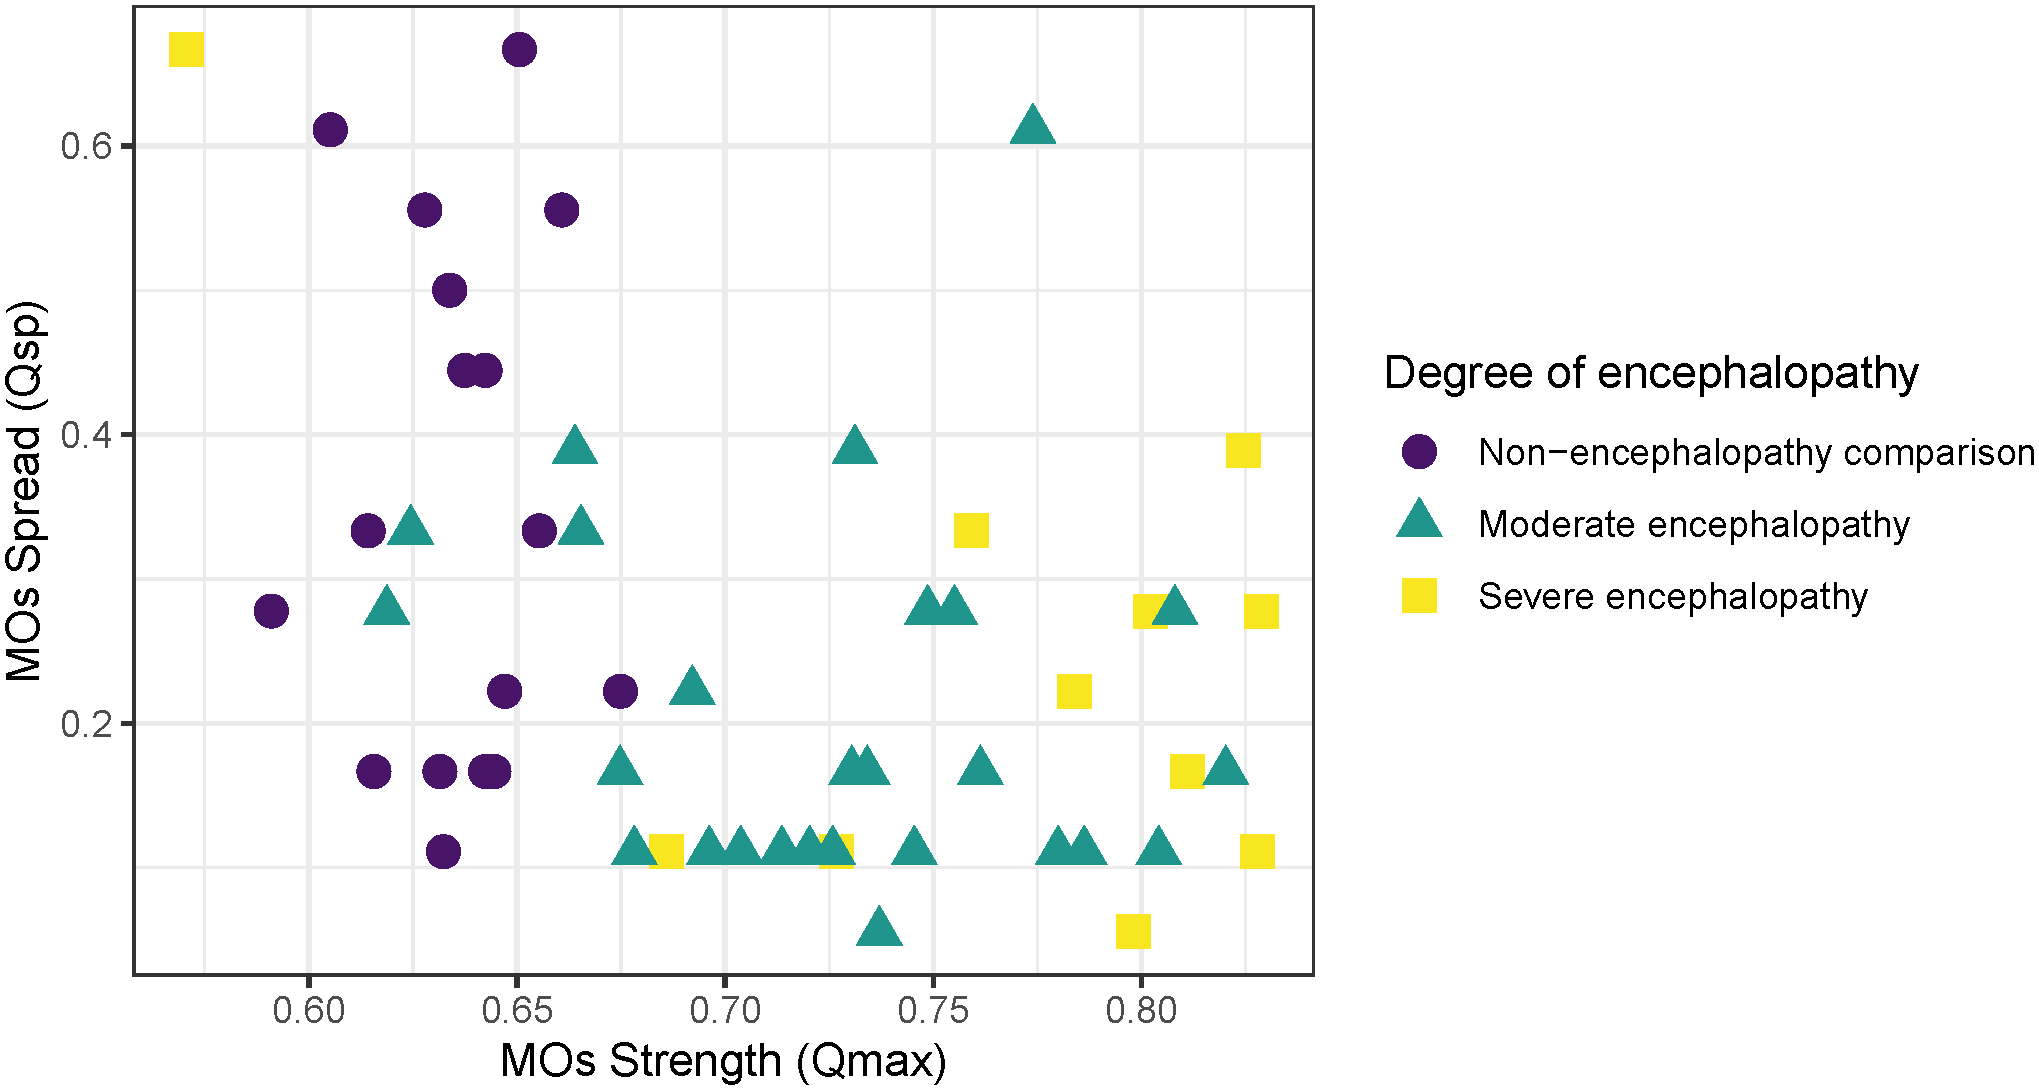
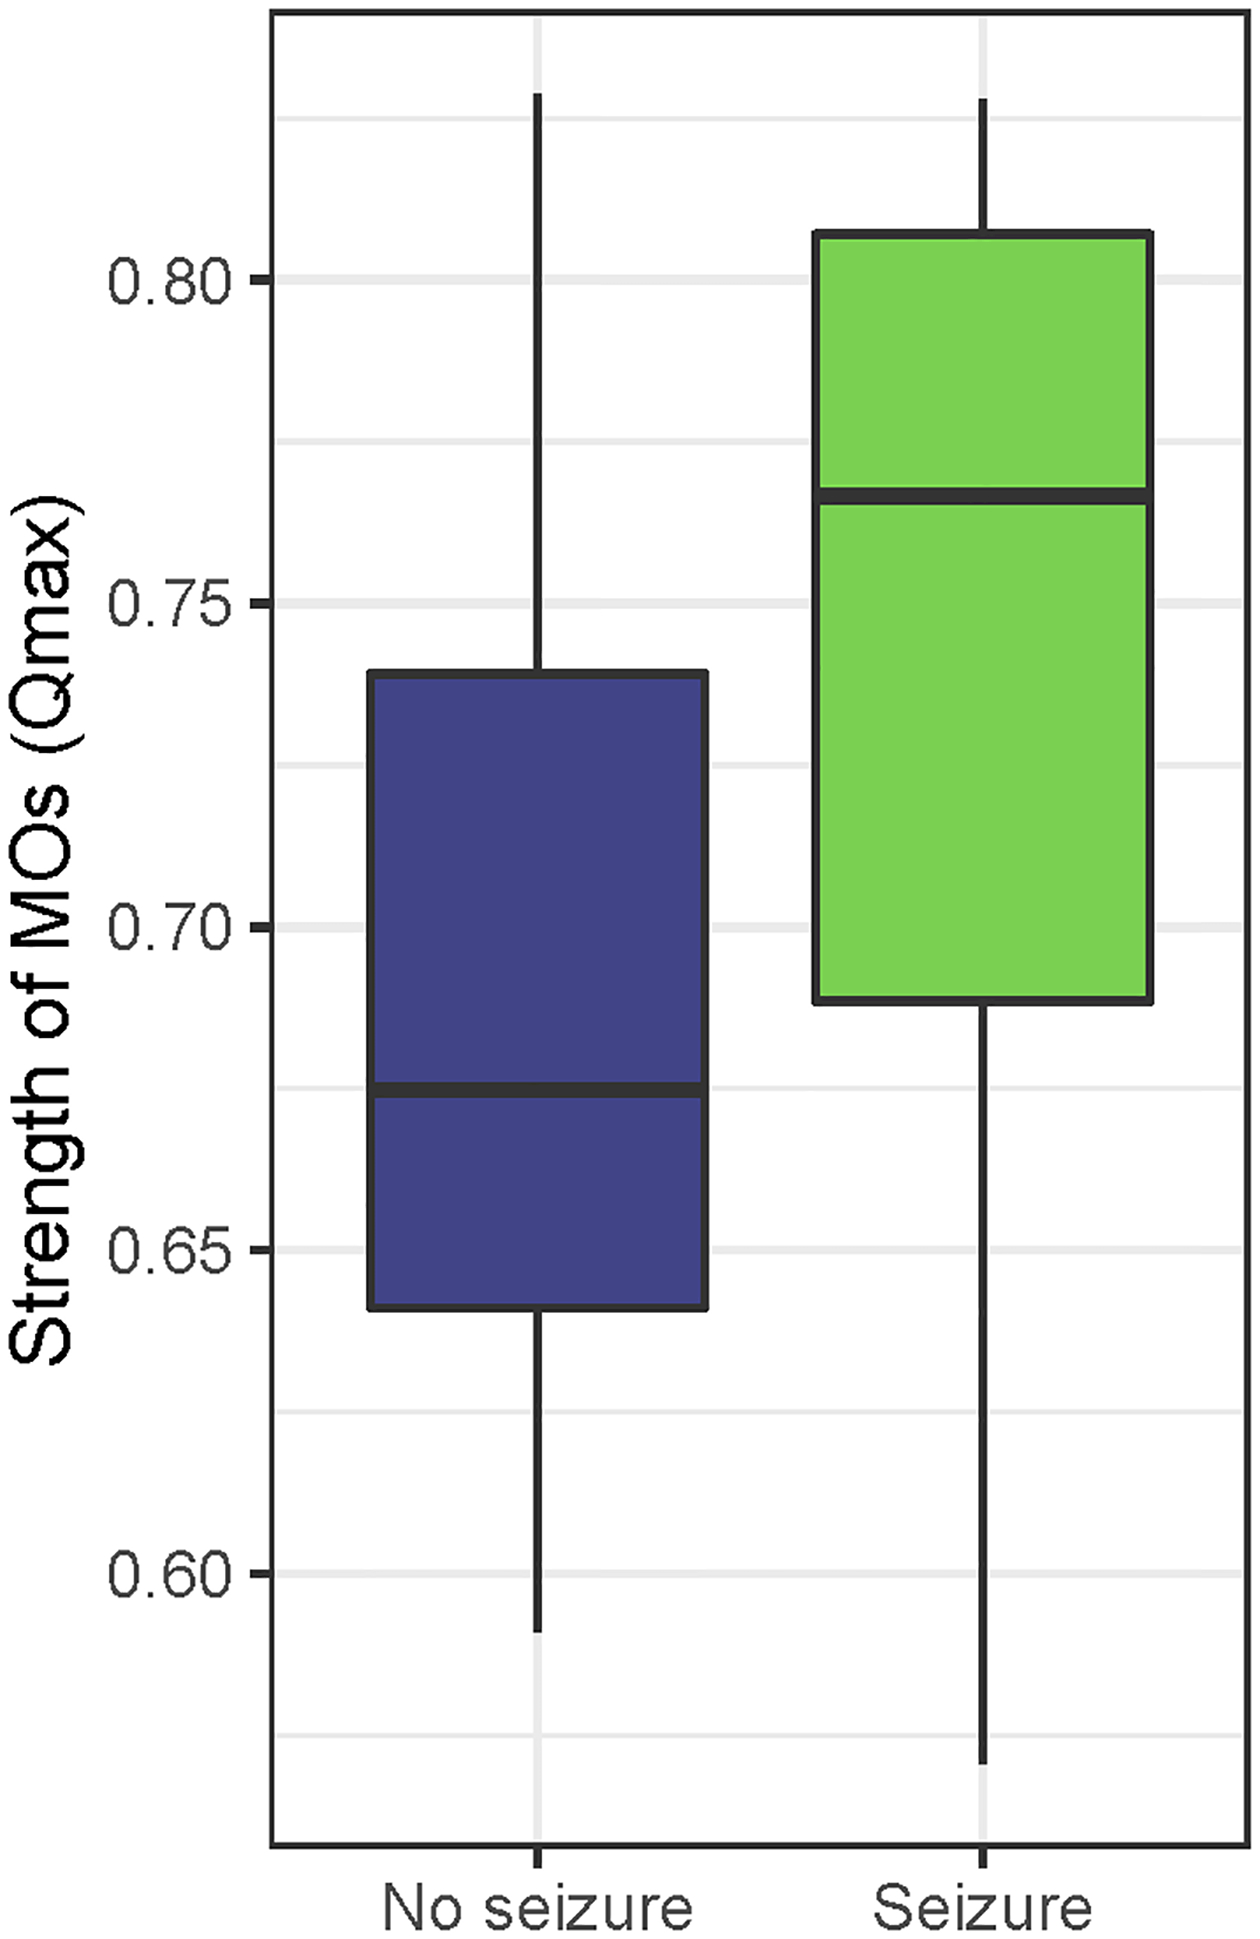
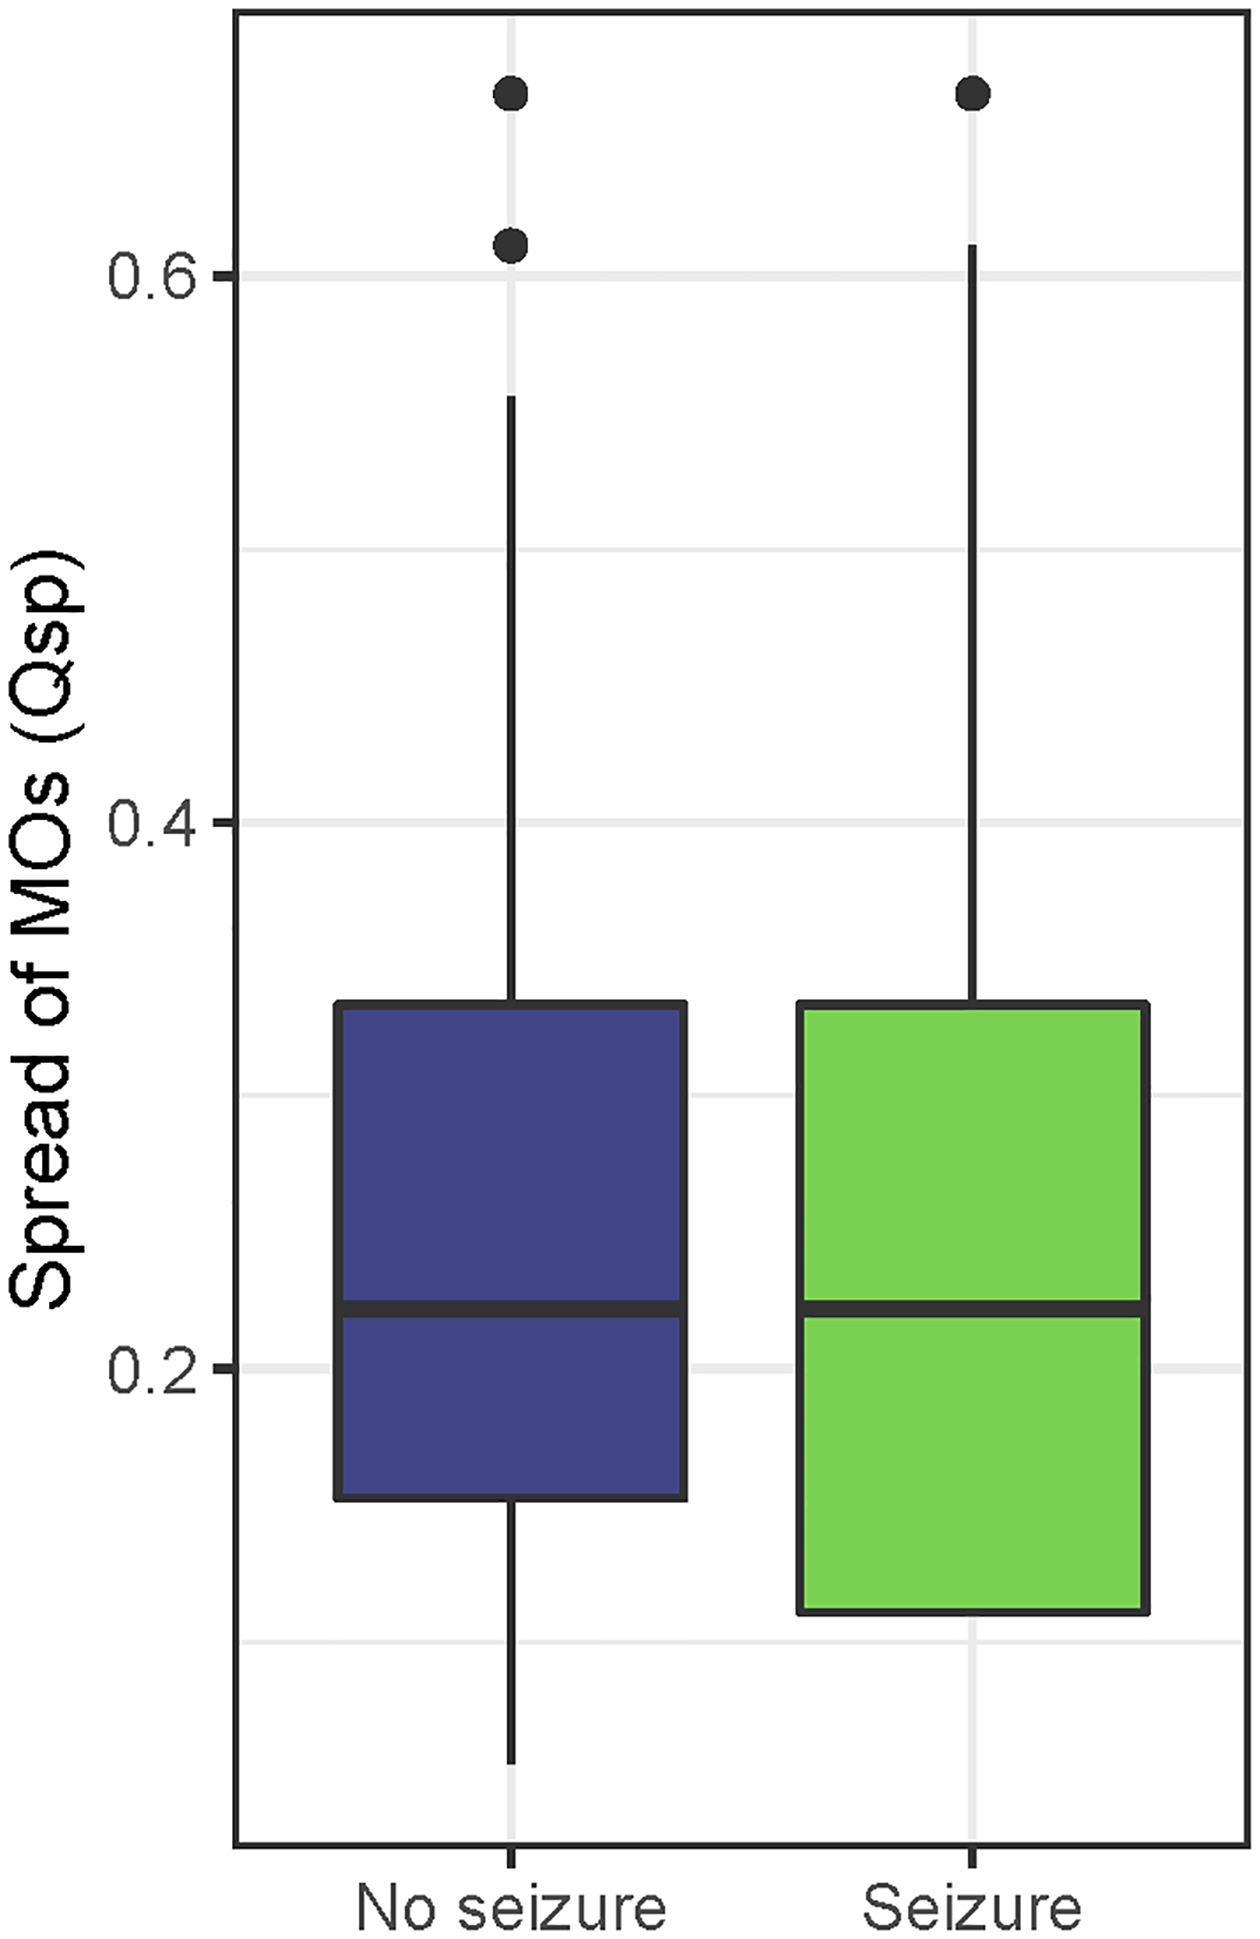
Results: The study included 37 neonates with 24 of whom survived and underwent neurodevelopmental assessment (70%). The strength of MOs correlated with severity of clinical encephalopathy. MO strength and spread significantly correlated with Bayley III cognitive percentile ( P = 0.017 and 0.046). MO strength outperformed MR score in predicting a combined adverse outcome of death or disability ( P = 0.019, sensitivity 100%, specificity 77% vs. P = 0.079, sensitivity 100%, specificity 59%).
Conclusions: MOs are an EEG-derived, quantitative biomarker of neurodevelopmental outcome that outperformed a comprehensive validated MRI injury score and a detailed systematic discharge examination in this small cohort. Future work is needed to validate MOs in a larger cohort and elucidate the underlying pathophysiology of MOs.
Copyright © 2023 by the American Clinical Neurophysiology Society.
Conflict of interest statement
This research was supported in part by the Thrasher Foundation (A. Mathur and J. M. Zempel), the Washington University Institute of Clinical and Translational Sciences (UL1TR002345—R. M. Guerriero and S. Ching), and NIH grant K23NS111086 (Z. A. Vesoulis). Funding agencies had no role in the design or analysis of this study. None of the authors have potential conflicts of interest to be disclosed.
Figures
References
-
- McIntyre S, Nelson KB, Mulkey SB, Lechpammer M, Molloy E, Badawi N. Neonatal encephalopathy: Focus on epidemiology and underexplored aspects of etiology. Semin Fetal Neonatal Med. 2021;26(4):101265. - PubMed
-
- Miller SP, Ramaswamy V, Michelson D, et al. Patterns of brain injury in term neonatal encephalopathy. J Pediatr. 2005;146(4):453–460. - PubMed
-
- Rutherford MA, Pennock JM, Counsell SJ, et al. Abnormal Magnetic Resonance Signal in the Internal Capsule Predicts Poor Neurodevelopmental Outcome in Infants With Hypoxic-Ischemic Encephalopathy. Pediatrics. 1998;102(2):323–328. - PubMed
-
- Barnett A, Mercuri E, Rutherford M, et al. Neurological and perceptual-motor outcome at 5–6 years of age in children with neonatal encephalopathy: Relationship with neonatal brain MRI. Neuropediatrics. 2002;33(5):242–248. - PubMed
Publication types
MeSH terms
Substances
Grants and funding
LinkOut - more resources
Full Text Sources
