. 2023 Jun 27;14(3):e0356422.
doi: 10.1128/mbio.03564-22. Epub 2023 Apr 13.

The dCache Domain of the Chemoreceptor Tlp1 in Campylobacter jejuni Binds and Triggers Chemotaxis toward Formate

Affiliations

The dCache Domain of the Chemoreceptor Tlp1 in Campylobacter jejuni Binds and Triggers Chemotaxis toward Formate

Jingjing Duan et al. mBio. .

Abstract

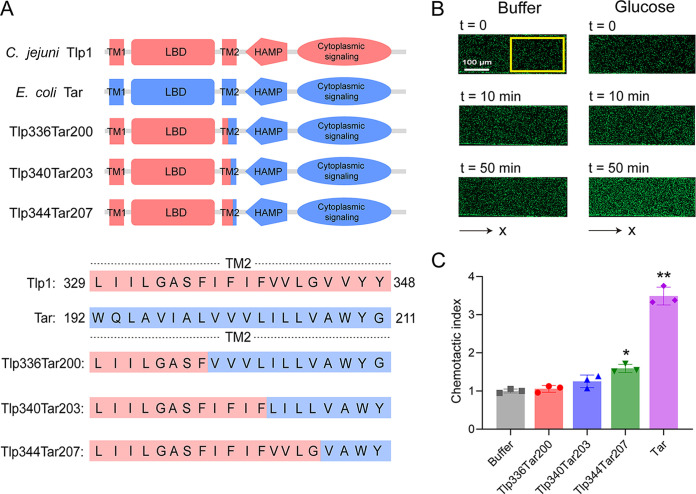
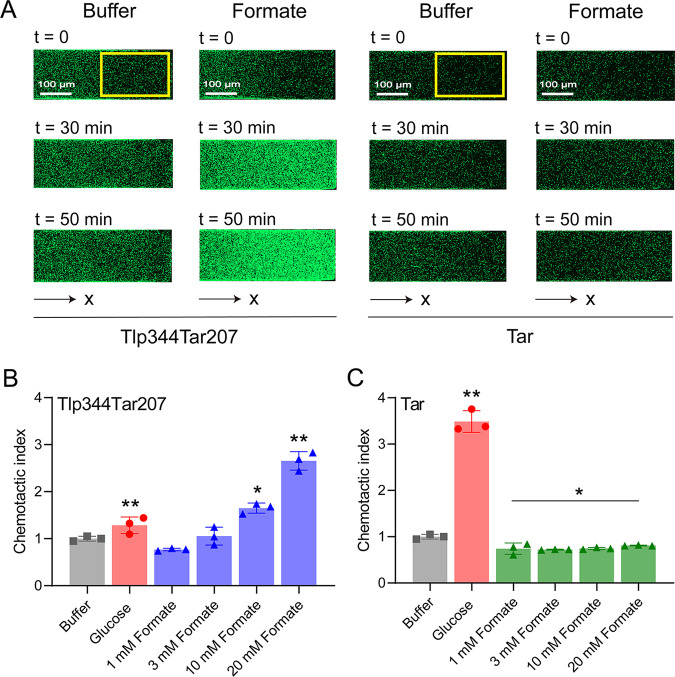
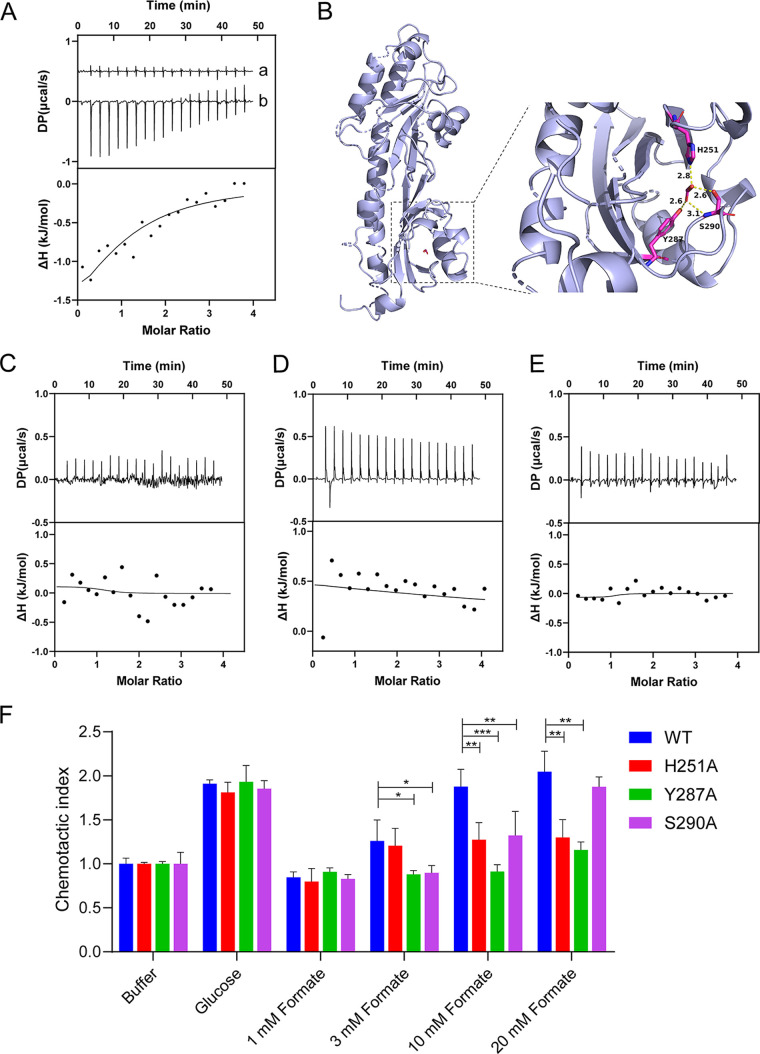
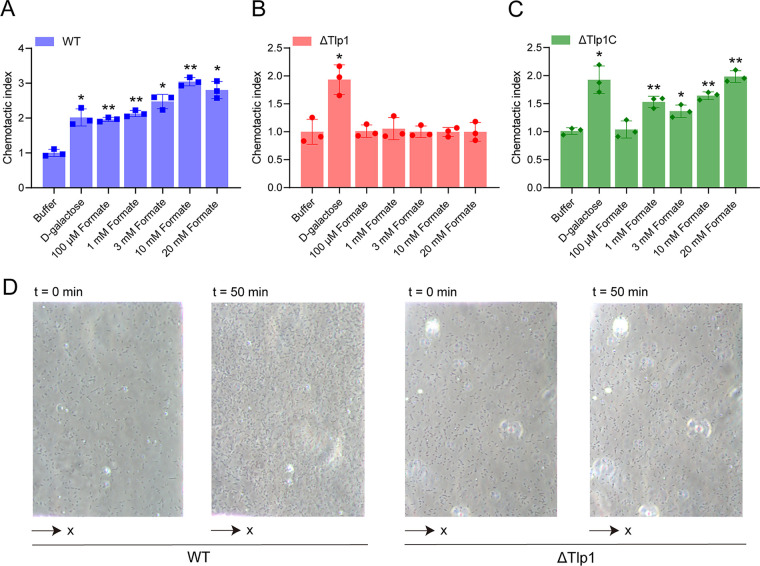
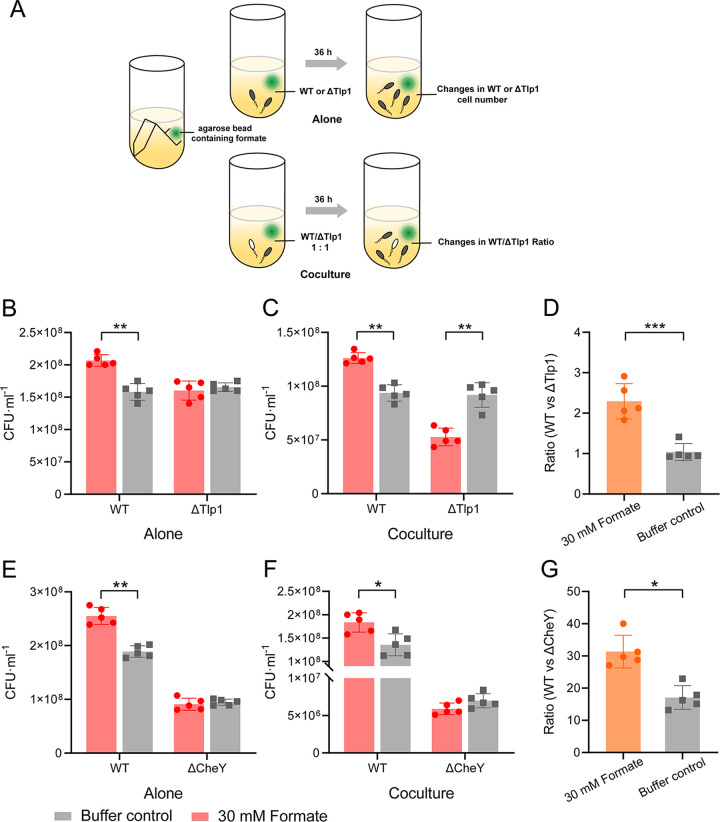
Chemotaxis is an important virulence factor in some enteric pathogens, and it is involved in the pathogenesis and colonization of the host. However, there is limited knowledge regarding the environmental signals that promote chemotactic behavior and the sensing of these signals by chemoreceptors. To date, there is no information on the ligand molecule that directly binds to and is sensed by Campylobacter jejuni Tlp1, which is a chemoreceptor with a dCache-type ligand-binding domain (LBD). dCache (double Calcium channels and chemotaxis receptor) is the largest group of sensory domains in bacteria, but the dCache-type chemoreceptor that directly binds to formate has not yet been discovered. In this study, formate was identified as a direct-binding ligand of C. jejuni Tlp1 with high sensing specificity. We used the strategy of constructing a functional hybrid receptor of C. jejuni Tlp1 and the Escherichia coli chemoreceptor Tar to screen for the potential ligand of Tlp1, with the binding of formate to Tlp1-LBD being verified using isothermal titration calorimetry. Molecular docking and experimental analyses indicated that formate binds to the membrane-proximal pocket of the dCache subdomain. Chemotaxis assays demonstrated that formate elicits robust attractant responses of the C. jejuni strain NCTC 11168, specifically via Tlp1. The chemoattraction effect of formate via Tlp1 promoted the growth of C. jejuni, especially when competing with Tlp1- or CheY-knockout strains. Our study reveals the molecular mechanisms by which C. jejuni mediates chemotaxis toward formate, and, to our knowledge, is the first report on the high-specificity binding of the dCache-type chemoreceptor to formate as well as the physiological role of chemotaxis toward formate. IMPORTANCE Chemotaxis is important for Campylobacter jejuni to colonize favorable niches in the gastrointestinal tract of its host. However, there is still a lack of knowledge about the ligand molecules for C. jejuni chemoreceptors. The dCache-type chemoreceptor, namely, Tlp1, is the most conserved chemoreceptor in C. jejuni strains; however, the direct-binding ligand(s) triggering chemotaxis has not yet been discovered. In the present study, we found that the ligand that binds directly to Tlp1-LBD with high specificity is formate. C. jejuni exhibits robust chemoattraction toward formate, primarily via Tlp1. Tlp1 is the first reported dCache-type chemoreceptor that specifically binds formate and triggers strong chemotaxis. We further demonstrated that the formate-mediated promotion of C. jejuni growth is correlated with Tlp1-mediated chemotaxis toward formate. Our work provides important insights into the mechanism and physiological function of chemotaxis toward formate and will facilitate further investigations into the involvement of microbial chemotaxis in pathogen-host interactions.

Keywords: Campylobacter jejuni; Tlp1; chemotaxis; formate; hybrid receptor.


Conflict of interest statement

The authors declare no conflict of interest.

Figures

FIG 1
FIG 1
Design and construction of the functional Tlp1-Tar hybrid chemoreceptors. (A) Design and construction of the hybrid receptors Tlp336Tar200, Tlp340Tar203, and Tlp344Tar207. The upper panel shows the architecture of Tlp1 (red), Tar (blue), and the Tlp1-Tar hybrid receptor with a periplasmic LBD, two transmembrane helixes (TM1, TM2), HAMP domain, and cytoplasmic signaling domain. The lower panel shows the sequence alignment for Tlp1 and Tar, shown in red and blue, respectively, with the sequences of the hybrid receptors given below. (B) Examples of the distribution of E. coli cells expressing Tlp344Tar207 in the observation channel of the microfluidic device, acquired before the addition of ligands as well as 10 min and 50 min after the addition of 30 mM glucose at the source pore (scale bar: 100 μm). The x component (black arrow) indicates the direction up the concentration gradient of glucose. The response is characterized by measurements of the fluorescence intensity (cell density) in the analysis region (150 × 300 μm) of the observation channel, which is indicated by a yellow rectangle. (C) Relative fluorescence intensities of the cells expressing Tlp336Tar200, Tlp340Tar203, Tlp344Tar207, or Tar as the sole receptor in the analysis region of the observation channel at 50 min after the addition of glucose at the source or without ligand (buffer). The corresponding values of the fluorescence intensities in the analysis regions were normalized to the fluorescence intensity of the cells in the buffer to obtain the chemotactic index values. Error bars indicate the standard errors of three replicates. The P values were calculated using a paired t test. *, P < 0.05; **, P < 0.01, compared to the buffer. LBD, ligand-binding domain; HAMP, histidine kinases, adenylate cyclases, methyl-accepting proteins, and phosphatases.
FIG 2
FIG 2
Microfluidic screening for potential ligands of Tlp1 using the Tlp344Tar207 receptor. (A) Examples of the distribution of E. coli cells expressing Tlp344Tar207 or Tar as the sole receptor in the observation channel of the microfluidic device, acquired before the addition of ligands as well as 30 min and 50 min after the addition of 20 mM formate at the source pore (scale bar: 100 μm). The x component (black arrow) indicates the direction up the concentration gradient of formate. The response is characterized by measurements of the fluorescence intensity (cell density) in the analysis region (150 × 300 μm) of the observation channel, which is indicated by a yellow rectangle. (B) Relative fluorescence intensity of E. coli cells expressing Tlp344Tar207 as the sole receptor in the analysis region of the observation channel at 50 min after the addition of the indicated formate concentrations at the source or without ligand (buffer). (C) Relative fluorescence intensity of E. coli cells expressing Tar as the sole receptor in the analysis region of the observation channel 50 min after the addition of the indicated formate concentrations at the source or without ligand (buffer). In panels B and C, the corresponding values of the fluorescence intensities in the analysis regions were normalized to the fluorescence intensity of the cells in the buffer to obtain the chemotactic index. Error bars indicate the standard errors of three replicates. The P values were calculated using a paired t test. *, P < 0.05; **, P < 0.01, compared to the buffer.
FIG 3
FIG 3
The binding of formate to Tlp1-LBD and its mutant proteins as well as the chemotaxis of Tlp344Tar207 mutants to glucose and formate. (A) Microcalorimetric titrations of Tlp1-LBD with formate at pH 8.0. “a” indicates the titration of formate to buffer, and “b” indicates that of formate to Tlp1-LBD. Upper panel, titration raw data; lower panel, fit of dilution heat-corrected and concentration-normalized raw data with a model for the binding of a single ligand to a macromolecule. The concentrations of Tlp1-LBD and formate were 210 μM and 4 mM, respectively. The curve corresponds to the best fit that was calculated using the “one binding site model” of the Malvern MicroCal PEAQ ITC Analysis software package. (B) Molecular docking analysis of Tlp1-LBD to formate, carried out using Autodock. The conformation with the lowest docking energy was rendered using PyMOL software. Formate binds to the membrane-proximal pocket of Tlp1-LBD. The key residues in the ligand-binding pocket that is involved in formate binding are shown as sticks. The hydrogen bonds are shown as yellow dashed lines. The distances between formate and residue H251, Y287, or S290 are indicated. (C–E) ITC titrations of Tlp1-LBD H251A, Y287A, and S290A with formate. The concentrations of Tlp1-LBD H251A, Y287A, and S290A were 211, 192, and 211 μM, respectively, while the concentration of formate was 4 mM. (F) Chemotaxis of Tlp344Tar207 mutants to glucose and different concentrations of formate. The relative fluorescence intensity of E. coli cells expressing Tlp344Tar207 wild-type (WT), Tlp344Tar207-H251A, -Y287A, and -S290A, respectively, at 50 min after the addition of 30 mM glucose and the indicated concentrations of formate at the source or without ligand (buffer). The corresponding values of the fluorescence intensities were normalized to the fluorescence intensity of the cells in the buffer to obtain the chemotactic index. Error bars indicate the standard errors of three replicates. *, P < 0.05; **, P < 0.01; ***, P < 0.001.
FIG 4
FIG 4
Chemotactic responses of the C. jejuni strain NCTC 11168 toward formate, as measured using microfluidics. (A–C) The responses of C. jejuni WT (A), Tlp1 knockout strain ΔTlp1 (B), and Tlp1 complement strain ΔTlp1C (C) to different concentrations of formate. The data are shown as the relative chemotactic strength (chemotactic index) in the analysis region of the observation channel at 50 min after the addition of the indicated ligand concentrations at the source or without ligand (buffer). The chemotactic index was obtained by normalizing the corresponding cell numbers in the analysis regions to the number of cells in the buffer. The response to 20 mM d-galactose was considered to be the positive control. Error bars indicate the standard errors of three replicates. Significant differences, compared to the buffer, were calculated using a paired t test. *, P < 0.05; **, P < 0.01. (D) Examples of WT or ΔTlp1 cell distribution in the observation channel of the microfluidic device, acquired before the addition of ligands and at 50 min after the addition of 20 mM formate at the source pore. The x component (black arrow) indicates the direction up the concentration gradient of formate. The response is characterized by measurements of the cell numbers in the analysis region (150 × 100 μm) of the observation channel, which is the view in panel D. WT, wild type.
FIG 5
FIG 5
Role of Tlp1-mediated chemotaxis toward formate in the growth of C. jejuni. (A) Schematic representation of the experimental design used to generate the formate gradient in the unstirred culture. (B) Bacterial numbers of C. jejuni WT and ΔTlp1 cells grown individually in BB medium for 36 h, in the presence (red) or absence (gray) of the formate gradient, as determined using the plate-counting method. (C) Bacterial numbers of WT and ΔTlp1 cells cocultured for 36 h, in the presence (red) or absence (gray) of the formate gradient. The two strains were initially inoculated at a ratio of 1:1. (D) The ratio of WT and ΔTlp1 cells in the presence (orange) or absence (gray) of the formate gradient, as calculated based on the bacterial numbers in the coculture shown in panel C. (E) Bacterial numbers of C. jejuni WT and ΔCheY cells grown individually in BB medium for 36 h, under unstirred conditions, in the presence (red) or absence (gray) of the formate gradient. (F) Bacterial numbers of WT and ΔCheY cells cocultured for 36 h, in the presence (red) or absence (gray) of the formate gradient. The two strains were initially inoculated at a ratio of 1:1. (G) The ratio of WT and ΔCheY cells in the presence (orange) or absence (gray) of the formate gradient, as calculated based on the bacterial numbers in the coculture shown in panel F. The P values were calculated using a paired t test. *, P < 0.05; **, P < 0.01; ***, P < 0.001. The error bars indicate the standard errors of five replicates. WT, wild type.

Similar articles

Cited by

References

    1. Fitzgerald C. 2015. Campylobacter. Clin Lab Med 35:289–298. doi:10.1016/j.cll.2015.03.001. - DOI - PubMed
    1. O'Brien SJ. 2017. The consequences of Campylobacter infection. Curr Opin Gastroenterol 33:14–20. doi:10.1097/mog.0000000000000329. - DOI - PubMed
    1. Wassenaar TM, Blaser MJ. 1999. Pathophysiology of Campylobacter jejuni infections of humans. Microbes Infect 1:1023–1033. doi:10.1016/s1286-4579(99)80520-6. - DOI - PubMed
    1. Korolik V. 2019. The role of chemotaxis during Campylobacter jejuni colonisation and pathogenesis. Curr Opin Microbiol 47:32–37. doi:10.1016/j.mib.2018.11.001. - DOI - PubMed
    1. Matilla MA, Krell T. 2018. The effect of bacterial chemotaxis on host infection and pathogenicity. FEMS Microbiol Rev. 42. doi:10.1093/femsre/fux052. - DOI - PubMed

Publication types

MeSH terms

LinkOut - more resources