. 2023 Oct 3;25(10):1802-1814.
doi: 10.1093/neuonc/noad070.

Short-term topiramate treatment prevents radiation-induced cytotoxic edema in preclinical models of breast-cancer brain metastasis

Affiliations

Short-term topiramate treatment prevents radiation-induced cytotoxic edema in preclinical models of breast-cancer brain metastasis

Maria J Contreras-Zárate et al. Neuro Oncol. .

Abstract

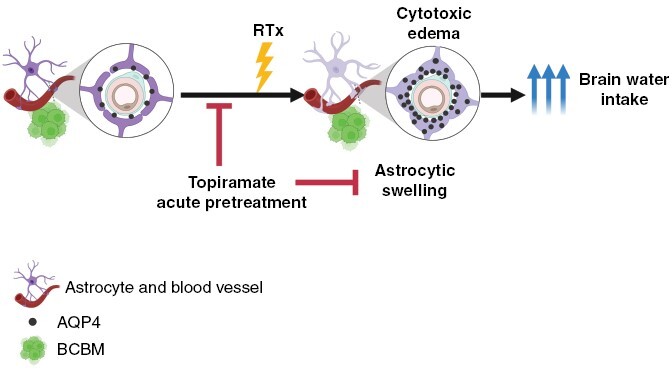
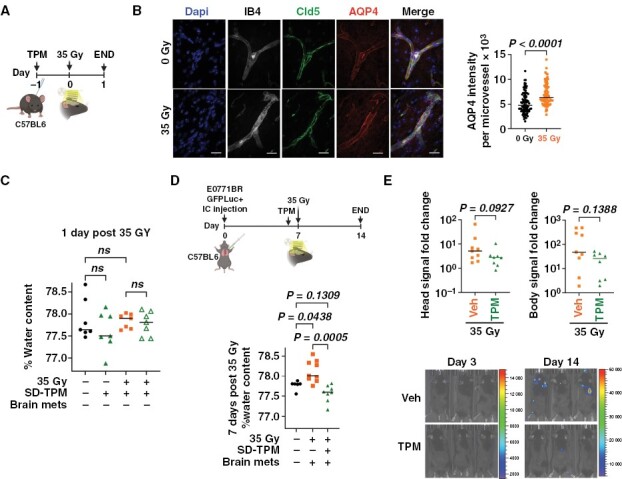
Background: Brain edema is a common complication of brain metastases (BM) and associated treatment. The extent to which cytotoxic edema, the first step in the sequence that leads to ionic edema, vasogenic edema, and brain swelling, contributes to radiation-induced brain edema during BM remains unknown. This study aimed to determine whether radiation-associated treatment of BM induces cytotoxic edema and the consequences of blocking the edema in preclinical models of breast-cancer brain metastases (BCBM).

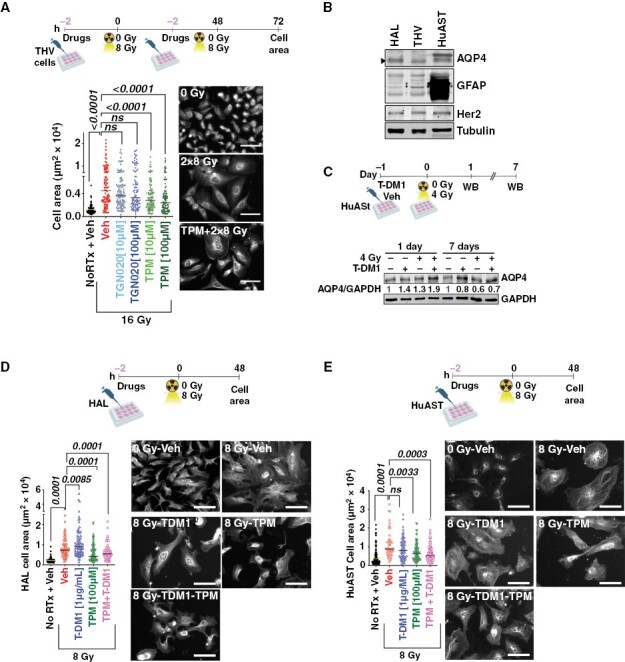
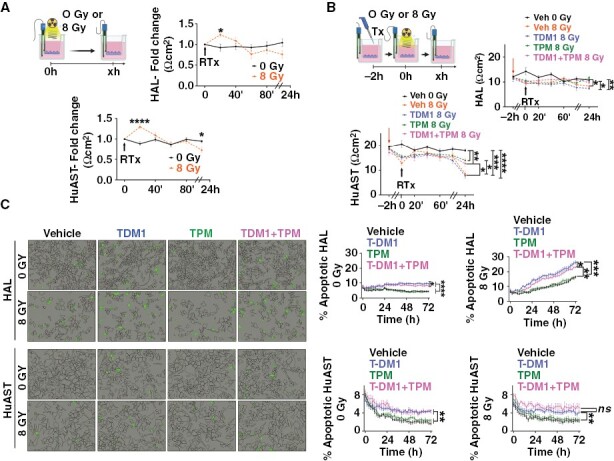
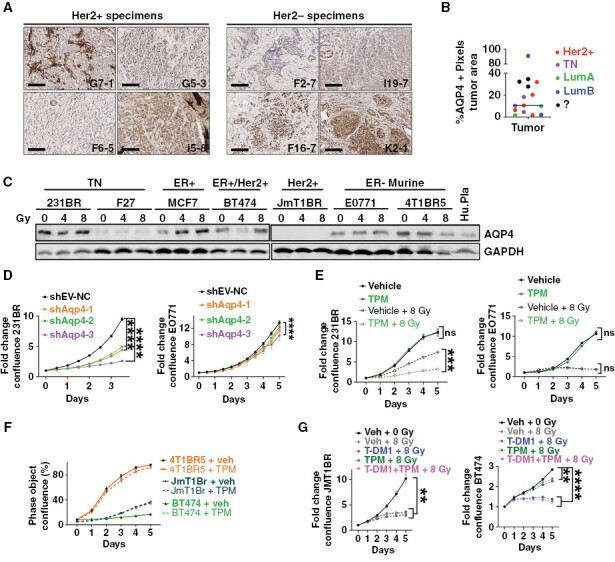
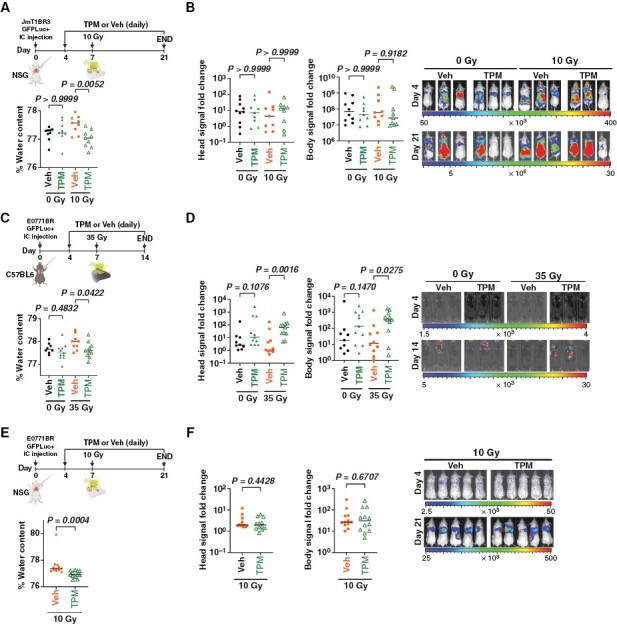
Methods: Using in vitro and in vivo models, we measured astrocytic swelling, trans-electric resistance (TEER), and aquaporin 4 (AQP4) expression following radiation. Genetic and pharmacological inhibition of AQP4 in astrocytes and cancer cells was used to assess the role of AQP4 in astrocytic swelling and brain water intake. An anti-epileptic drug that blocks AQP4 function (topiramate) was used to prevent cytotoxic edema in models of BM.

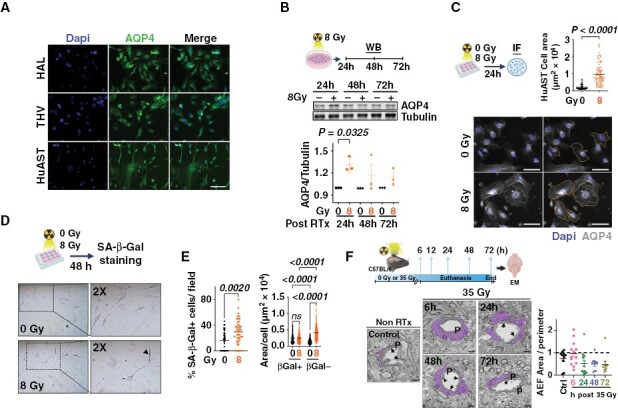
Results: Radiation-induced astrocytic swelling and transient upregulation of AQP4 occurred within the first 24 hours following radiation. Topiramate decreased radiation-induced astrocytic swelling and loss of TEER in astrocytes in vitro, and acute short-term treatment (but not continuous administration), prevented radiation-induced increase in brain water content without pro-tumorigenic effects in multiple preclinical models of BCBM. AQP4 was expressed in clinical BM and breast-cancer cell lines, but AQP4 targeting had limited direct pro-tumorigenic or radioprotective effects in cancer cells that could impact its clinical translation.

Conclusions: Patients with BM could find additional benefits from acute and temporary preventive treatment of radiation-induced cytotoxic edema using anti-epileptic drugs able to block AQP4 function.

Keywords: Aquaporin 4; Brain Edema; Brain metastasis; Brain radiation; Cytotoxic Edema; Topiramate.


Conflict of interest statement

MJC, DMC, KA, JAJ, ZL, and NT: no conflicts. DRO: Clinical trial research funding from Integra Biosciences, Servier Pharmaceuticals. SDK: Clinical trial, preclinical research funding from AstraZeneca, Genentech, Ionis and Roche Pharmaceuticals are all unrelated to this work. PK: Clinical research grant support from Genentech, Radius Health, and Eli Lilly all unrelated to this work.

Figures

Graphical Abstract
Graphical Abstract
Figure 1.
Figure 1.
Radiation induces astrocytic swelling in vitro and in vivo. (A) AQP4 (green) expression in human astrocytes. Nuclei (Dapi-blue). Scale 100 µm. (B) WB shows AQP4 levels in HuAST ± 8 Gy at the indicated times. Graph shows fold change AQP4/tubulin levels relative to non-irradiated cells (n = 3). Paired T-test. (C) Astrocytic area in AQP4-stained HuAST (gray) ±8 Gy 24 hours post-radiation. Orange line shows astrocyte area delimitation. Scale 100 µm. Graph shows area of single cells (n = 86). (D) SA-β-gal staining in HuAST treated ± 8 Gy. Blackhead arrow shows SA-b-gal+ cells. (E) Left: Percentage of SA-β-Gal+ HuAST ± 8 Gy at 48 hours, quantified in 45 fields/condition on 3 independent slides. Right: Individual cell area of βGal+ or βGal- HuAST ± 8 Gy at 48 hours, quantified in bright field images from 3 coverslips per condition using imageJ, analyzed by Kruskal–Wallis test followed by Dunn’s post hoc test. (F) C57Bl6 mice were irradiated with 35 Gy whole brain radiation therapy and euthanized at the indicated times. Representative microphotographs of cortex brain microvessels showing perivascular end feet astrocytes (purple), pericytes (P), and tight junction (black arrows) at the indicated times. Scale 1 µm. Graph shows astrocytic end feet area normalized to the vessel perimeter.
Figure 2.
Figure 2.
Topiramate prevents radiation-induced cell swelling in human astrocytes in vitro. (A) THV cells were pretreated with Veh (DMSO), TGN-020 (10–100 µM), or TPM (10–100 µM) 2 hours prior to ± 8 Gy. Graph shows THV cell area 24 hours after 2 doses of 8 Gy. IF images of THV stained with AQP4 (gray). (B) WB shows AQP4, GFAP, and Her2 expression in human astrocytes. Tubulin is loading control. (C) HuAST were pretreated with vehicle or T-DM1 [1 µg/mL] 2 hours before ± 4 Gy. WB shows AQP4 levels 1 and 7 days post-radiation. GAPDH is loading control. Numbers are AQP4/GAPDH relative to untreated cells. (D) HAL cells were pretreated with Veh (DMSO), T-DM1 (1 µg/mL), TPM (100 µM), or TPM+T-DM1, 2 hours prior to 8 Gy. Graphs show cell area in µm2 48 hours post-radiation. Representative images of AQP4 stained HAL cells (gray). (E) Cell size 48 hours post-irradiation in HuAST treated as in D. For all images, scale bar 100 µm. Data were analyzed with Kruskal–Wallis followed by post hoc corrections (A) or Mann–Whitney test for paired comparisons (D, E).
Figure 3.
Figure 3.
Topiramate restores radiation and T-DM1-induced loss of TEER but does not prevent astrocytic cell death in vitro. (A) Dynamics of TEER changes in monolayer of astrocytes grown on transwell inserts and irradiated with 8 Gy. Graphs show TEER expressed as a fold change of Ωcm2 relative to time zero in HAL and HuAST. (B) TEER in a monolayer of astrocytes pretreated with Veh (DMSO), T-DM1 (1 µg/mL), TPM (100 µM), or (TPM+T-DM1) 2 hours prior to 8 Gy. Graphs show mean TEER in Ωcm2 (n = 9 transwell/treatment). Lines are mean± SEM. (C) HAL or HuAST were treated as B and Apoptotic and Caspase 3/7+ cells (green mask) measured over time. Left: representative images 72 hours after treatment. Right: Graphs shows percentage of apoptotic cells over time. Mean ± SEM (n = 6 wells). *P < .05, **P < .01 ***P < .001, ****P < .0001. (two-way ANOVA-Geisser-Greenhouse correction followed by post hoc test).
Figure 4.
Figure 4.
Pretreatment with topiramate prevents radiation-induced brain water accumulation in a syngeneic model of breast-cancer brain metastases. (A) C57BL6 mice were pretreated with a single dose of vehicle or TPM [50 mg/Kg] 24 hours prior to receiving or not 35 Gy Whole brain radiation therapy (WBRT), and euthanized 24 hours later (n = 10). (B) Confocal z-stack maximum projection of end-feet astrocytes AQP4+ (red) in IB4+ (Isolectin B4, gray) and Cld5+ (Claudin-5, green) microvessels. Dapi stains nuclei (Blue). Scale bar 20 µm. Graph shows mean AQP4 intensity per brain microvessel (n = 100 from 3 mice/treatment). Two-tail Mann–Whitney test. (C) Percentage brain water content per mouse (n = 6 per treatment) in mice from A. One-way ANOVA followed by Sidak’s post hoc test. (D) C57BL6 female mice were injected intracardially with E0771BR-GFP-Luciferase cells and metastasis was allowed to grow for 7 days. Mice were then randomized to receive a single dose of TPM [50 mg/Kg] or vehicle 4 hours prior to receiving 35 Gy WBRT and euthanized 7 days later. Graph shows the percentage of brain water content per mouse (n = 8,9 mice/group). Non-irradiated naïve C57BL6 mice (n = 6) were included as baseline water content. Data were analyzed using Kruskal–Wallis followed by 2-stage linear step-up procedure of Benjamini, Krieger, and Yekutieli multiple comparisons test. (E) Fold change IVIS signal per mouse in head (left) and body (right). Mann–Whitney test. Representative images of IVIS signal 3 and 14 days after cell injection.
Figure 5.
Figure 5.
AQP4 is expressed in breast-cancer brain metastasis. (A) AQP4 IHC staining in Her2+ and Her2- breast-cancer brain metastases (BCBM) clinical samples. (B) Percentage of positive pixels in tumor area in a cohort of 14 BCBM patients from the indicated subtypes. (C) AQP4 WB in human and murine breast-cancer cells treated with 0, 4, and 8 Gy. (D) Fold change confluence of 231BR or E0771 cells infected with shRNA shEV or 3 shRNAs targeting human (231 BR) or murine (E0771) AQP4, respectively. (E) Fold change in confluence of 231BR and E0771 cells treated with vehicle (DMSO) or TPM [100 µMl] 2 hours prior ± 8 Gy. (F) Percentage confluence of indicated breast-cancer cells treated with Vehicle (DMSO) or TPM [100 µM]. (G) Her2+ JmT1BR or BT474 cells treated with vehicle (DMSO), T-DM1 [1 µg/mL], TPM [100 µM], or TPM+T-DM1, 2 hours prior to 8 Gy. For all graphs, line is mean ± SEM. Data were analyzed using Two-way ANOVA with the Geisser-Greenhouse correction followed by Tukey’s multiple comparisons tests.
Figure 6.
Figure 6.
Long-term topiramate decreased brain edema but increased tumor burden in syngeneic mouse models but not in immunocompromised models. (A) NSG mice were injected intracardially with JmT1BR3-GFP-Luciferase cells and 4 days later randomized to receive daily doses of vehicle or TPM [50 mg/Kg]. Mice received or not 10 Gy Whole brain radiation therapy (WBRT) 7 days post-injection and were euthanized 14 days later. Graph shows percentage of brain water content per mouse (n = 9 per group). (B) Fold change metastatic burden in the head (left) and body (right) measured via IVIS in mice from A. Panel shows representative IVIS images 4 and 21 days after cancer cell injections. (C) C57BL6 mice were injected intracardially with E0771BR-GFP-Luciferase cells and treated as in A, except that received 35 Gy WBRT on day 7 and were euthanized 7 days later. Graph shows percentage of brain water content per mouse (n = 9 to 11/group). (D) Fold change metastatic burden in the head (left) and body (right) measured via IVIS in mice from C. Panel shows representative IVIS images 4 and 14 days after cell injections. (E) NSG mice were injected intracardially with E0771BR-GFP-Luciferase cells and treated as in A, except that all mice received 10 Gy WBRT. Graph shows percentage of brain water content per mouse (n = 12/group). (F) Fold change of metastatic burden in the head (left) and body (right) measured via IVIS in mice from E. Panel shows representative IVIS images 4 and 21 days after cancer cell injections. (A–D) Data were analyzed using Kruskal–Wallis followed by Dunn’s post hoc test. (E–F) was analyzed using Mann–Whitney test.

Update of

References

    1. Arvold ND, Lee EQ, Mehta MP, et al. . Updates in the management of brain metastases. Neuro Oncol. 2016;18(8):1043–1065. - PMC - PubMed
    1. Stokum JA, Gerzanich V, Simard JM.. Molecular pathophysiology of cerebral edema. J Cereb Blood Flow Metab. 2016;36(3):513–538. - PMC - PubMed
    1. Klatzo I. Evolution of brain edema concepts. In: Brain Edema IX, et al.Acta Neurochirurgica, vol 60; 1994. Springer, Vienna. - PubMed
    1. Liang D, Bhatta S, Gerzanich V, Simard JM.. Cytotoxic edema: Mechanisms of pathological cell swelling. Neurosurg Focus. 2007;22(5):E2–E2. - PMC - PubMed
    1. Bardutzky J, Schwab S.. Antiedema therapy in ischemic stroke. Stroke. 2007;38(11):3084–3094. - PubMed

Publication types

MeSH terms