

The association between cognitive ability and body mass index: A sibling-comparison analysis in four longitudinal studies
- PMID: 37053134
- PMCID: PMC10101525
- DOI: 10.1371/journal.pmed.1004207
The association between cognitive ability and body mass index: A sibling-comparison analysis in four longitudinal studies
Abstract
Background: Body mass index (BMI) and obesity rates have increased sharply since the 1980s. While multiple epidemiologic studies have found that higher adolescent cognitive ability is associated with lower adult BMI, residual and unobserved confounding due to family background may explain these associations. We used a sibling design to test this association accounting for confounding factors shared within households.
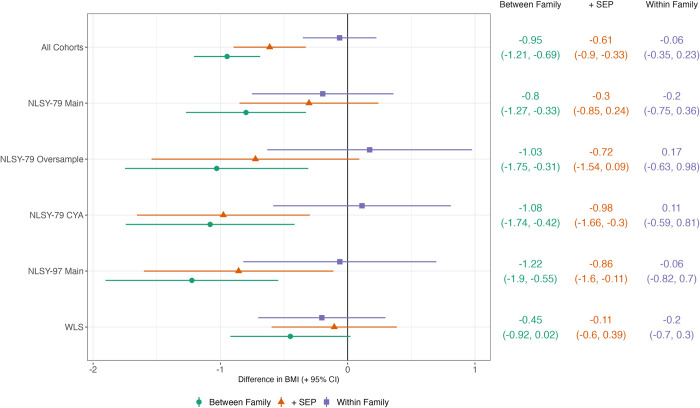
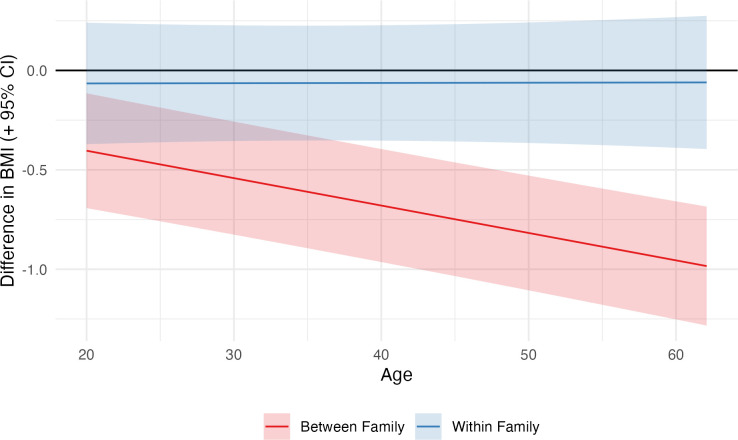
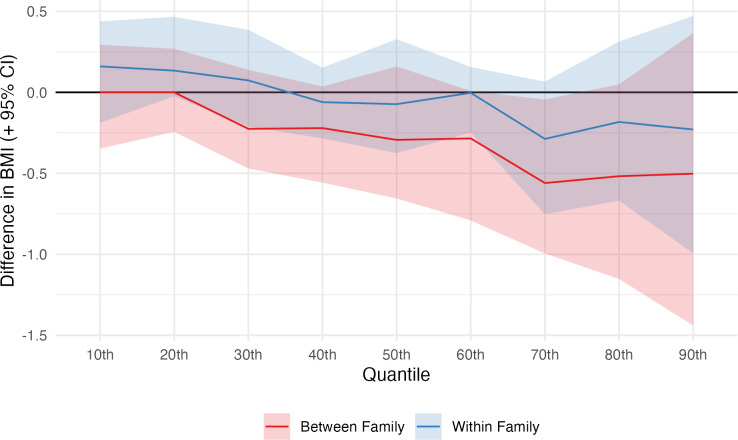
Methods and findings: We used data from four United States general youth population cohort studies: the National Longitudinal Study of Youth 1979 (NLSY-79), the NLSY-79 Children and Young Adult, the NLSY 1997 (NLSY-97), and the Wisconsin Longitudinal Study (WLS); a total of 12,250 siblings from 5,602 households followed from adolescence up to age 62. We used random effects within-between (REWB) and residualized quantile regression (RQR) models to compare between- and within-family estimates of the association between adolescent cognitive ability and adult BMI (20 to 64 years). In REWB models, moving from the 25th to 75th percentile of adolescent cognitive ability was associated with -0.95 kg/m2 (95% CI = -1.21, -0.69) lower BMI between families. Adjusting for family socioeconomic position reduced the association to -0.61 kg/m2 (-0.90, -0.33). However, within families, the association was just -0.06 kg/m2 (-0.35, 0.23). This pattern of results was found across multiple specifications, including analyses conducted in separate cohorts, models examining age-differences in association, and in RQR models examining the association across the distribution of BMI. Limitations include the possibility that within-family estimates are biased due to measurement error of the exposure, confounding via non-shared factors, and carryover effects.
Conclusions: The association between high adolescent cognitive ability and low adult BMI was substantially smaller in within-family compared with between-family analysis. The well-replicated associations between cognitive ability and subsequent BMI may largely reflect confounding by family background factors.
Copyright: © 2023 Wright et al. This is an open access article distributed under the terms of the Creative Commons Attribution License, which permits unrestricted use, distribution, and reproduction in any medium, provided the original author and source are credited.
Conflict of interest statement
The authors have declared that no competing interests exist.
Figures
Similar articles
-
How youth cognitive and sociodemographic factors relate to the development of overweight and obesity in the UK and the USA: a prospective cross-cohort study of the National Child Development Study and National Longitudinal Study of Youth 1979.BMJ Open. 2019 Dec 17;9(12):e033011. doi: 10.1136/bmjopen-2019-033011. BMJ Open. 2019. PMID: 31852706 Free PMC article.
-
Socioeconomic inequalities in childhood and adolescent body-mass index, weight, and height from 1953 to 2015: an analysis of four longitudinal, observational, British birth cohort studies.Lancet Public Health. 2018 Apr;3(4):e194-e203. doi: 10.1016/S2468-2667(18)30045-8. Epub 2018 Mar 21. Lancet Public Health. 2018. PMID: 29571937 Free PMC article.
-
Cardiorespiratory Fitness in Adolescence and Risk of Type 2 Diabetes in Late Adulthood: A Nationwide Sibling-Controlled Cohort Study.medRxiv [Preprint]. 2024 Nov 28:2024.11.26.24318038. doi: 10.1101/2024.11.26.24318038. medRxiv. 2024. Update in: PLoS Med. 2025 May 8;22(5):e1004597. doi: 10.1371/journal.pmed.1004597. PMID: 39649593 Free PMC article. Updated. Preprint.
-
Looking at the Effects of Antibiotic Use on Childhood Obesity and Growth—The PCORnet® Antibiotics Study [Internet].Washington (DC): Patient-Centered Outcomes Research Institute (PCORI); 2020 Oct. Washington (DC): Patient-Centered Outcomes Research Institute (PCORI); 2020 Oct. PMID: 39008651 Free Books & Documents. Review.
-
The Duration, Frequency, and Volume of Exclusive Human Milk and/or Infant Formula Consumption and Overweight and Obesity: A Systematic Review [Internet].Alexandria (VA): USDA Nutrition Evidence Systematic Review; 2020 Jul. Alexandria (VA): USDA Nutrition Evidence Systematic Review; 2020 Jul. PMID: 35315996 Free Books & Documents. Review.
Cited by
-
Intelligence and obesity during the obesity epidemic.Sci Rep. 2025 Feb 6;15(1):4519. doi: 10.1038/s41598-025-87402-z. Sci Rep. 2025. PMID: 39915509 Free PMC article.
-
Early-life cumulative exposure to excess bodyweight and midlife cognitive function: longitudinal analysis in three British birth cohorts.Lancet Healthy Longev. 2024 Mar;5(3):e204-e213. doi: 10.1016/S2666-7568(24)00005-9. Lancet Healthy Longev. 2024. PMID: 38432248 Free PMC article.
References
-
- Abarca-Gómez L, Abdeen ZA, Hamid ZA, Abu-Rmeileh NM, Acosta-Cazares B, Acuin C, et al.. Worldwide trends in body-mass index, underweight, overweight, and obesity from 1975 to 2016: a pooled analysis of 2416 population-based measurement studies in 128·9 million children, adolescents, and adults. Lancet. 2017;390:2627–2642. doi: 10.1016/S0140-6736(17)32129-3 - DOI - PMC - PubMed
-
- Dai H, Alsalhe TA, Chalghaf N, Riccò M, Bragazzi NL, Wu J. The global burden of disease attributable to high body mass index in 195 countries and territories, 1990–2017: An analysis of the Global Burden of Disease Study. PLoS Med. 2020;17:e1003198. doi: 10.1371/journal.pmed.1003198 - DOI - PMC - PubMed
Publication types
MeSH terms
Grants and funding
LinkOut - more resources
Full Text Sources
Medical
