. 2023 Apr 13;18(4):e0284282.
doi: 10.1371/journal.pone.0284282. eCollection 2023.

Validation of an orthotopic non-small cell lung cancer mouse model, with left or right tumor growths, to use in conformal radiotherapy studies

Affiliations

Validation of an orthotopic non-small cell lung cancer mouse model, with left or right tumor growths, to use in conformal radiotherapy studies

Li Ming Wang et al. PLoS One. .

Abstract

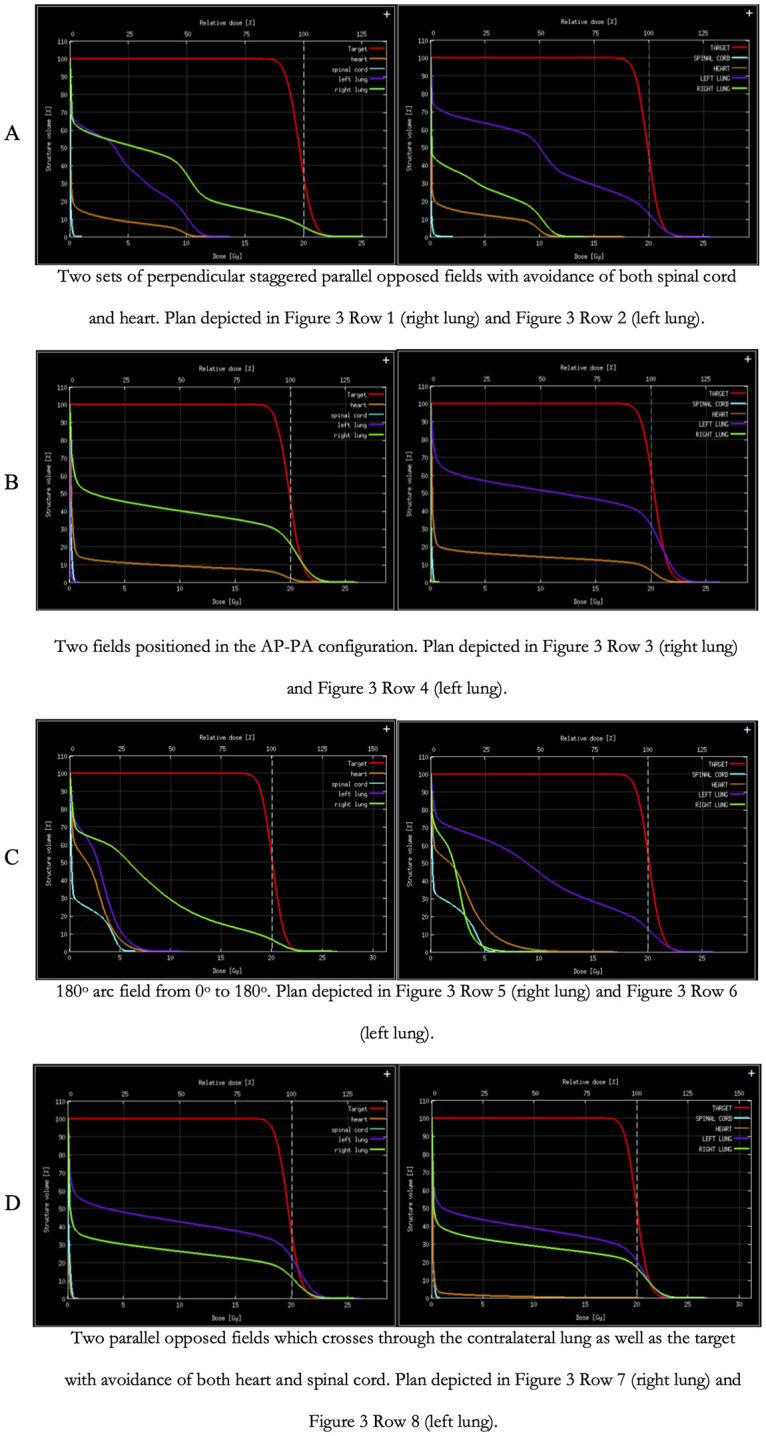
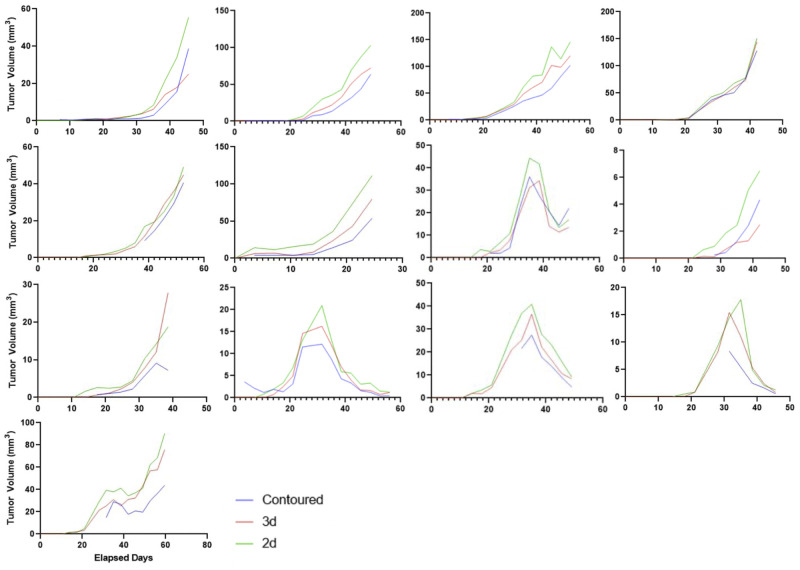
Orthotopic non-small cell lung cancer (NSCLC) mice models are important for establishing translatability of in vitro results. However, most orthotopic lung models do not produce localized tumors treatable by conformal radiotherapy (RT). Here we report on the performance of an orthotopic mice model featuring conformal RT treatable tumors following either left or right lung tumor cell implantation. Athymic Nude mice were surgically implanted with H1299 NSCLC cell line in either the left or right lung. Tumor development was tracked bi-weekly using computed tomography (CT) imaging. When lesions reached an appropriate size for treatment, animals were separated into non-treatment (control group) and RT treated groups. Both RT treated left and right lung tumors which were given a single dose of 20 Gy of 225 kV X-rays. Left lung tumors were treated with a two-field parallel opposed plan while right lung tumors were treated with a more conformal four-field plan to assess tumor control. Mice were monitored for 30 days after RT or after tumor reached treatment size for non-treatment animals. Treatment images from the left and right lung tumor were also used to assess the dose distribution for four distinct treatment plans: 1) Two sets of perpendicularly staggered parallel opposed fields, 2) two fields positioned in the anterior-posterior and posterior-anterior configuration, 3) an 180° arc field from 0° to 180° and 4) two parallel opposed fields which cross through the contralateral lung. Tumor volumes and changes throughout the follow-up period were tracked by three different types of quantitative tumor size approximation and tumor volumes derived from contours. Ultimately, our model generated delineable and conformal RT treatable tumor following both left and right lung implantation. Similarly consistent tumor development was noted between left and right models. We were also able to demonstrate that a single 20 Gy dose of 225 kV X-rays applied to either the right or left lung tumor models had similar levels of tumor control resulting in similar adverse outcomes and survival. And finally, three-dimensional tumor approximation featuring volume computed from the measured length across three perpendicular axes gave the best approximation of tumor volume, most closely resembled tumor volumes obtained with contours.


Conflict of interest statement

The authors have declared that no competing interests exist.

Figures

Fig 1
Fig 1. Image of the incision site featuring the lung visible through the chest wall.
Images show a lung on exhale (left) and inhale (right). Relevant anatomical landmarks such as the ribs (white dashed lines), lower border of the lung (orange line) and the third intercostal space (blue arrow) counting from the lowest true rib towards the cranial direction are highlighted.
Fig 2
Fig 2. Image of the incision site featuring the lung visible through the chest wall.
Images show a lung on exhale (left) and inhale (right). Syringe is advanced to a depth of 4 mm, measured from tip of bevel to lung surface. While not shown in this image for clarity, locking forceps were fixed 4 mm from the tip of the needle to impede the syringe from being inserted further than the acceptable depth.
Fig 3
Fig 3. Treatment plans for both the left and right lung.
The columns are views of the treatment plan from three visual axes, transversal (Column A), sagittal (Column B) and coronal (Column C). All the even numbered rows are plans which featured left lung lesions while all odd numbered rows are plans featured right lung lesions. The plans shown are 1) 2 sets of perpendicular staggered parallel opposed fields with avoidance of both spinal cord and heart (Row 1 & 2), 2) 2 fields positioned in APPA configuration (Row 3 & 4), 3) an 180° arc field from 0° to 180° (Row 5 & 6) and 4) 2 parallel opposed fields which crosses through the contralateral lung as well as the target with avoidance of both heart and spinal cord (Row 7 & 8).
Fig 4
Fig 4. The images feature the transverse (1st image of every row), coronal (2nd image of every row), and sagittal (3rd image of every row) slices of the CT image at the location of the lesion (indicated by the green arrow).
Each row of images features methods of measuring (as delineated by red lines) based on the RECIST criteria (1st row from the top), two-dimensional traditional measurement (2nd row), and three-dimensional ellipsoid-based measurement (3rd row).
Fig 5
Fig 5. Graph of tumor response in CTRL and RT animals.
Graph contains both left and right implanted tumor responses as they performed similarly. Tumor volumes normalized to tumor volume at the time of treatment are aligned based on date of sham RT or RT treatment (Day 0). Animals were separated into non-treated (CTRL—green line) and RT treated (RT—blue) with 14 and 13 animals in each group, respectively. The asterisk indicates the p value of the computed Mann-Whitney test as being p < 0.05 (*) or p < 0.005 (**) between the CTRL and RT groups.
Fig 6
Fig 6. Examples of lung external tumors located in the thoracic cavity.
Tumors are indicated with the green arrows while the lung is indicated with the yellow arrow. The blue arrow indicates the diaphragm, on which the lowest of the three indicated lesion sits. This example animal is shown pre-perfusion during necropsy with multiple lung external lesions visible in the thoracic cavity. The mouse was injected with tumor cells into the right lung as per the methodology outlined.
Fig 7
Fig 7. Average animal weights across all groups post-surgery (left), n = 27, and animal weights as divided by treatment group (right) showing CTRL group animals (blue), n = 14, and RT animals given one dose of 20 Gy (orange), n = 13.
Both left and right lung implanted animals responded similarly and were grouped together for analysis. Days elapsed refers to the number of days since initial tumor cell implantation.
Fig 8
Fig 8. Plots featuring survival of CTRL and RT animals.
Box and whisker plot showing animal survival after RT (left), n = 27, comparing survival of untreated animals (blue), n = 14, and animals given a single dose of 20 Gy (orange), n = 13. Kaplan-Meier survival curve showing the rate of animal mortality throughout the period after RT (right), n = 28, featuring survival of untreated animals (blue), n = 16, and animals given a single dose of 20 Gy (orange), n = 12. Like tumor size response, both left and right lung animals had similar survival outcome and were grouped together for analysis. The same treatment regimen is applied to animals in Fig 5 and the current figure.
Fig 9
Fig 9. DVHs of different treatment plans.
Consistent across all DVHs are dose characteristics of the target, delineating the gross tumor volume (red), the heart (orange), spinal cord (cyan), purple (left lung) and green (right lung). The DVHs were separated into right lung (left column) and left lung (right column) DVHs. With each row representing the different treatment plans.
Fig 10
Fig 10. Plots of tumor volume tracking for 13 contoured sample tumors featuring contoured (blue line), 3D approximated tumor volume (red line) and 2D approximated tumor volumes (green line).
The x-axis represents elapsed days while the y-axis expresses tumor volume in mm3. The plots illustrate consistent tumor volume overestimation for 2D approximated tumor measures while that of 3D more closely approximated the contoured volume.

Similar articles

Cited by

  • Radiation-induced amphiregulin drives tumour metastasis.
    Piffkó A, Yang K, Panda A, Heide J, Tesak K, Wen C, Zawieracz K, Wang L, Naccasha EZ, Bugno J, Fu Y, Chen D, Donle L, Lengyel E, Tilley DG, Mack M, Rock RS, Chmura SJ, Vokes EE, He C, Pitroda SP, Liang HL, Weichselbaum RR. Piffkó A, et al. Nature. 2025 Jul;643(8072):810-819. doi: 10.1038/s41586-025-08994-0. Epub 2025 May 14. Nature. 2025. PMID: 40369065

References

    1. Kahn J, Tofilon PJ, Camphausen K. Preclinical models in radiation oncology. Radiation Oncology. 2012;7(1):223. doi: 10.1186/1748-717X-7-223 - DOI - PMC - PubMed
    1. Junttila MR, de Sauvage FJ. Influence of tumour micro-environment heterogeneity on therapeutic response. Nature. 2013;501(7467):346–54. doi: 10.1038/nature12626 - DOI - PubMed
    1. Kang Y, Omura M, Suzuki A, Theeraladanon C, Oka T, Nakagami Y, et al.. Proliferation of human lung cancer in an orthotopic transplantation mouse model. Exp Ther Med. 2010;1(3):471–5. Epub 2010/05/01. doi: 10.3892/etm_00000073 . - DOI - PMC - PubMed
    1. Graves EE, Maity A, Le Q-T, editors. The tumor microenvironment in non–small-cell lung cancer. Seminars in radiation oncology; 2010: Elsevier. - PMC - PubMed
    1. Colton M, Cheadle EJ, Honeychurch J, Illidge TM. Reprogramming the tumour microenvironment by radiotherapy: implications for radiotherapy and immunotherapy combinations. Radiation Oncology. 2020;15(1):254. doi: 10.1186/s13014-020-01678-1 - DOI - PMC - PubMed

Publication types

MeSH terms