. 2023 Jun 13;29(12):2226-2238.
doi: 10.1158/1078-0432.CCR-22-3714.

Clinical Importance of the lncRNA NEAT1 in Cancer Patients Treated with Immune Checkpoint Inhibitors

Affiliations

Clinical Importance of the lncRNA NEAT1 in Cancer Patients Treated with Immune Checkpoint Inhibitors

Joseph Toker et al. Clin Cancer Res. .

Abstract

Purpose: mAbs targeting the PD-1/PD-L1 immune checkpoint are powerful tools to improve the survival of patients with cancer. Understanding the molecular basis of clinical response to these treatments is critical to identify patients who can benefit from this immunotherapy. In this study, we investigated long noncoding RNA (lncRNA) expression in patients with cancer treated with anti-PD-1/PD-L1 immunotherapy.

Experimental design: lncRNA expression profile was analyzed in one cohort of patients with melanoma and two independent cohorts of patients with glioblastoma (GBM) undergoing anti-PD-1/PD-L1 immunotherapy. Single-cell RNA-sequencing analyses were performed to evaluate lncRNA expression in tumor cells and tumor-infiltrating immune cells.

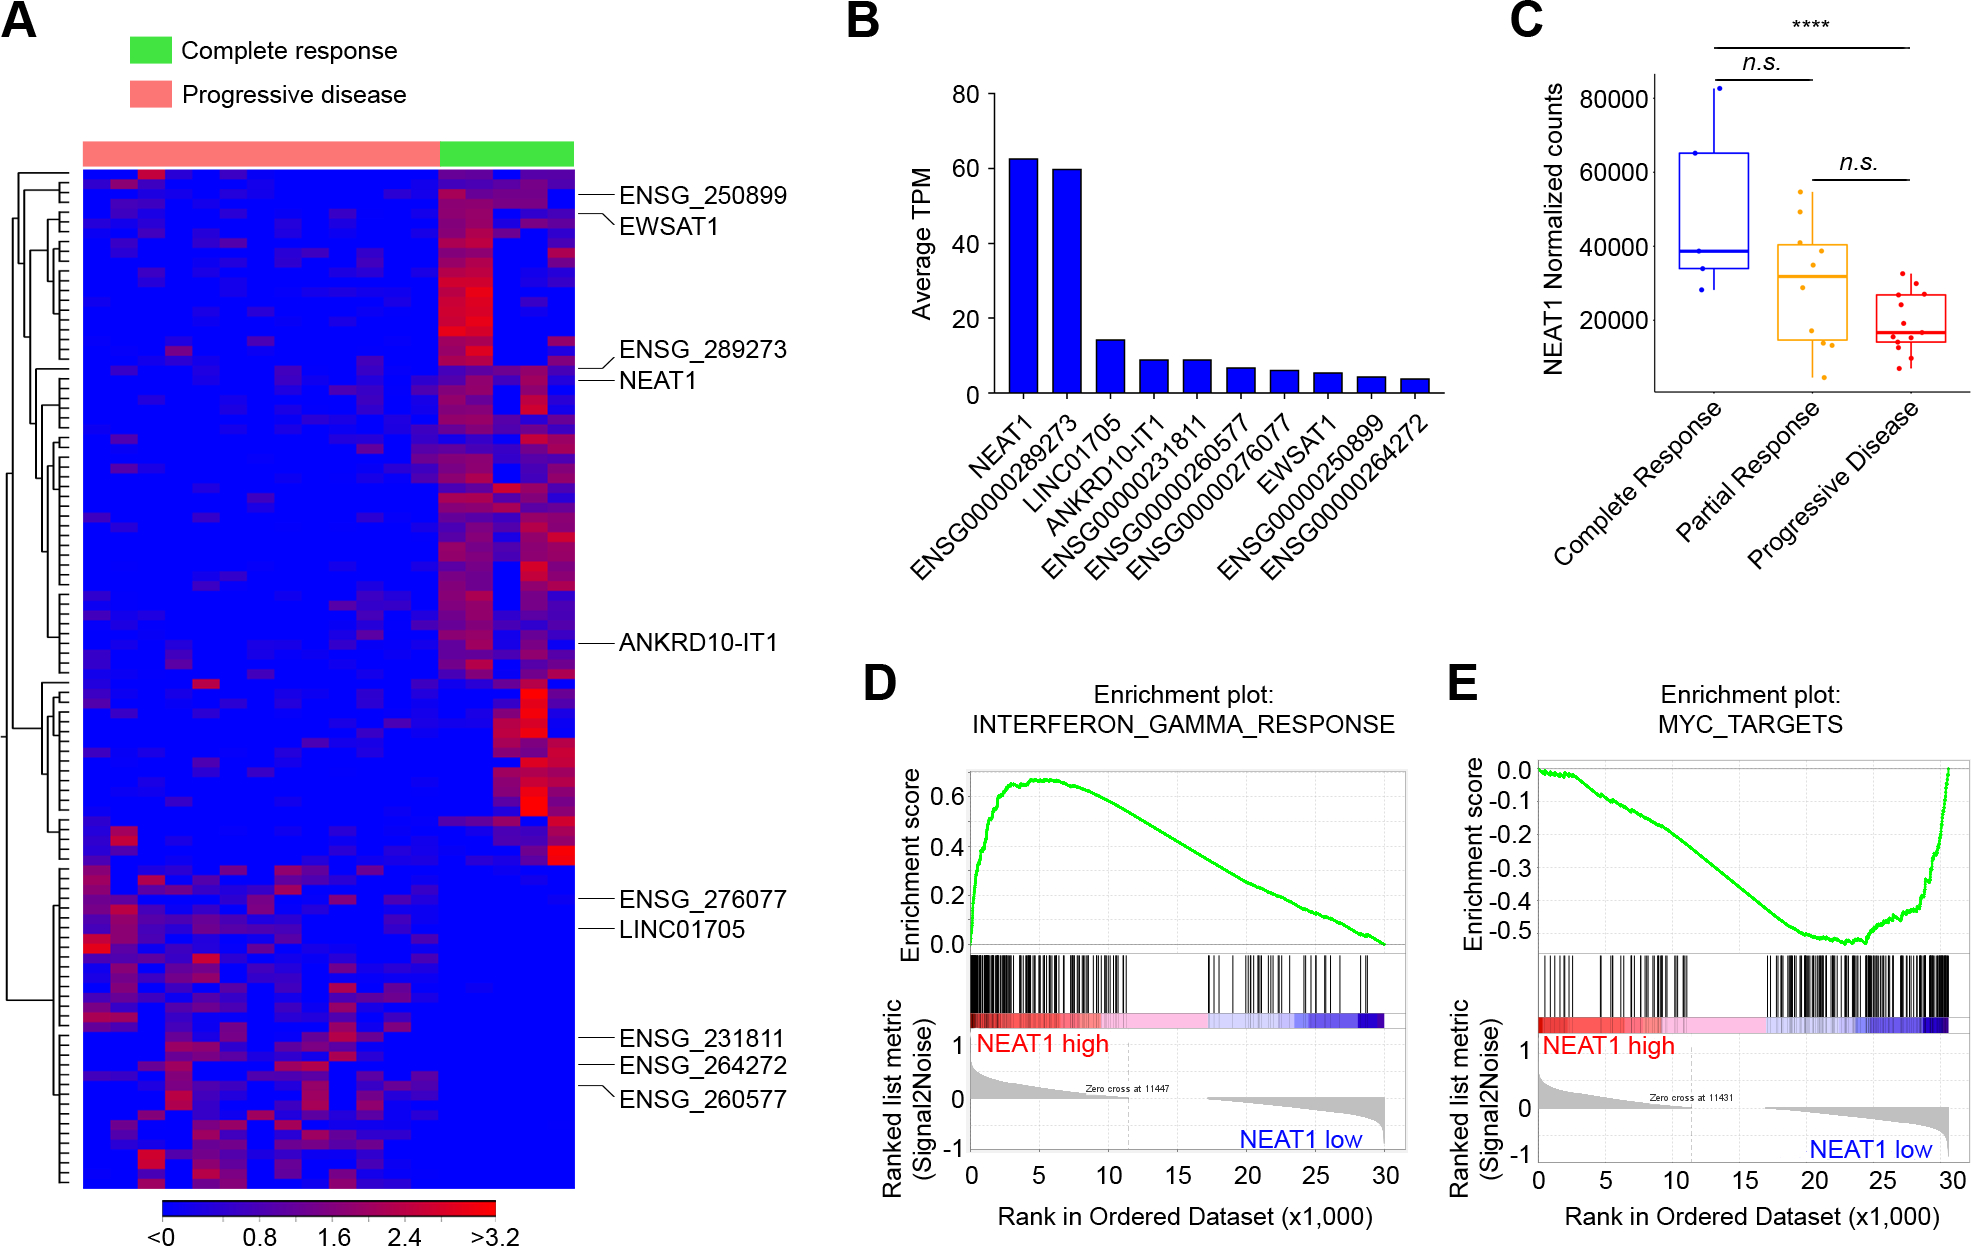
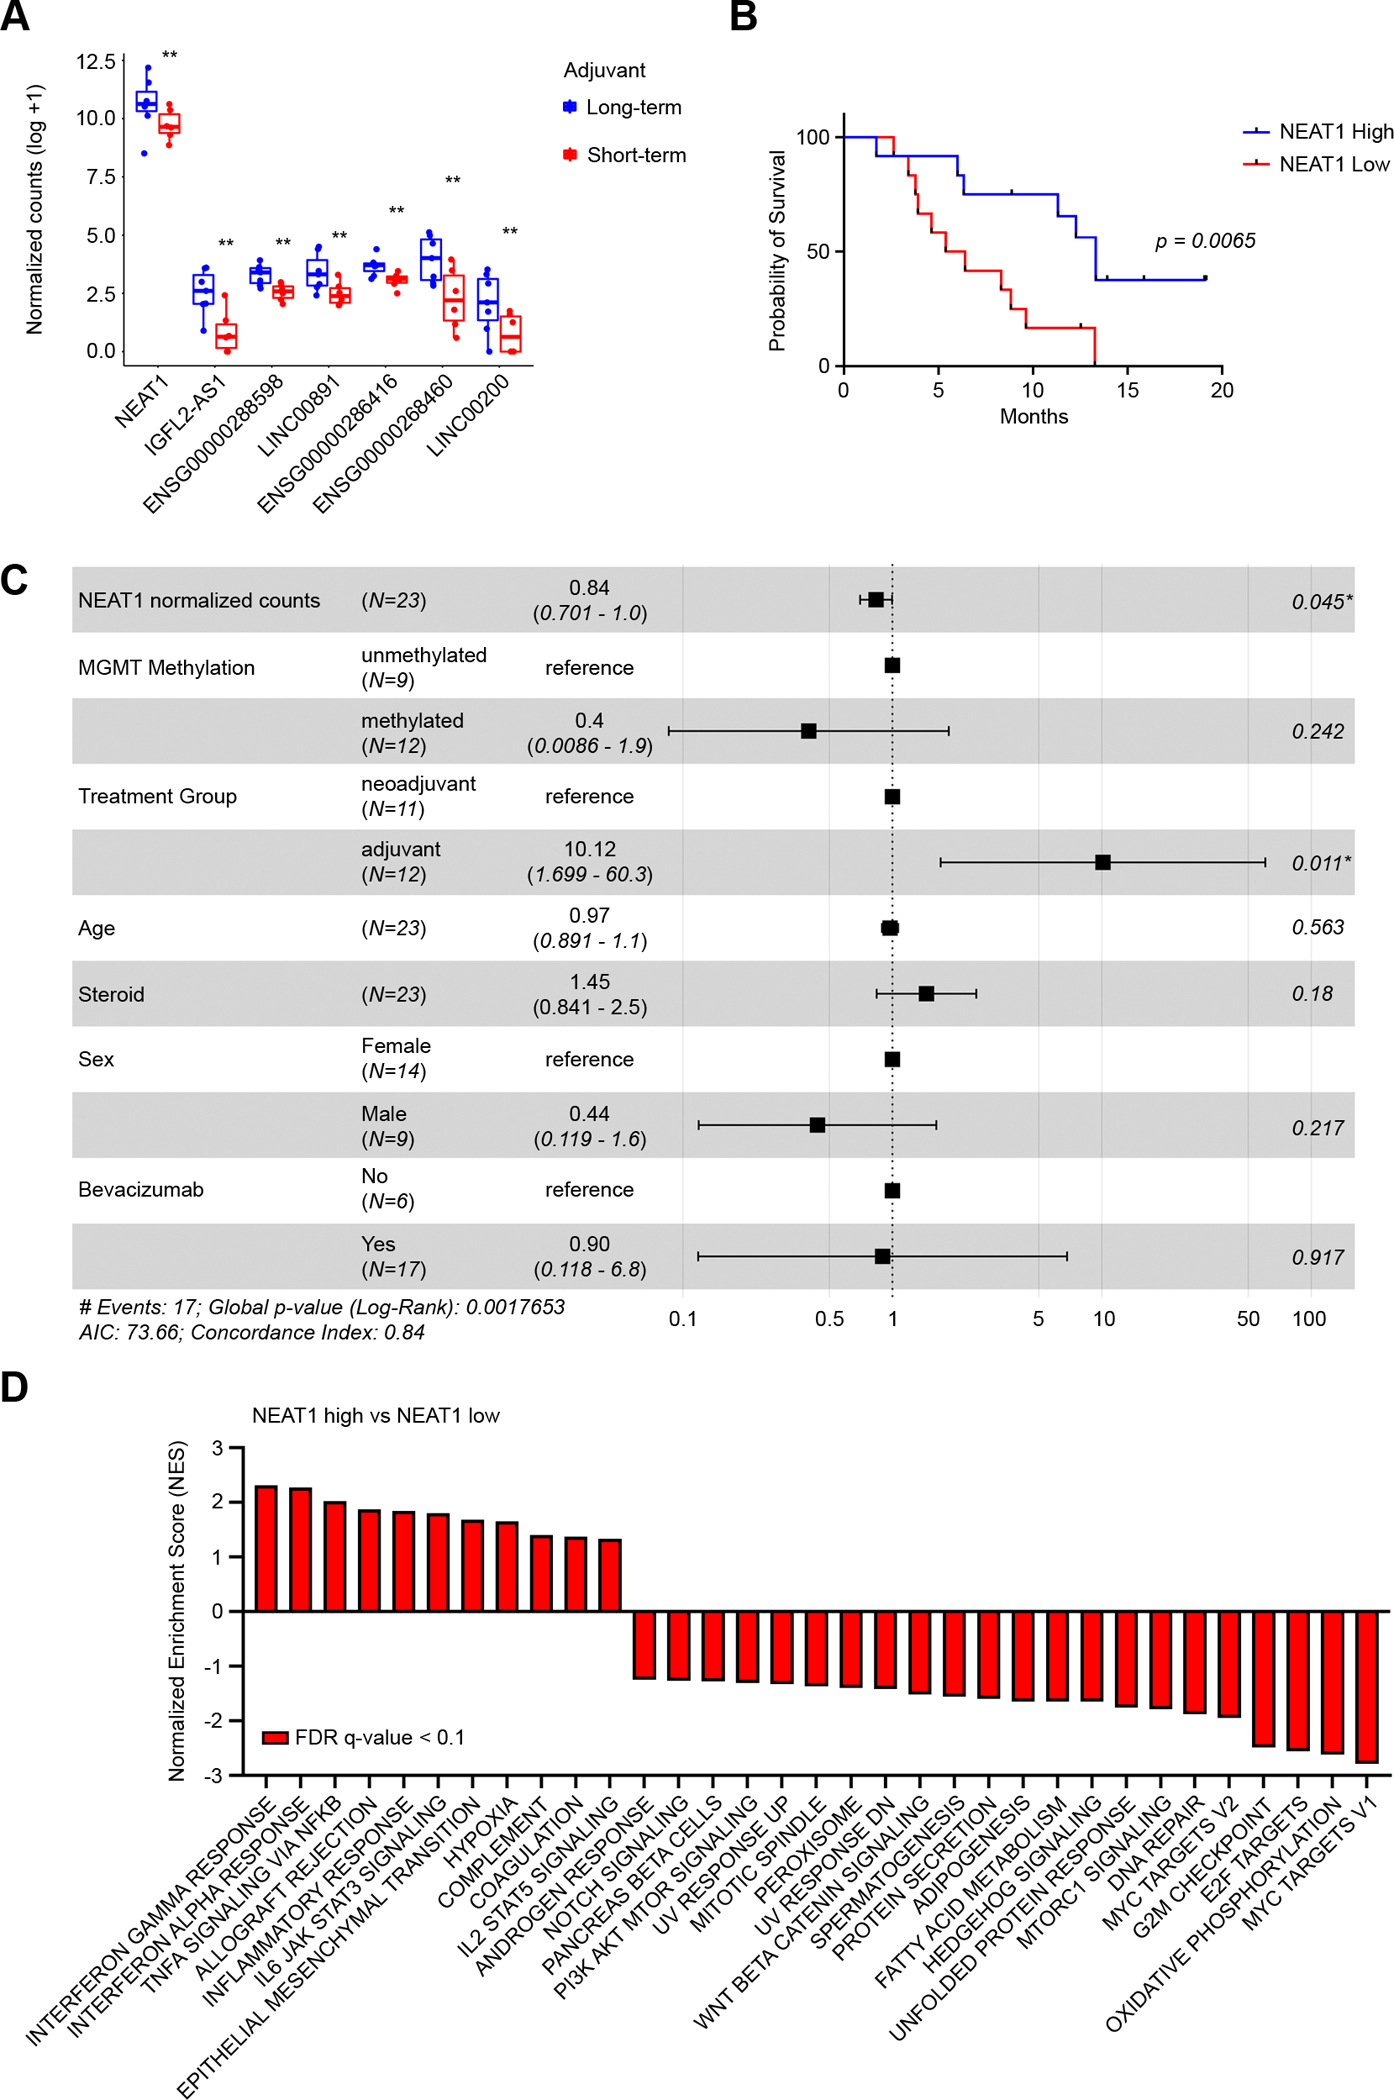
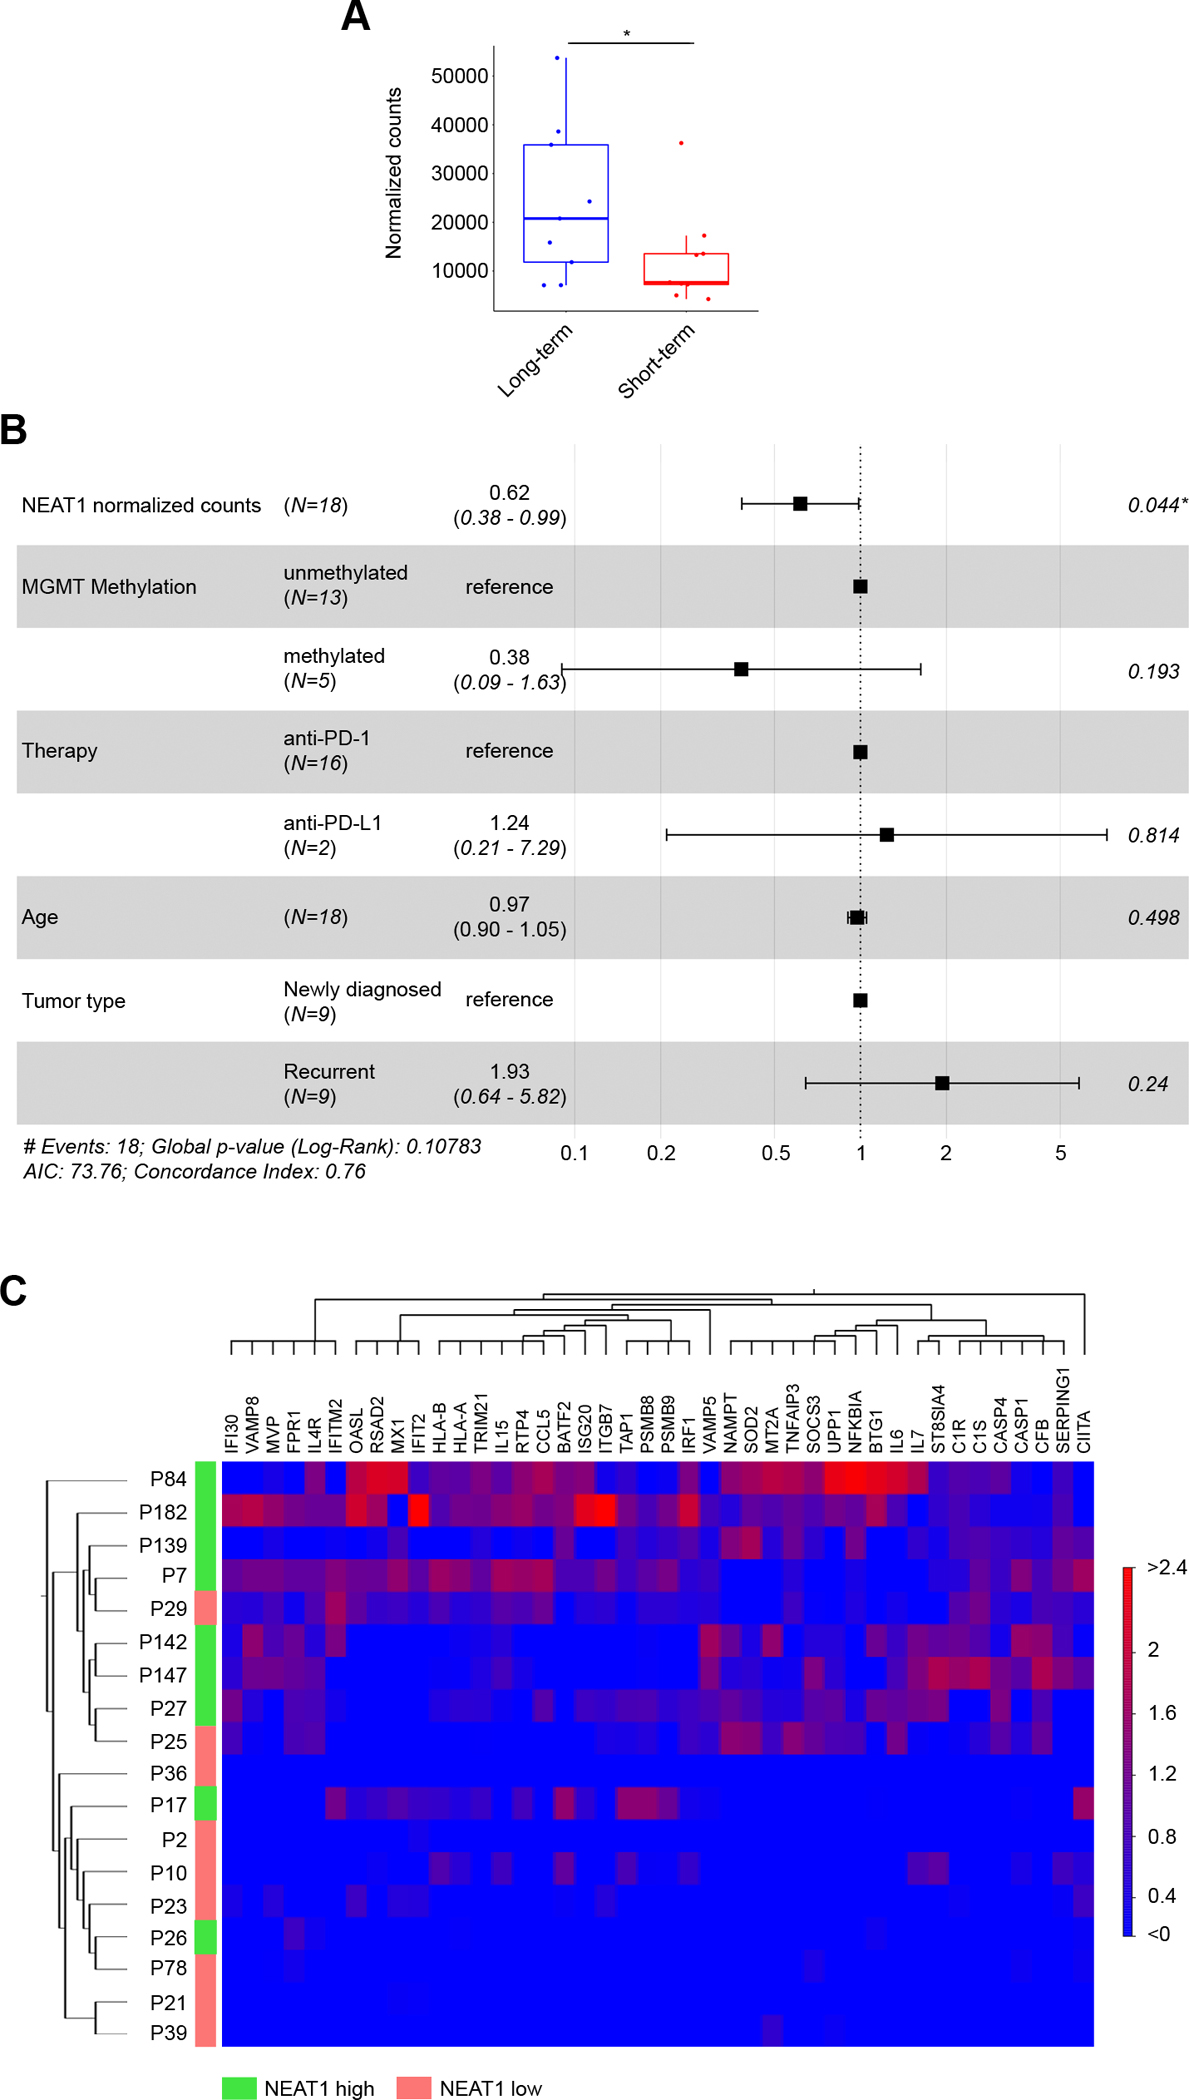
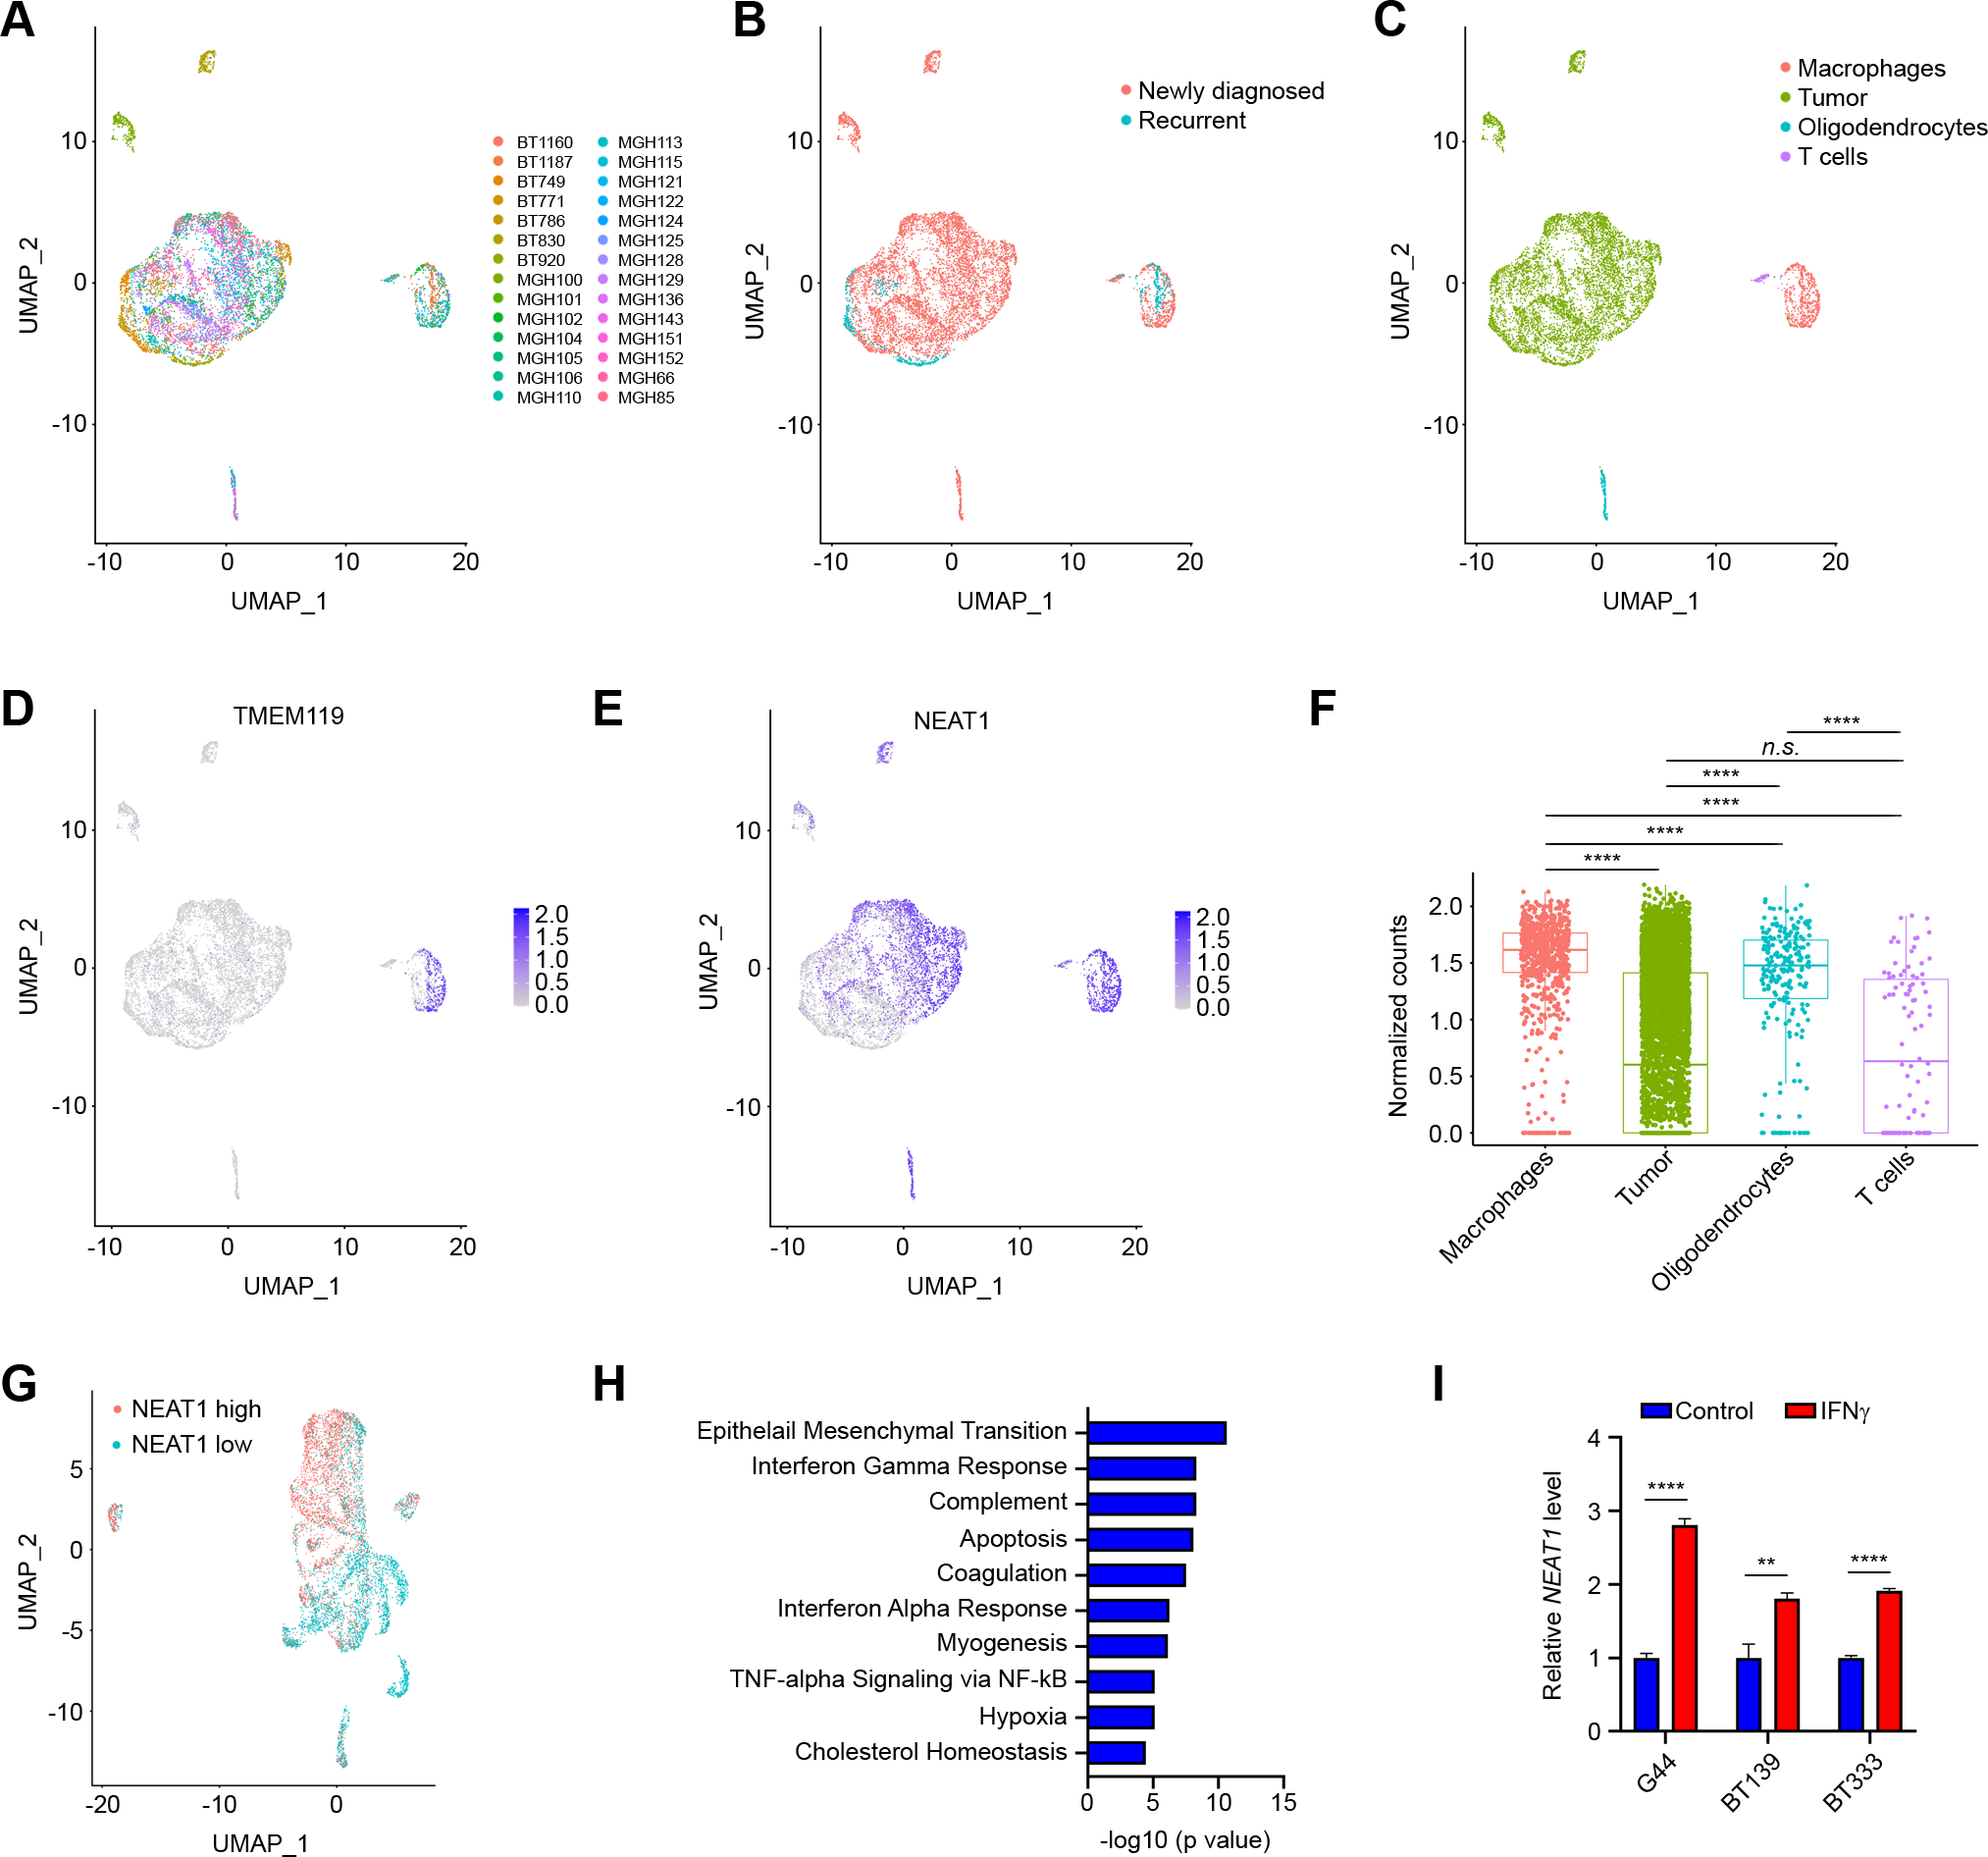
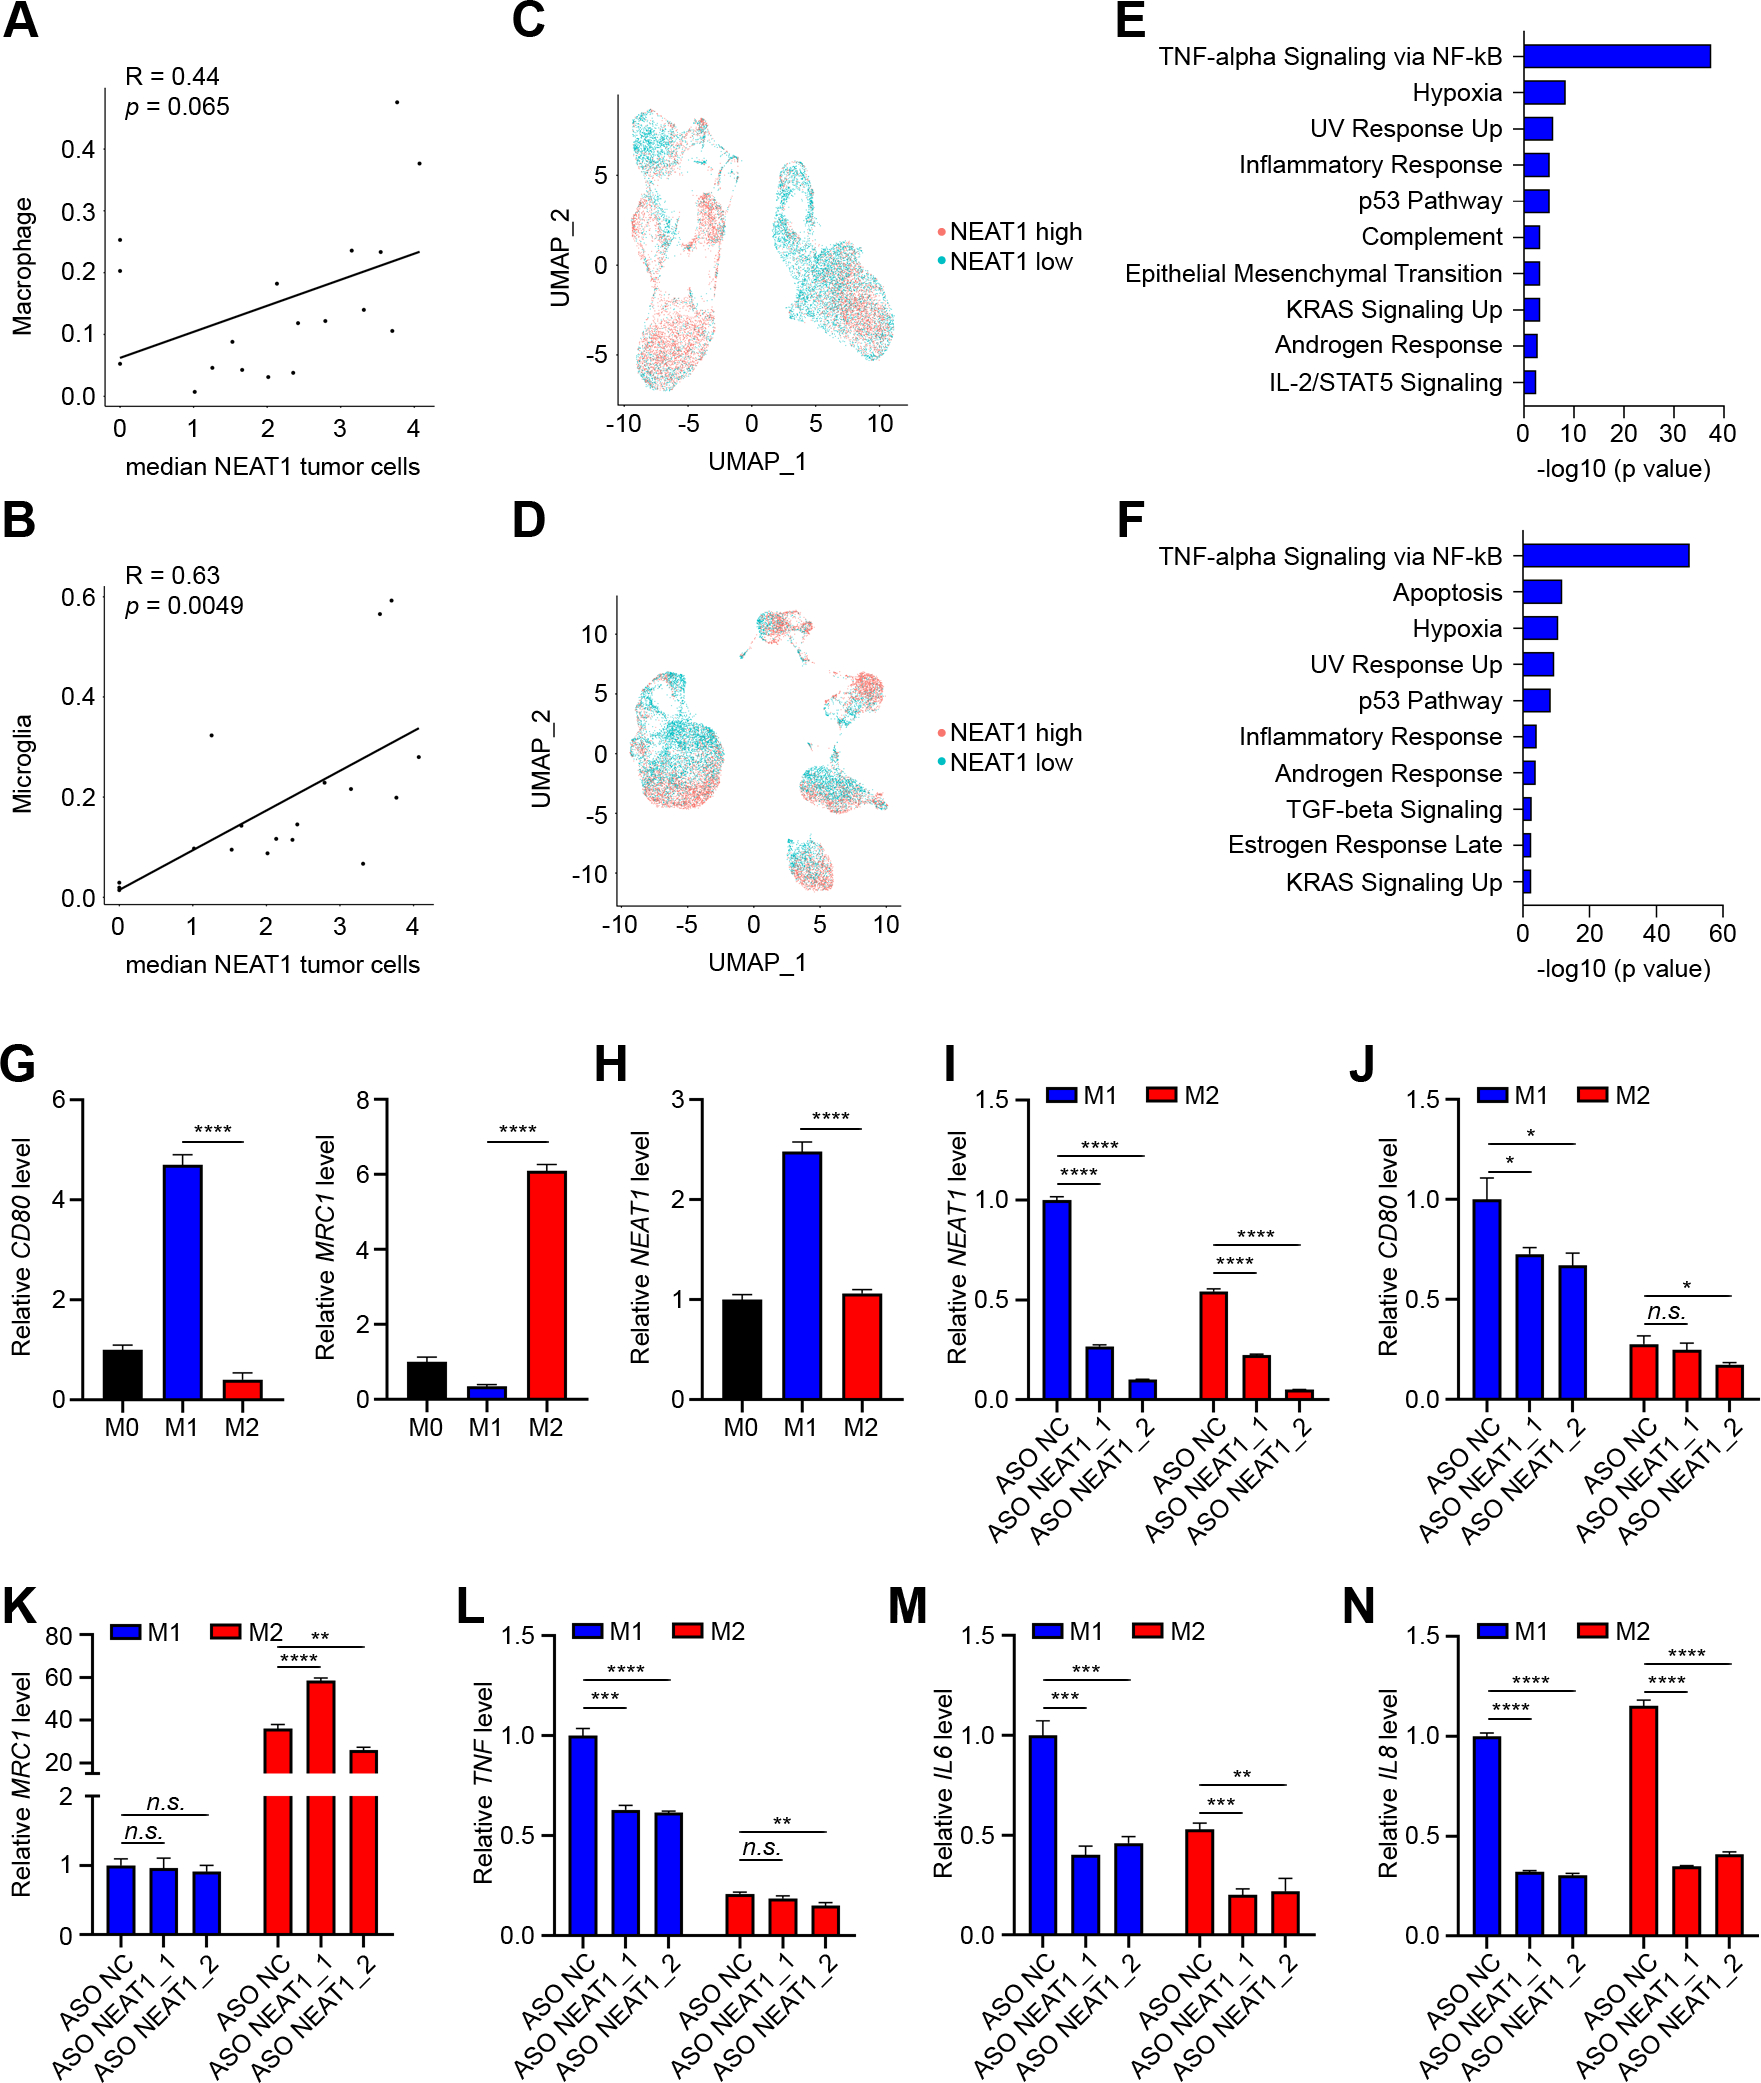
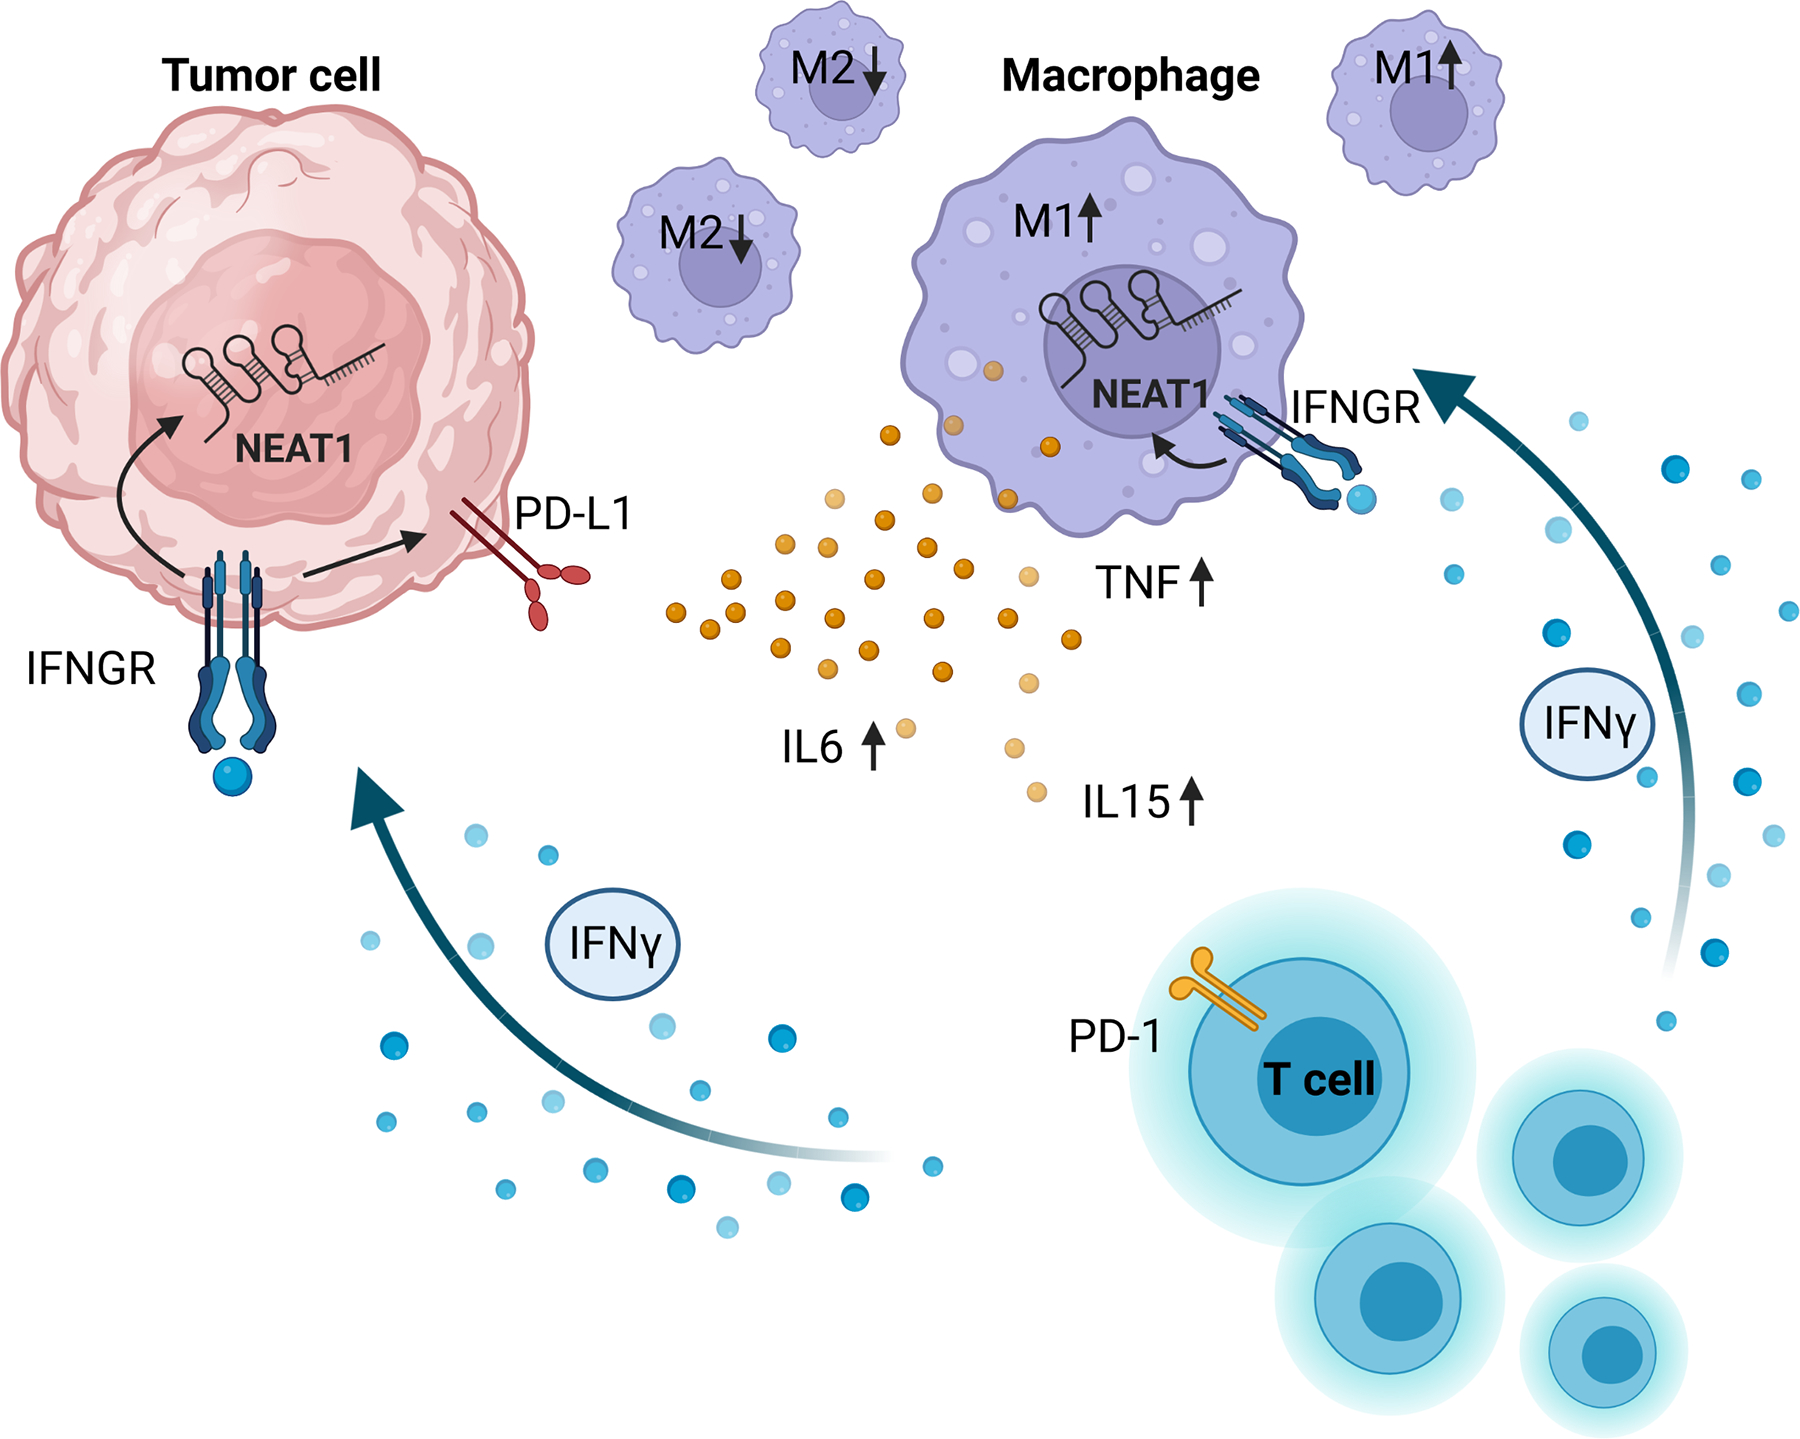
Results: We identified the lncRNA NEAT1 as commonly upregulated between patients with melanoma with complete therapeutic response and patients with GBM with longer survival following anti-PD-1/PD-L1 treatment. Gene set enrichment analyses revealed that NEAT1 expression was strongly associated with the IFNγ pathways, along with downregulation of cell-cycle-related genes. Single-cell RNA-sequencing analyses revealed NEAT1 expression across multiple cell types within the GBM microenvironment, including tumor cells, macrophages, and T cells. High NEAT1 expression levels in tumor cells correlated with increased infiltrating macrophages and microglia. In these tumor-infiltrating myeloid cells, we found that NEAT1 expression was linked to enrichment in TNFα/NFκB signaling pathway genes. Silencing NEAT1 suppressed M1 macrophage polarization and reduced the expression of TNFα and other inflammatory cytokines.

Conclusions: These findings suggest an association between NEAT1 expression and patient response to anti-PD-1/PD-L1 therapy in melanoma and GBM and have important implications for the role of lncRNAs in the tumor microenvironment.


Conflict of interest statement

Conflict of interest:

Marco Mineo and E. Antonio Chiocca are inventors on a patent application covering the use of NEAT1 as a method for predicting treatment outcome to checkpoint inhibitors in cancer.

Figures

Figure 1
Figure 1
NEAT1 expression levels are associated with patient response to immune checkpoint blockade in melanoma. A, Heat map of the supervised hierarchical clustering analysis of the 104 lncRNAs differentially expressed (RNA-seq) between metastatic melanoma patients with complete response to pembrolizumab compared to patients with progressive disease (FDR < 0.05). B, Expression levels in average transcripts per million (TPM) across patients of the top ten most expressed lncRNAs in melanoma. C, Pre-treatment levels of NEAT1 (normalized counts) in melanoma patients with complete response (n = 5), partial response (n = 10), or progressive disease (n = 13). Data were analyzed by Wilcoxon test: ****p < 0.0001. D and E, Enrichment plots for the most enriched gene set in the NEAT1-high tumors (n = 14) (D) and most enriched gene set in the NEAT1-low tumors (n = 14) (E) from the GSEA Hallmark analysis.
Figure 2
Figure 2
NEAT1 expression is associated with prolonged survival in glioblastoma patients treated with immune checkpoint blockade. A, Glioblastoma patients of the adjuvant pembrolizumab group were divided based on median OS (6.3 months) in long-term survivors (blue, n = 7) and short-term survivors (red, n = 6). Of the 104 lncRNAs identified in the melanoma dataset, 7 lncRNAs were found deregulated in GBM long-term survivors compared to short-term survivors. Data were analyzed by Wald test: ** p < 0.01. B, Kaplan-Meier survival analysis for overall survival in NEAT1-high (blue, n =12) and NEAT1-low (red, n = 12) GBM patients from the adjuvant and neoadjuvant pembrolizumab. Median overall survival for patients with high NEAT1 levels was 13.3 months, whereas median overall survival for patients with low NEAT1 levels was 5.9 months (hazard ratio 0.3094; p = 0.0065). C, Forest plot of multivariable Cox Proportional-Hazard regression analysis. NEAT1 and multiple clinical features were used to analyze whether NEAT1 was an independent prognostic factor for GBM. D, GSEA Hallmark analysis of enriched gene sets in NEAT1-high GBM tumors compared to NEAT1-low GBM tumors (FDR q-value < 0.1). GBM patients from the adjuvant and neoadjuvant pembrolizumab were analyzed together. A positive Normalized Enrichment Score (NES) value indicates enrichment in the NEAT1-high tumors, a negative NES indicates enrichment in the NEAT1-low tumors.
Figure 3
Figure 3
High NEAT1 levels in glioblastoma patients are associated with longer survival on immune checkpoint blockade and IFNγ signaling. A, NEAT1 expression (normalized counts) in long-term (blue, n = 9) and short-term (red, n = 9) survivors among GBM patients treated with adjuvant ICB therapy. Patients were divided in two groups based on median OS (14.8 months). Data were analyzed by Wald test: * p < 0.05. B, Forest plot of multivariable Cox proportional hazard regression analysis. NEAT1 and multiple GBM features were used to analyze whether NEAT1 was an independent prognostic factor for GBM. C, Heat map of the supervised hierarchical clustering analysis of IFNγ-related genes significantly deregulated (p < 0.05) between NEAT1 high GBM tumors (green) and NEAT1 low GBM tumors (red). Patients were divided by median NEAT1 expression.
Figure 4
Figure 4
NEAT1 is expressed across the GBM tumor microenvironment. A, Uniform manifold approximation and projection (UMAP) visualization of 28 GBM patients colored based on patient ID (n = 7,930). B, UMAP visualization of single cells colored based on tumor type: newly diagnosed (red) and recurrent (blue). C, UMAP visualization of single cells colored based on the expression of marker genes for macrophages (red), tumor cells (green), oligodendrocytes (blue), or T cells (purple). D, UMAP visualization of TMEM119 expression in single cells. E, UMAP visualization of NEAT1 expression in single cells. F, Box plot of NEAT1 expression (normalized counts) between macrophages (red), tumor cells (green), oligodendrocytes (blue), or T cells (purple). Data were analyzed by Wilcoxon test: n.s. (non-significant), ****p < 0.0001. G, UMAP visualization of NEAT1-low (red) and NEAT1-high (blue) GBM cancer cells (n = 6,859). H, Analysis of pathways enriched in NEAT1-high GBM cancer cells. I, qRT-PCR analysis of NEAT1 expression in 3 unstimulated or IFNγ-stimulated (100 U/ml for 24 h) patient-derived GBM cell lines. Data were analyzed by unpaired t-test: **p < 0.01, ****p < 0.0001.
Figure 5
Figure 5
NEAT1 is differentially expressed between GBM tumor-associated macrophage subpopulations. A and B, Correlation of tumoral NEAT1 expression with number (as fraction of total cells in the sample) of macrophages (A) and microglia (B) infiltrates in recurrent GBMs. C and D, UMAP visualization of NEAT1-high (red) and NEAT1-low (blue) macrophages (n = 14,994 cells) (C) and microglia (n = 15,730 cells) (D) TAMs in recurrent GBMs. E and F, Analysis of pathways enriched in NEAT1-high macrophages (E) and microglia (F) TAMs in recurrent GBMs. G, qRT-PCR analysis of CD80 (left) and MRC1 (right) expression in THP-1 monocytic cells stimulated with PMA (M0 macrophages) and then polarized to M1 macrophages by stimulation with IFNγ and LPS or polarized to M2 by stimulation with IL4. H, qRT-PCR analysis of NEAT1 expression in M0, M1, and M2 differentiated macrophages. I-N, qRT-PCR analysis of NEAT1 (I), CD80 (J) MRC1 (K), TNF (L), IL6 (M), and IL8 (N) expression in M1 and M2 differentiated THP-1 macrophages transfected with LNA antisense oligonucleotide negative control (ASO NC) or two different LNA antisense oligonucleotides targeting NEAT1 (ASO NEAT1_1 and ASO NEAT1_2). Data were analyzed by unpaired t-test: n.s. (non-significant), *p < 0.05, **p < 0.01, ***p < 0.001, ****p < 0.0001.
Figure 6
Figure 6
Proposed mechanism of NEAT1 expression in the tumor microenvironment. T cells infiltrating the tumor microenvironment secrete IFNγ, which will stimulate the expression of NEAT1 in tumor cells and tumor associated macrophages. Increased expression of NEAT1 in macrophages promotes M1-like polarization and secretion of inflammatory cytokines.

Similar articles

Cited by

References

    1. Lamba N, Ott PA, Iorgulescu JB. Use of First-Line Immune Checkpoint Inhibitors and Association With Overall Survival Among Patients With Metastatic Melanoma in the Anti-PD-1 Era. JAMA Netw Open 2022;5:e2225459. - PMC - PubMed
    1. Beatty GL, Gladney WL. Immune escape mechanisms as a guide for cancer immunotherapy. Clin Cancer Res 2015;21:687–92 - PMC - PubMed
    1. Ribas A Adaptive Immune Resistance: How Cancer Protects from Immune Attack. Cancer Discov 2015;5:915–9 - PMC - PubMed
    1. Topalian SL, Hodi FS, Brahmer JR, Gettinger SN, Smith DC, McDermott DF, et al. Safety, activity, and immune correlates of anti-PD-1 antibody in cancer. N Engl J Med 2012;366:2443–54 - PMC - PubMed
    1. Haslam A, Gill J, Prasad V. Estimation of the Percentage of US Patients With Cancer Who Are Eligible for Immune Checkpoint Inhibitor Drugs. JAMA Netw Open 2020;3:e200423. - PMC - PubMed

Publication types