. 2023 Apr 13;21(4):e3002030.
doi: 10.1371/journal.pbio.3002030. eCollection 2023 Apr.

The active zone protein Clarinet regulates synaptic sorting of ATG-9 and presynaptic autophagy

Affiliations

The active zone protein Clarinet regulates synaptic sorting of ATG-9 and presynaptic autophagy

Zhao Xuan et al. PLoS Biol. .

Abstract

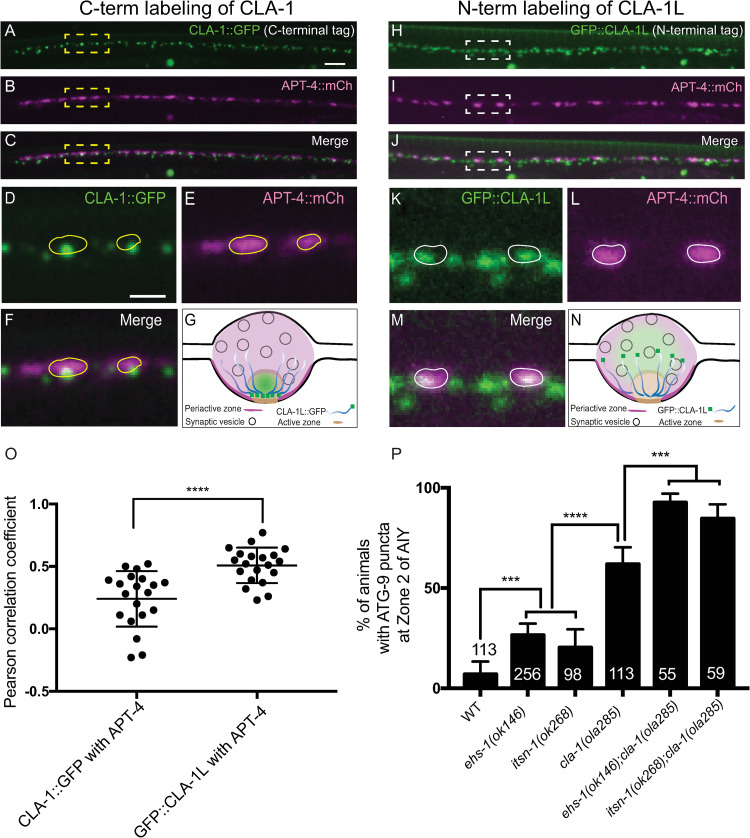
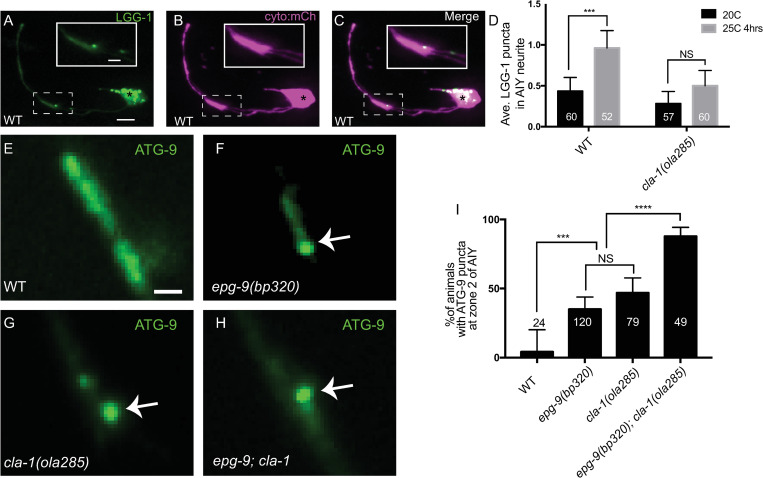
Autophagy is essential for cellular homeostasis and function. In neurons, autophagosome biogenesis is temporally and spatially regulated to occur near presynaptic sites, in part via the trafficking of autophagy transmembrane protein ATG-9. The molecules that regulate autophagy by sorting ATG-9 at synapses remain largely unknown. Here, we conduct forward genetic screens at single synapses of C. elegans neurons and identify a role for the long isoform of the active zone protein Clarinet (CLA-1L) in regulating sorting of autophagy protein ATG-9 at synapses, and presynaptic autophagy. We determine that disrupting CLA-1L results in abnormal accumulation of ATG-9 containing vesicles enriched with clathrin. The ATG-9 phenotype in cla-1(L) mutants is not observed for other synaptic vesicle proteins, suggesting distinct mechanisms that regulate sorting of ATG-9-containing vesicles and synaptic vesicles. Through genetic analyses, we uncover the adaptor protein complexes that genetically interact with CLA-1 in ATG-9 sorting. We also determine that CLA-1L extends from the active zone to the periactive zone and genetically interacts with periactive zone proteins in ATG-9 sorting. Our findings reveal novel roles for active zone proteins in the sorting of ATG-9 and in presynaptic autophagy.


Conflict of interest statement

The authors have declared that no competing interests exist.

Figures

Fig 1
Fig 1. The long isoform of Clarinet (CLA-1L) regulates ATG-9 trafficking at presynaptic sites.
(A) Schematic of the head of C. elegans, including pharynx (grey region) and the 2 bilaterally symmetric AIY interneurons. The asterisk denotes the cell body. There are 3 distinct segments along the AIY neurite: an asynaptic region proximal to AIY cell body (Zone 1), a large presynaptic region (Zone 2), and a segment with discrete presynaptic clusters at the distal part of the neurite (Zone 3) [30,31]. Presynaptic regions (Zone 2 and Zone 3) are in magenta (AIYL) or violet (AIYR). In axis, A, anterior; P, posterior; L, left; R, right; D, dorsal; V, ventral. (B-D) Distribution of ATG-9::GFP (B) and synaptic vesicle protein (mCherry::RAB-3, pseudo-colored magenta) (C) in the synaptic regions of AIY (merge in D). The dashed box encloses AIY Zone 2. (E-J) Distribution of ATG-9::GFP (E and H) and synaptic vesicle protein (mCherry::RAB-3, pseudo-colored magenta) (F and I) at Zone 2 of AIY (merge in G and J) in wild-type (WT) (E-G) and ola285 mutant (H-J) animals. ATG-9 is evenly distributed in WT but forms subsynaptic foci in ola285 mutants, which are not enriched with RAB-3 (indicated by arrows in H-J). (K) Schematic of the genomic region of cla-1L. The locations of loxP sites and the genetic lesions of the cla-1 alleles examined in this study are indicated. The genetic lesion in allele ola285 (I to N at residue 5753) is shown for both WT and ola285 mutants. The positions of the repetitive region in CLA-1L and the conserved PDZ and C2 domains in all CLA-1 isoforms are also shown in the schematic. (L) Quantification of the index of ATG-9 punctum (ΔF/F; see Methods) at Zone 2 of AIY in wild-type (WT), cla-1(ola285), and cla-1(ok560) mutants. Error bars show standard deviation (SD). “NS” (not significant), *p < 0.05 by ordinary one-way ANOVA with Tukey’s multiple comparisons test. Each dot in the scatter plot represents a single animal. (M) Quantification of the percentage of animals displaying ATG-9 subsynaptic foci at AIY Zone 2 in the indicated genotypes. Error bars represent 95% confidence interval. “NS” (not significant), ****p < 0.0001 by two-tailed Fisher’s exact test. The number on the bars indicates the number of animals scored. (N, O) Endogenous expression of GFP::CLA-1L (WT) (N) and GFP::CLA-1L (I5753N) (O) in the C. elegans nerve ring. (P-S) Distribution of ATG-9::GFP at Zone 2 of AIY in wild-type (WT) (P), floxed cla-1L without Cre (Q), and floxed cla-1L with Cre expressed cell specifically in AIY (R) and cla-1(ok560) (S) animals. Arrows (in R and S) indicate abnormal ATG-9 foci. Scale bar (in B for B-D), 5 μm; (in E for E-J and P-S), 1 μm; (in N for N-O), 10 μm. Data for Fig 1L and 1M can be found in S1 Data.
Fig 2
Fig 2. ATG-9 and synaptic vesicle proteins are differentially regulated by CLA-1L.
(A-H) Distribution of SNG-1::BFP (pseudo-colored cyan) (A and E), mCherry::RAB-3 (pseudo-colored magenta) (B and F), and ATG-9::GFP (C and G) at Zone 2 of AIY (merge in D and H) in wild-type (WT) (A-D) and cla-1(ola285) mutant (E-H) animals. While we observe a phenotype for abnormal ATG-9 distribution to subsynaptic foci in cla-1(ola285) mutants (indicated by arrows in G and H), we do not see a similar redistribution for synaptic vesicle proteins SNG-1 and RAB-3. (I, J) Electron microscopy of the Zone 2 region in wild-type (I) and cla-1(ola285) mutant animals (J). Blue lines, outline of AIY Zone 2. Presynaptic dense projections, pointed with arrows in dark blue. “m”, mitochondria. (K, L) Electron micrograph reconstructions of AIY Zone 2 in wild-type (K) and cla-1(ola285) mutant animals (L). The active zones (or dense projections) are highlighted in red. Synaptic vesicles and dense core vesicles are symbolized by yellow and blue spheres, respectively. In axis: A, anterior; P, posterior; L, left; R, right; D, dorsal; V, ventral. (M) Measurement of the length of the active zone (highlighted in red in K and L) in the AIY neurons of 3 wild-type and 3 cla-1(ola285) mutants. Error bars represent standard deviation (SD). “NS” (not significant) by two-tailed Fisher’s exact test. Each dot in the scatter plot represents a single neuron. (N) Quantification of synaptic vesicles in the AIY neurons (AIY-L: AIY on the left side; AIY-R: AIY on the right side) of 1 wild-type and 1 cla-1(ola285) mutant. The differences in AIYR (observed in this figure for cla-1(ola285) mutants, also in S3 for endosomal area in wild type) are consistent with previous findings about asymmetry of AIY neurons [31], including gene expression [114]. Nonetheless, unlike for other examined genotypes by EM (like UNC-26/Synaptojanin) [24], the observed phenotypes do not reveal major differences that could account for the observed light microscopy phenotypes of ATG-9. Error bars represent standard deviation (SD). ***p < 0.001 by ordinary one-way ANOVA with Tukey’s multiple comparisons test. Each dot in the scatter plot represents a single section. Scale bar (in A for A-H), 1 μm; (in I for I and J), 500 nm. Data for Fig 2M and 2N can be found in S1 Data.
Fig 3
Fig 3. ATG-9-containing vesicles cluster at subsynaptic domains in cla-1(ola285) mutants.
(A, B) Immunogold electron microscopy at Zone 2 of AIY neurons in wild-type (A) and cla-1(ola285) mutant (B) transgenic animals, with ATG-9::GFP panneuronally expressed and antibodies directed against GFP [24]. Blue line outlines the AIY Zone 2 region; dark blue arrows point at presynaptic dense projections. “m”, mitochondria. Insets at the upper right hand corner correspond to higher magnifications of the regions highlighted with purple squares, with red arrows pointing to a representative immunogold particle detecting ATG-9::GFP in vesicular structures. (C, D) Electron micrograph reconstructions of Zone 2 of AIY and ATG-9::GFP immunogold particles in wild-type (C) and cla-1(ola285) mutant animals (D). Red dots: ATG-9::GFP immunogold particles. In axis: A, anterior; P, posterior; L, left; R, right; D, dorsal; V, ventral. (E) Distribution of ATG-9 immunogold particles density per cross-section in wild-type (blue line and round dots) and cla-1(ola285) mutant animals (orange line and square dots). X axis, Z slices at Zone 2 along the antero-posterior axis. Scale bar (in A for A and B), 500 nm; (in insert of A for inserts of A and B), 100 nm. Data for Fig 3E can be found in S1 Data.
Fig 4
Fig 4. ATG-9 foci in cla-1(ola285) mutants are suppressed by mutants for synaptic vesicle exocytosis.
(A) Schematic of the proteins required for the synaptic vesicle cycle and associated with this study (both the names used for C. elegans and vertebrates are listed). (B-I) Distribution of ATG-9::GFP at Zone 2 of AIY in wild-type (WT) (B), cla-1(ola285) (C), unc-13(s69) (D), unc-13(s69);cla-1(ola285) (E), unc-10 (md1117) (F), unc-10(md1117);cla-1(ola285) (G), unc-18(e81) (H), and unc-18(e81);cla-1(ola285) (I) animals. ATG-9 subsynaptic foci are indicated by the arrow (in C). (J) Quantification of the percentage of animals displaying ATG-9 subsynaptic foci at AIY Zone 2 in the indicated genotypes. The data used to quantify the percentage of animals displaying ATG-9 subsynaptic foci in wild type are the same as those in Fig 1M (explained in Methods). Error bars represent 95% confidence interval. ****p < 0.0001 by two-tailed Fisher’s exact test. The number on the bars indicates the number of animals scored. (K) Quantification of the index of ATG-9 punctum (ΔF/F) at Zone 2 of AIY in the indicated genotypes. The data used to quantify the index of ATG-9 punctum (ΔF/F) in wild-type and cla-1(ola285) mutants are the same as those in Fig 1L (explained in Methods). Error bars show standard deviation (SD). ****p < 0.0001 by ordinary one-way ANOVA with Tukey’s multiple comparisons test. Each dot in the scatter plot represents a single animal. Scale bar (in B for B-I and J-Q), 1 μm. Data for Fig 4J and 4K can be found in S1 Data.
Fig 5
Fig 5. The clathrin-associated adaptor complexes, AP-2 and AP180, regulate ATG-9 trafficking at presynaptic sites.
(A-D) Distribution of ATG-9::GFP (C), BFP::CHC-1 (pseudo-colored cyan) (D), and mCherry::RAB-3 (pseudo-colored magenta) (E) at Zone 2 of AIY (merge in F) in wild-type (WT) animals. (E-H) Distribution of ATG-9::GFP (A), BFP::CHC-1 (pseudo-colored cyan) (B), and mCherry::RAB-3 (pseudo-colored magenta) (C) at Zone 2 of AIY (merge in D) in cla-1(ola285) mutant animals. ATG-9 subsynaptic foci are enriched with CHC-1 in cla-1(ola285) mutants (indicated by arrows in A, B, and D). (I-L) Distribution of ATG-9::GFP at Zone 2 of AIY in wild-type (WT) (E), unc-11(e47)/AP180 (F), dpy-23(e840)/AP2μ (G), and dpy-23(e840);cla-1(ola285) (H) mutant animals. Abnormal ATG-9 subsynaptic foci are indicated by arrows in F-H. (M) Quantification of the percentage of animals displaying ATG-9 subsynaptic foci at AIY Zone 2 for the indicated genotypes. The data used to quantify the percentage of animals displaying ATG-9 subsynaptic foci in wild-type and cla-1(ola285) mutants are the same as those in Fig 4J (explained in Methods). Error bars represent 95% confidence interval. ****p < 0.0001 by two-tailed Fisher’s exact test. The number on the bars indicates the number of animals scored. (N) Quantification of the index of ATG-9 punctum (ΔF/F) at Zone 2 of AIY for the indicated genotypes. The data used to quantify the index of ATG-9 punctum (ΔF/F) in wild-type and cla-1(ola285) mutants are the same as those in Fig 1L (explained in Methods). Error bars show standard deviation (SD). “NS” (not significant), **p < 0.01 by ordinary one-way ANOVA with Tukey’s multiple comparisons test. Each dot in the scatter plot represents a single animal. Scale bar (in A for A-L), 1 μm. Data for Fig 5M and 5N can be found in S1 Data.
Fig 6
Fig 6. SDPN-1/syndapin 1 regulates ATG-9 sorting at presynaptic sites.
(A-F) Distribution of ATG-9::GFP at Zone 2 of AIY in wild-type (WT) (A), sdpn-1(ok1667) (B), cla-1(ola285) (C), sdpn-1(ok1667);cla-1(ola285) (D), unc-11(e47)/AP180 (E), and sdpn-1(ok1667);unc-11(e47) (F) mutant animals. Abnormal ATG-9 subsynaptic foci are indicated by arrows in C and E. Note that mutations in SDPN-1/syndapin 1 suppress the abnormal ATG-9 phenotypes in cla-1 and unc-11/AP180 mutants. (G) Quantification of the percentage of animals displaying abnormal ATG-9 subsynaptic foci at AIY Zone 2 for the indicated genotypes. The data used to quantify the percentage of animals displaying ATG-9 subsynaptic foci in wild-type and cla-1(ola285) mutants are the same as those in Fig 4J; the data used in unc-11(e47) are the same as those in Fig 5M (explained in Methods). Error bars represent 95% confidence interval. “NS” (not significant), ****p < 0.0001 by two-tailed Fisher’s exact test. The number on the bars indicates the number of animals scored. (H) Quantification of the index of ATG-9 punctum (ΔF/F) at Zone 2 of AIY for the indicated genotypes. The data used to quantify the index of ATG-9 punctum (ΔF/F) in wild-type and cla-1(ola285) mutants are the same as those in Fig 1L; the data used in unc-11(e47) are the same as those in Fig 5N (explained in Methods). Error bars show standard deviation (SD). “NS” (not significant), *p < 0.05, **p < 0.01, ***p < 0.001 by ordinary one-way ANOVA with Tukey’s multiple comparisons test. Each dot in the scatter plot represents a single animal. Scale bar (in A for A-F), 1 μm. Data for Fig 6G and 6H can be found in S1 Data.
Fig 7
Fig 7. ATG-9 is sorted to the endocytic intermediates via the AP-1 adaptor complex.
(A-H) Distribution of ATG-9::GFP at Zone 2 of AIY in wild-type (WT) (A), cla-1(ola285) (B), unc-101(m1)/AP-1μ1 (C), unc-101(m1);cla-1(ola285) (D), unc-101;cla-1 mutants with C. elegans UNC-101/AP-1μ1 cDNA cell specifically expressed in AIY (E), unc-101;cla-1 mutants with mouse AP1μ1 cDNA cell specifically expressed in AIY (F), unc-11(e47)/AP180 (G), and unc-101(m1);unc-11(e47) (H). Abnormal ATG-9 subsynaptic foci are indicated by arrows in B and E-G. (I) Quantification of the index of ATG-9 punctum (ΔF/F) at Zone 2 of AIY for indicated genotypes. The data used to quantify the index of ATG-9 punctum (ΔF/F) in wild-type and cla-1(ola285) mutants are the same as those in Fig 1L; the data used in unc-11(e47) are the same as those in Fig 5N (explained in Methods). Error bars show standard deviation (SD). “NS” (not significant), *p < 0.05 by ordinary one-way ANOVA with Tukey’s multiple comparisons test. Each dot in the scatter plot represents a single animal. Scale bar (in A for A-H), 1 μm. Data for Fig 7I can be found in S1 Data.
Fig 8
Fig 8. CLA-1L genetically interacts with endocytic proteins at the periactive zone to regulate ATG-9 trafficking.
(A-C) Distribution of endogenous C-terminally tagged CLA-1::GFP (A) and the endocytic zone marker APT-4/APA-2/AP-2α::mCherry (APT-4::mCh, pseudo-colored magenta) (B) in the neurons of the posterior dorsal nerve cord (merge in C) in wild-type animals. Note that APT-4::mCh is expressed in a subset of neurons in the dorsal nerve cord, driven by the punc-129 promoter, while CLA-1::GFP and GFP::CLA-1 are expressed panneuronally (so green puncta can be present where there are no magenta puncta; see Methods). (D-F) Enlarged regions enclosed in dashed boxes in A-C. Endogenous C-terminally tagged CLA-1::GFP (D) localizes to small puncta corresponding to the active zone [25], and different from the pattern observed for periactive zone protein, APT-4::mCh (E, merge in F). Yellow circles are drawn based on the outline of APT-4::mCh puncta in E and are located at the same positions in D-F. (G) Schematic of the localization of the C-terminally tagged CLA-1::GFP, relative to the subsynaptic active and periactive zones. (H-J) Distribution of endogenous N-terminally tagged GFP::CLA-1L (H) and the endocytic zone marker APT-4/APA-2/AP-2α::mCherry (APT-4::mCh, pseudo-colored magenta) (I) in neurons of the posterior dorsal nerve cord (merge in J) in wild-type animals. (K-M) Enlarged regions enclosed in dashed boxes in H-J. Endogenous N-terminally tagged GFP::CLA-1L (K) displays a more distributed synaptic distribution as compared to the C-terminally tagged CLA-1:GFP (compare with A, D, and F; see also [25]) and colocalizes with APT-4::mCh (L, merge in M). White circles are drawn based on the outline of APT-4::mCh puncta in L and are located at the same positions in K-M. (N) Schematic of the localization of the N-terminally tagged GFP::CLA-1L, relative to the subsynaptic active and periactive zones. (O) Pearson correlation coefficient for colocalization between CLA-1::GFP and APT-4::mCh, or between GFP::CLA-1L and APT-4::mCh, both in wild-type animals. Error bars show standard deviation (SD). ****p < 0.0001 by two-tailed unpaired Student t test. Each dot in the scatter plot represents a single animal. (P) Quantification of the percentage of animals displaying ATG-9 subsynaptic foci at AIY Zone 2 in the indicated genotypes. The data used to quantify the percentage of animals displaying ATG-9 subsynaptic foci in wild-type and cla-1(ola285) mutants are the same as those in Fig 4J (explained in Methods). Error bars represent 95% confidence interval. ***p < 0.001, ****p < 0.0001 by two-tailed Fisher’s exact test. The number on the bars indicates the number of animals scored. Scale bar (in A for A-C and H-J), 5 μm; (in D for D-F and K-M), 2 μm. Data for Fig 8O and 8P can be found in S1 Data.
Fig 9
Fig 9. Disrupted ATG-9 sorting in cla-1(L) mutants is associated with a deficit in activity-induced autophagosome formation.
(A-C) Confocal micrographs of GFP::LGG-1 (A) and cytoplasmic mCherry (cyto::mCh) (pseudo-colored magenta, B) in AIY (merge in C). Inset is the enlarged region enclosed in dashed box to show one LGG-1 punctum in AIY synaptic Zone 2. (D) Quantification of the average number of LGG-1 puncta in the AIY neurites at 20°C and at 25°C for 4 h in wild-type (WT) and cla-1(ola285) mutants. (Note: The activity state of the thermotaxis interneurons AIY is reported to increase when animals are cultivated at 25°C for 4 h, compared to animals at 20°C [80,115,116]. Error bars represent 95% confidence interval. “NS” (not significant), ***p < 0.001 by Kruskal–Wallis test with Dunn’s multiple comparisons test. The number on the bars indicates the number of animals scored. (E-H) Distribution of ATG-9::GFP at Zone 2 of AIY in wild-type (E), epg-9(bp320) (F), cla-1(ola285) (G), and epg-9(bp320); cla-1(ola285) (H) mutant animals. Arrows (in F-H) indicate abnormal ATG-9 foci. (I) Quantification of the percentage of animals displaying ATG-9 subsynaptic foci at AIY Zone 2 in the indicated genotypes. Error bars represent 95% confidence interval. “NS” (not significant), ***p < 0.001, ****p < 0.0001 by two-tailed Fisher’s exact test. The number on the bar indicates the number of animals scored. Scale bar (in A for A-C), 5 μm; (in inset of A for inset of A-C), 2 μm; (in E for E-H), 1 μm. Data for Fig 9D and 9I can be found in S1 Data.
Fig 10
Fig 10. Cartoon diagram representing the genetic relationships between ATG-9 trafficking, the synaptic vesicle cycle, and synaptic autophagy.
At Zone 2 of AIY, both synaptic vesicles and ATG-9 vesicles undergo exo-endocytosis [24]. Our data are consistent with ATG-9 undergoing distinct sorting pathways and displaying distinct phenotypes than those seen for synaptic vesicle proteins. We propose a model whereby ATG-9 is sorted by the adaptor complex AP1 to intracellular endocytic intermediates (symbolized here by “ATG-9 vesicle cluster”). CLA-1L, together with presynaptic endocytic proteins that reside in the periactive zone, such as EHS-1 and ITSN-1, as well as the adaptor complexes such as AP-2 and AP180, are necessary for sorting of ATG-9 from endocytic intermediates. Mutations in the active zone gene cla-1L result in abnormal accumulation of ATG-9 into endocytic intermediates and defects in activity-dependent autophagosome formation.

Similar articles

Cited by

References

    1. Liang Y, Sigrist S. Autophagy and proteostasis in the control of synapse aging and disease. Curr Opin Neurobiol. 2018;48:113–121. Epub 2017/12/25. doi: 10.1016/j.conb.2017.12.006 . - DOI - PubMed
    1. Menzies FM, Fleming A, Caricasole A, Bento CF, Andrews SP, Ashkenazi A, et al. Autophagy and Neurodegeneration: Pathogenic Mechanisms and Therapeutic Opportunities. Neuron. 2017;93(5):1015–1034. Epub 2017/03/11. doi: 10.1016/j.neuron.2017.01.022 . - DOI - PubMed
    1. Wang Y, Song M, Song F. Neuronal autophagy and axon degeneration. Cell Mol Life Sci. 2018;75(13):2389–2406. Epub 2018/04/21. doi: 10.1007/s00018-018-2812-1 . - DOI - PMC - PubMed
    1. Luningschror P, Sendtner M. Autophagy in the presynaptic compartment. Curr Opin Neurobiol. 2018;51:80–85. Epub 2018/03/20. doi: 10.1016/j.conb.2018.02.023 . - DOI - PubMed
    1. Vijayan V, Verstreken P. Autophagy in the presynaptic compartment in health and disease. J Cell Biol. 2017;216(7):1895–1906. Epub 2017/05/19. doi: 10.1083/jcb.201611113 ; PubMed Central PMCID: PMC5496617. - DOI - PMC - PubMed

Publication types

Substances