. 2023 Apr 13;18(4):e0284292.
doi: 10.1371/journal.pone.0284292. eCollection 2023.

Mice lacking nucleotide sugar transporter SLC35A3 exhibit lethal chondrodysplasia with vertebral anomalies and impaired glycosaminoglycan biosynthesis

Affiliations

Mice lacking nucleotide sugar transporter SLC35A3 exhibit lethal chondrodysplasia with vertebral anomalies and impaired glycosaminoglycan biosynthesis

Soichiro Saito et al. PLoS One. .

Abstract

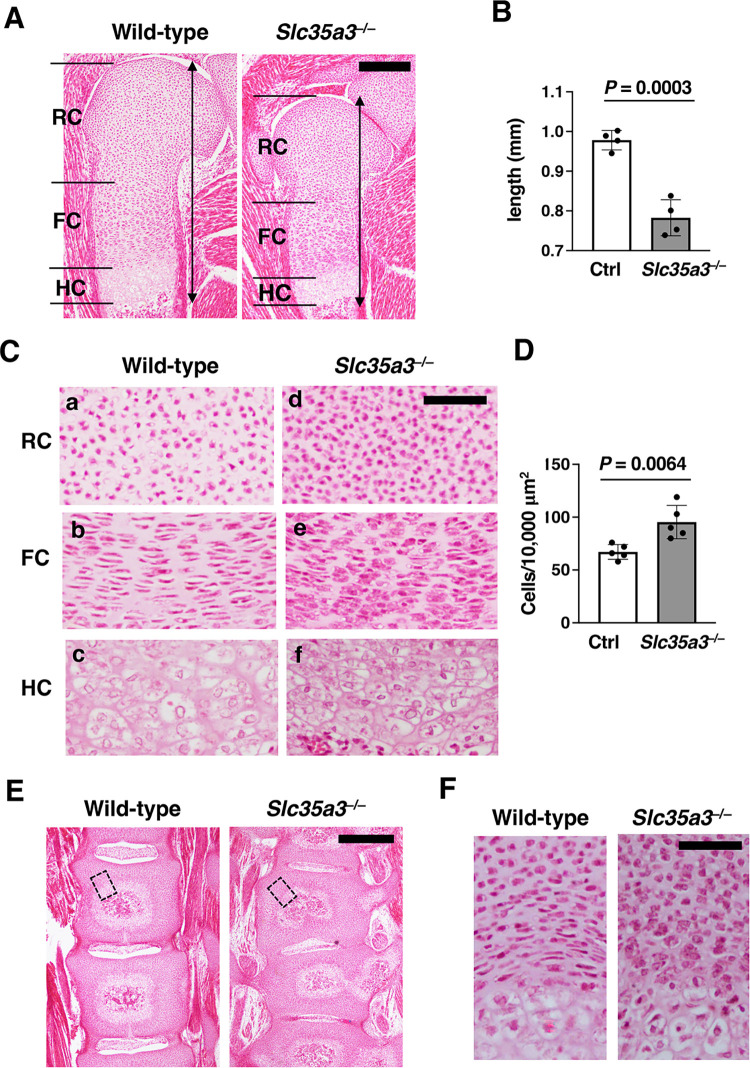
SLC35A3 is considered an uridine diphosphate N-acetylglucosamine (UDP-GlcNAc) transporter in mammals and regulates the branching of N-glycans. A missense mutation in SLC35A3 causes complex vertebral malformation (CVM) in cattle. However, the biological functions of SLC35A3 have not been fully clarified. To address these issues, we have established Slc35a3-/-mice using CRISPR/Cas9 genome editing system. The generated mutant mice were perinatal lethal and exhibited chondrodysplasia recapitulating CVM-like vertebral anomalies. During embryogenesis, Slc35a3 mRNA was expressed in the presomitic mesoderm of wild-type mice, suggesting that SLC35A3 transports UDP-GlcNAc used for the sugar modification that is essential for somite formation. In the growth plate cartilage of Slc35a3-/-embryos, extracellular space was drastically reduced, and many flat proliferative chondrocytes were reshaped. Proliferation, apoptosis and differentiation were not affected in the chondrocytes of Slc35a3-/-mice, suggesting that the chondrodysplasia phenotypes were mainly caused by the abnormal extracellular matrix quality. Because these histological abnormalities were similar to those observed in several mutant mice accompanying the impaired glycosaminoglycan (GAG) biosynthesis, GAG levels were measured in the spine and limbs of Slc35a3-/-mice using disaccharide composition analysis. Compared with control mice, the amounts of heparan sulfate, keratan sulfate, and chondroitin sulfate/dermatan sulfate, were significantly decreased in Slc35a3-/-mice. These findings suggest that SLC35A3 regulates GAG biosynthesis and the chondrodysplasia phenotypes were partially caused by the decreased GAG synthesis. Hence, Slc35a3-/- mice would be a useful model for investigating the in vivo roles of SLC35A3 and the pathological mechanisms of SLC35A3-associated diseases.


Conflict of interest statement

The authors have declared that no competing interests exist.

Figures

Fig 1
Fig 1. Generation of Slc35a3–/–mice using genome editing.
(A) Sequence chromatograms of the edited genomic region in exon 3 of the Slc35a3 gene. A homozygous 17-bp deletion (c.255_271del) leading to frameshift occurred in Slc35a3–/–mice. (B) Agarose gel electrophoresis image of PCR products used for genotyping. +/+: wild-type; +/−: Slc35a3+/; −/−: Slc35a3−/−. Upper band: wild-type allele-specific PCR products; lower band: 17-bp deletion allele-specific PCR products. (C) Gross appearance of wild-type and Slc35a3−/− littermate embryos at E18.5. (D) Relative Slc35a3 mRNA expression in the limbs of wild-type (+/+) and Slc35a3–/–mice (−/−). Data are shown as means ± standard deviation (n = 4). P values were calculated using Student’s t-test. (E) Structural comparison of wild-type and mutant SLC35A3 proteins. The wild-type SLC35A3 protein consists of 327 amino acids with 10 predicted transmembrane domains, whereas the mutant protein consists of 85 SLC35A3-specific amino acids with 2 transmembrane domains and 42 mutant specific amino acids.
Fig 2
Fig 2. Skeletal abnormalities in Slc35a3–/–mice.
Skeletal specimens of control (Ctrl, wild-type + Slc35a3+/–) and Slc35a3–/–littermate embryos at E18.5 were prepared. Calcified tissues were stained red with Alizarin red, and cartilage was stained blue with Alcian blue. (A) Whole skeleton. (B) Skull. (C) hind limb. (D) Lengths of the femur and tibia in Ctrl and Slc35a3–/–littermate embryos were measured. Data are shown as means ± standard deviation (n = 4). P-values were calculated using Student’s t-test. (E) Sternum and ribs. The black arrow indicates delayed fusion of the sternum in Slc35a3–/–mice. (F) Dorsal view of the spine and ribs. Slc35a3−/− mice exhibited severe vertebral and rib anomalies, including fusion and malformations of the thoracic and lumber vertebrae and a reduced number and bifurcation of ribs. Wild-type mice had 13 rib pairs, whereas Slc35a3−/− mice had 11 rib pairs. WT, wild-type.
Fig 3
Fig 3. Slc35a3 mRNA was expressed in the presomitic mesoderm during somite formation.
Whole-mount in situ hybridization images of wild-type mouse embryos at E9.25 (somite 20–22) produced using the antisense (A, B) and the sense (C) probes against Slc35a3 mRNA. Lateral side view (A), and the magnified images of the tail region (B, C). NE: neuroepithelium, PSM: presomatic mesoderm. Scale bars: 500 μm. The same results were obtained from two independent experiments.
Fig 4
Fig 4. Cartilaginous extracellular matrix space was severely reduced in Slc35a3–/–mice.
Humerus and lumbar vertebrae sections of Control (Ctrl, wild-type + Slc35a3+/–) and Slc35a3–/–littermate embryos at E18.5 were stained using hematoxylin and eosin (HE) solution. (A) Low magnification images of the humerus. Black double arrows indicate the length of the distal growth plate. (B) Lengths of the humerus growth plate in the HE-stained sections prepared from Ctrl and Slc35a3–/–embryos were measured. (C) High magnification images of the round chondrocyte (RC), flat chondrocyte (FC), and hypertrophic chondrocyte (HC) zones in the growth plates. (D) Cells were counted in the round chondrocyte zone of HE-stained sections within the squares (100 × 100 μm). (E) Low magnification images of the lumbar vertebrae. (F) High magnification images of the lumbar vertebrae. The boxed regions in (E) are shown at a higher magnification in (F). Data are shown as the means ± standard deviation; n = 4 (B) and 5 (D). P values were calculated using Student’s t-test. Ctrl, control. Scale bars, 200 μm (A, E) and 50 μm (C, F).
Fig 5
Fig 5. Proliferation, apoptosis, and differentiation are not affected in Slc35a3−/− chondrocytes.
(A) BrdU staining of the tibia sections from the BrdU-treated embryos at E18.5. RC, round chondrocyte zone; FC, flat chondrocyte zone. (B) Frequency of BrdU-positive cells in the RC and FC zones. (C) TUNEL staining of the hypertrophic chondrocyte zone in the tibia sections at E18.5. (D) Frequency of TUNEL-positive cells in the hypertrophic chondrocyte zone. (E) HE staining and in situ hybridization (ISH) images, produced using Col2a1 and Col10a1 probes of the tibia sections at E18.5. (F) Heights of Col2a1- and Col10a1-expressing zones (upper graphs), and the relative heights of Col2a1- and Col10a1-expressing zones normalized by the total heights of the growth plate (lower graphs) in the ISH images. Data are shown as the means ± standard deviation; n = 6 (B, D) and 4 (F). Combined values from three (B, D) and two (F) independent sections were compared. Two separate areas were counted in one section (B, D, F). P values were calculated using Student’s t-test. Ctrl, control (wild-type + Slc35a1+/−); N.S., not significant. Scale bars, 200 μm (A, E) and 100 μm (C).
Fig 6
Fig 6. Glycosaminoglycan (GAG) synthesis is impaired in the spine and limbs of Slc35a3–/–mice.
The amounts of chondroitin sulfate /dermatan sulfate (CS/DS) (A), heparan sulfate (HS) (B), keratan sulfate (KS) (C), and hyaluronan (HA) (D) in the spine and limbs of control (Ctrl, wild-type + Slc35a3+/–) and Slc35a3−/− mice were measured using a combination of enzymatic treatment and anion-exchange HPLC. The GAG fractions prepared from the spine and limbs were individually digested using a mixture of chondroitinases ABC and chondroitinase AC-II, heparinase-I, heparitinase-II, and heparinase-III, or keratanase-II for the specific analyses of CS/DS/HA, HS, or KS, respectively, and each digest was labeled with 2-aminobenzamide (2AB) and analyzed using anion-exchange HPLC (S1–S3 Figs). Amounts of the resultant disaccharides in each sample were calculated based on the peak area in each chromatogram. Data are shown as means ± standard deviation; n = 7 (Ctrl) and 5 (Slc35a3−/−) in CS/DS, HS, and HA measurements; n = 6 (Ctrl) and 4 (Slc35a3−/−) in KS measurement. P values were calculated using Student’s t-test. N.S., not significant; N.D., not detected.

Similar articles

Cited by

References

    1. Stanley P. Golgi glycosylation. Cold Spring Harb Perspect Biol. 2011;3(4). Epub 2011/03/29. doi: 10.1101/cshperspect.a005199 ; PubMed Central PMCID: PMC3062213. - DOI - PMC - PubMed
    1. Spiro RG. Protein glycosylation: nature, distribution, enzymatic formation, and disease implications of glycopeptide bonds. Glycobiology. 2002;12(4):43r–56r. Epub 2002/06/04. doi: 10.1093/glycob/12.4.43r . - DOI - PubMed
    1. Parker JL, Newstead S. Gateway to the Golgi: molecular mechanisms of nucleotide sugar transporters. Curr Opin Struct Biol. 2019;57:127–34. Epub 2019/04/19. doi: 10.1016/j.sbi.2019.03.019 ; PubMed Central PMCID: PMC6504644. - DOI - PMC - PubMed
    1. Hadley B, Litfin T, Day CJ, Haselhorst T, Zhou Y, Tiralongo J. Nucleotide Sugar Transporter SLC35 Family Structure and Function. Comput Struct Biotechnol J. 2019;17:1123–34. Epub 2019/08/30. doi: 10.1016/j.csbj.2019.08.002 ; PubMed Central PMCID: PMC6709370. - DOI - PMC - PubMed
    1. Liu L, Xu YX, Hirschberg CB. The role of nucleotide sugar transporters in development of eukaryotes. Semin Cell Dev Biol. 2010;21(6):600–8. Epub 2010/02/11. doi: 10.1016/j.semcdb.2010.02.002 ; PubMed Central PMCID: PMC2917499. - DOI - PMC - PubMed

Publication types