. 2023 Apr 13;19(4):e1010325.
doi: 10.1371/journal.pcbi.1010325. eCollection 2023 Apr.

Improving the workflow to crack Small, Unbalanced, Noisy, but Genuine (SUNG) datasets in bioacoustics: The case of bonobo calls

Affiliations

Improving the workflow to crack Small, Unbalanced, Noisy, but Genuine (SUNG) datasets in bioacoustics: The case of bonobo calls

Vincent Arnaud et al. PLoS Comput Biol. .

Abstract

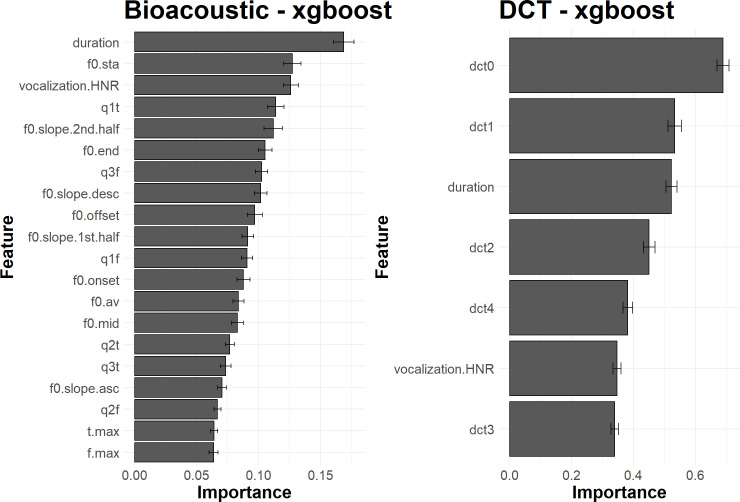
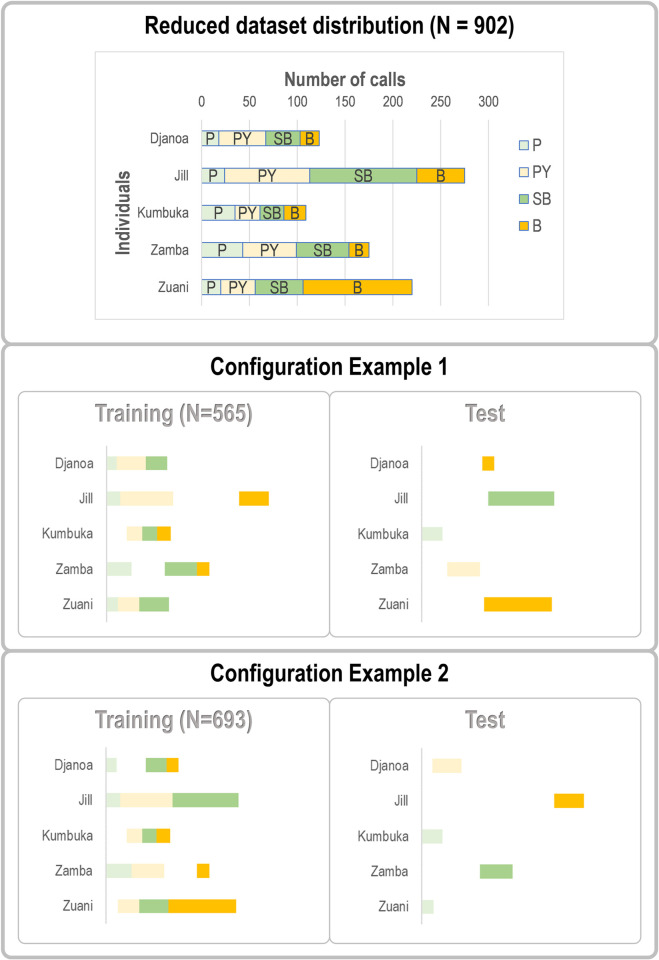
Despite the accumulation of data and studies, deciphering animal vocal communication remains challenging. In most cases, researchers must deal with the sparse recordings composing Small, Unbalanced, Noisy, but Genuine (SUNG) datasets. SUNG datasets are characterized by a limited number of recordings, most often noisy, and unbalanced in number between the individuals or categories of vocalizations. SUNG datasets therefore offer a valuable but inevitably distorted vision of communication systems. Adopting the best practices in their analysis is essential to effectively extract the available information and draw reliable conclusions. Here we show that the most recent advances in machine learning applied to a SUNG dataset succeed in unraveling the complex vocal repertoire of the bonobo, and we propose a workflow that can be effective with other animal species. We implement acoustic parameterization in three feature spaces and run a Supervised Uniform Manifold Approximation and Projection (S-UMAP) to evaluate how call types and individual signatures cluster in the bonobo acoustic space. We then implement three classification algorithms (Support Vector Machine, xgboost, neural networks) and their combination to explore the structure and variability of bonobo calls, as well as the robustness of the individual signature they encode. We underscore how classification performance is affected by the feature set and identify the most informative features. In addition, we highlight the need to address data leakage in the evaluation of classification performance to avoid misleading interpretations. Our results lead to identifying several practical approaches that are generalizable to any other animal communication system. To improve the reliability and replicability of vocal communication studies with SUNG datasets, we thus recommend: i) comparing several acoustic parameterizations; ii) visualizing the dataset with supervised UMAP to examine the species acoustic space; iii) adopting Support Vector Machines as the baseline classification approach; iv) explicitly evaluating data leakage and possibly implementing a mitigation strategy.


Conflict of interest statement

The authors have declared that no competing interests exist.

Figures

Fig 1
Fig 1. Workflow implemented to analyze a dataset of animal vocalizations.
Block A is species-dependent and illustrates the bonobo case. The other blocks are generic over SUNG datasets. A. The traditional bioacoustic approach is applied to the bonobo dataset to deduce call type templates. B. Three different sets of acoustic features are associated (BIOACOUSTIC, DCT, and MFCC) to characterize the bonobo acoustic space. Supervised UMAP is run to visually assess call type and individual separability. The performance of three state-of-the-art classifiers and their ensembling combinations is assessed and compared to that of a discriminant analysis (DFA) in two tasks: identification of call types (bonobos have a vocal repertoire composed of different calls) and discrimination between emitters (identification of individual vocal signatures). C. The sensitivity of accuracy to the composition of the training and test sets and to the induced data leakage is then evaluated.
Fig 2
Fig 2. An example of a SUNG bioacoustic dataset: recordings of bonobo calls in social contexts.
A. Each individual can be recorded in outdoor enclosures and inside buildings. B. The number of calls varies between individuals (unbalanced distribution coded by colored rectangles) and call types (coded by internal rectangles for each individual). The five most-represented individuals are named. The four least represented individuals are not shown on the chart. The detailed breakdown is given in Table 1. C. Spectrogram of a typical recorded bout (2.5 seconds extracted from the Jill698 recording) showing the difficulty of isolating good quality calls. A sequence of three Soft Barks produced by Jill can be identified (sections delimited by blue boundaries). Other individuals vocalize in the background (sections marked with orange curly brackets). Jill’s third call is not analyzed as it overlaps too much with other vocalizations. The Jil698 recording is available as S1 Sound and described in S4 Text. Photo credits: F. Levréro (Top) & F. Pellegrino (Bottom).
Fig 3
Fig 3. Templates of f0 (pitch) for each call type.
The average f0 trajectory (black line) is calculated from all recordings (using Praat). The shaded area covers 50% or 80% of the distribution (blue and grey areas respectively). For each type of call, individual calls were time-scaled to the average duration of the type. N = number of calls analyzed; Dur = call duration (mean and standard deviation, in ms); Harm = harmonicity (mean and standard deviation, in dB). The types are ranked by increasing average duration: Peep (P), Yelp (Y), Hiccup (H), Peep Yelp (PY), Soft Bark (SB), Bark (B), Scream Bark (SCB), Whining Whistle (WW), Whistle (W), and Scream Whistle (SCW).
Fig 4
Fig 4. Representation of call f0 templates at the individual level.
Each color/hue combination corresponds to a call type (P, Y, PY, SB, B, SCB, as defined in Fig 3). Each curve is a miniature of an individual’s f0 template. The call type (acronym and color) and individual identity (numerical index) are indicated. All individuals and call types for which at least 3 samples were available are displayed. The repertoire of individuals #19 and #20 is highlighted (thick lines).
Fig 5
Fig 5. Projections of bonobo calls into bidimensional acoustic spaces through S-UMAP computed on the raw acoustic features of the Bioacoustic, DCT, and MFCC sets (1,560 calls; each dot = 1 call; different colors encode different hand-labeled categories).
Left. Top. S-UMAP projection supervised by call types. Bottom. Silhouette profiles corresponding to the call type clustering, built from a 100-repetition distribution of silhouette scores, with averages and standard deviations per call type being represented by dashed vertical and horizontal lines, respectively. Right. Top. S-UMAP projection supervised by individual identities. Bottom. Silhouette profiles corresponding to the individual signature clustering, built from a 100-repetition distribution of silhouette scores, with averages and standard deviations per individual being represented by dashed vertical and horizontal lines, respectively.
Fig 6
Fig 6. Performance in classifying bonobo call types as a function of classifier and acoustic set used.
The red bar shows the performance achieved by an ensemble classifier combining the 9 primary classifiers. The other bars correspond to configurations associating each classifier with different sets of acoustic features (Bioacoustic, DCT, MFCC). The configurations are sorted by decreasing performance from top to bottom. Performance is reported in terms of balanced accuracy. Green, turquoise, and purple indicate the models trained on the Bioacoustic, DCT, and MFCC feature sets respectively. Chance level is represented by the vertical dashed red line. The error bars report the standard deviation of the performances for the 100 iterations of the evaluation process.
Fig 7
Fig 7. Average confusion matrix, for 100 iterations of the evaluation process, reporting the classification rates of the call types in the best configuration (the ensemble classifier combining the 9 primary classifiers).
Types are sorted from bottom to top by decreasing number of occurrences (PY: most frequent; SCB: least frequent). Percentages are according to the reference and sum to 1 along rows. The value of a cell color is proportional to its percentage (the darker, the larger).
Fig 8
Fig 8. Average importance of acoustic features, for 100 iterations of the evaluation process, when classifying call types with xgboost.
Left. Features of the Bioacoustic set. Right. Features of the DCT set. The bar plots illustrate the relative influence of each acoustic feature on the classification performance. The error bars report the standard deviation of the measure of importance for the 100 iterations of the evaluation process.
Fig 9
Fig 9. Performance in classifying bonobo individual signatures as a function of classifier and acoustic set used.
The red bar shows the performance achieved by an ensemble classifier combining the 9 primary classifiers. The other bars correspond to configurations associating each classifier with different sets of acoustic features (Bioacoustic, DCT, MFCC). The configurations are sorted by decreasing performance from top to bottom. Performance is reported in terms of balanced accuracy. Green, turquoise, and purple indicate the models trained on the Bioacoustic, DCT, and MFCC feature sets respectively. Chance level is represented by the vertical dashed red line. The error bars report the standard deviation of the performances for the 100 iterations of the evaluation process.
Fig 10
Fig 10. Average confusion matrix, for 100 iterations of the evaluation process, reporting the classification rates of the individual signatures in the best configuration (the ensemble classifier combining the 9 primary classifiers).
Individuals are sorted from bottom to top by decreasing the number of calls (Jill: largest number; Busira: lowest number). Percentages are according to the reference and sum to 1 along rows. The value of a cell color is proportional to its percentage (the darker, the larger).
Fig 11
Fig 11. Average importance of acoustic features, for 100 iterations of the evaluation process, when classifying individual signatures with xgboost.
Left. Features of the Bioacoustic set. Right. Features of the DCT set. The bar plots illustrate the relative influence of each acoustic feature on the classification performance. The error bars report the standard deviation of the measure of importance for the 100 iterations of the evaluation process.
Fig 12
Fig 12. Influence of the sampling on data leakage (all sequences considered).
Three scenarios are applied: Default, Fair and Skewed. Left. Distribution of the 100 runs for each strategy in terms of sequence overlap between training and test sets (0: no overlap). Right. Influence of scenario on performance (balanced accuracy) for each combination of classifiers and acoustic feature sets when classifying individual signatures.
Fig 13
Fig 13. Influence of the sampling on data leakage (sequences with at least three calls considered).
Three scenarios are applied: Default, Fair and Skewed. Left. Distribution of the 100 runs for each strategy in terms of sequence overlap between training and test sets (0: no overlap). Right. Influence of strategy on performance (balanced accuracy) for each combination of classifiers and acoustic feature sets when classifying individual signatures.
Fig 14
Fig 14. Illustration of a strategy to minimize information leakage when building training and test sets for a classification / discrimination task.
The upper panel shows the distribution of call types per individual in our reduced dataset. The middle and lower panels display two configurations for the training and test sets where each call type for a given individual appears only in one of the two sets.
Fig 15
Fig 15. Scatterplots showing the evolution of the DFA performance as a function of the number of PC considered using four different performance metrics (see “Automatic classification approaches and evaluation methodology” for details about these metrics).
Left. Classification of individual signature. Right. Classification of call type.

Similar articles

Cited by

References

    1. Coye C, Zuberbühler K, Lemasson A. Morphologically structured vocalizations in female Diana monkeys. Anim Behav. 2016;115: 97–105. doi: 10.1016/j.anbehav.2016.03.010 - DOI
    1. Turesson HK, Ribeiro S, Pereira DR, Papa JP, de Albuquerque VHC. Machine Learning Algorithms for Automatic Classification of Marmoset Vocalizations. Smotherman M, editor. PLOS ONE. 2016;11: e0163041. doi: 10.1371/journal.pone.0163041 - DOI - PMC - PubMed
    1. Mielke A, Zuberbühler K. A method for automated individual, species and call type recognition in free-ranging animals. Anim Behav. 2013;86: 475–482. doi: 10.1016/j.anbehav.2013.04.017 - DOI
    1. Aubin T, Mathevon N, editors. Coding Strategies in Vertebrate Acoustic Communication. Cham: Springer International Publishing; 2020. doi: 10.1007/978-3-030-39200-0 - DOI
    1. Janik VM, Sayigh LS, Wells RS. Signature whistle shape conveys identity information to bottlenose dolphins. Proc Natl Acad Sci. 2006;103: 8293–8297. doi: 10.1073/pnas.0509918103 - DOI - PMC - PubMed

Publication types