. 2023 Apr 13;18(4):e0283607.
doi: 10.1371/journal.pone.0283607. eCollection 2023.

Grape seed meal by-product is able to counteract oxidative stress induced by lipopolysaccharide and dextran sulphate in IPEC cells and piglets after weaning

Affiliations

Grape seed meal by-product is able to counteract oxidative stress induced by lipopolysaccharide and dextran sulphate in IPEC cells and piglets after weaning

Gina Cecilia Pistol et al. PLoS One. .

Abstract

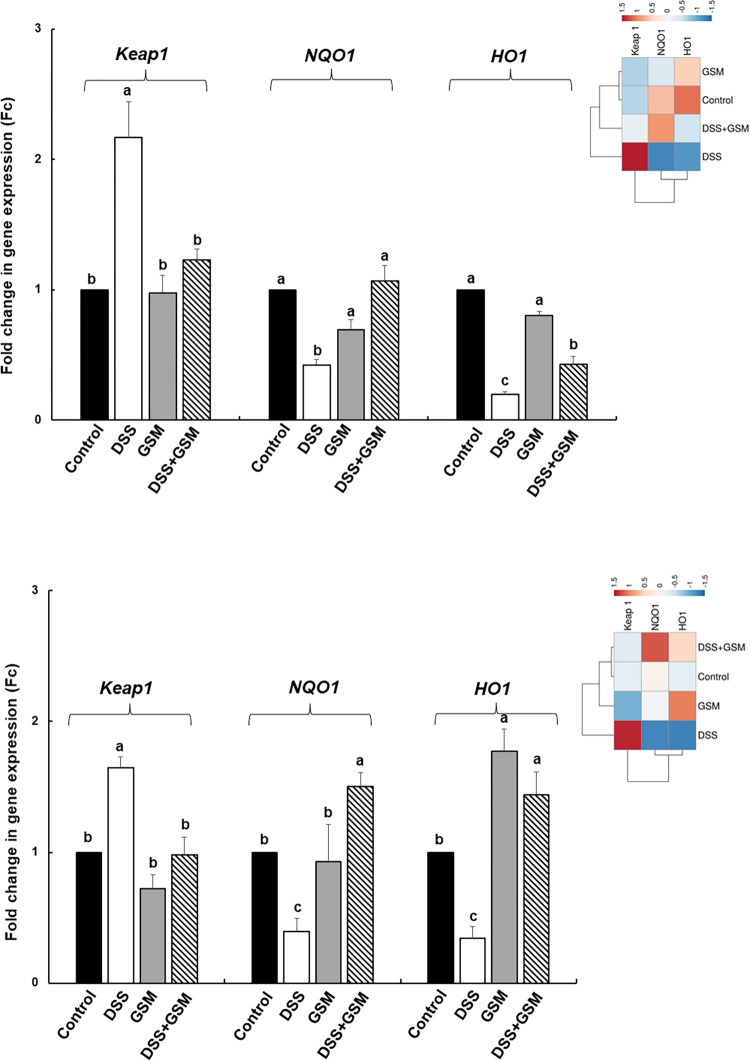
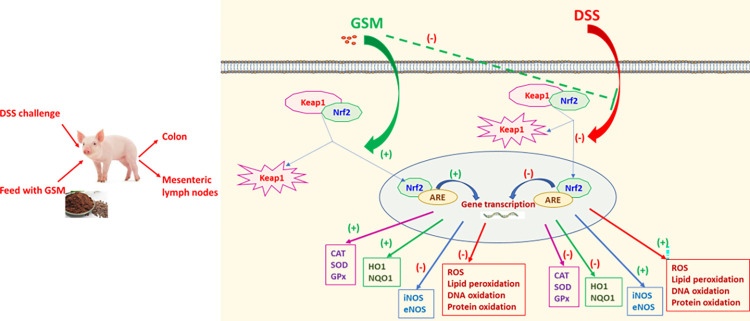
Oxidative stress is a pivotal factor in the pathogenesis of intestinal inflammation, leading to cellular damage and tissue injury. Natural antioxidants compounds found in agro-industrial by-products have proven their effectiveness in treatment of intestinal inflammation and oxidative stress, exhibiting many favourable effects. The aim of this study was to evaluate the capacity of a grape seed meal byproduct (GSM) to counteract the effects induced by E. coli lipopolysaccharide (LPS, 5μg/ml) in vitro on IPEC-1 cells and by dextran sulphate sodium (DSS, 1g/b.w./day) in vivo on piglets after weaning. Reactive oxygen species (ROS), pro-oxidant markers (malondialdehyde MDA, thiobarbituric acid reactive substances TBARS, protein carbonyl, DNA oxidative damage) antioxidant enzymes (catalase -CAT, superoxide dismutase -SOD, glutathione peroxidase -GPx, endothelial and inducible nitric oxide synthases -eNOS and iNOS) and several important components of Keap1/Nrf2 signalling pathway were analysed in IPEC-1 cells as well as in piglet's colon and lymph nodes. Our results demonstrated that GSM extract or 8% dietary GSM showed anti-oxidant properties counteracting the pro-oxidant response (ROS, MDA-TBARS, protein carbonyl, DNA/RNA damage) induced by LPS or DSS and restoring the levels of endogenous antioxidant enzymes, including CAT, SOD, GPx, eNOS and iNOS in colon and mesenteric lymph nodes. These beneficial effects were modulated via Nrf2 signalling pathway in both in vitro and in vivo studies.


Conflict of interest statement

The authors have declared that no competing interests exist.

Figures

Fig 1
Fig 1. Effects of GSM on the distribution of ROS (+) and ROS (-) cells in IPEC-1 cell population.
IPEC-1 cells were incubated with the following treatments for 24 hours: Control = untreated cells; LPS = cells treated with LPS (5μg/ml) + 100 μL culture media, 24h; GSM = cells pre-incubated 4h without LPS and treated after with 100 μL (50μg/mL) of GSM phenolic extract; LPS + GSM = cells pre-incubated with LPS (5μg/ml) 4 h and treated after with 100 μL (50μg/mL) of GSM phenolic extract 24h; EGCG = cells pre-incubated 4h without LPS and treated after with 100 μL (23 μg/ml) EGCG; LPS + EGCG = cells incubated with LPS (5μg/ml) 4 h and treated after with 100 μL (23 μg/ml) EGCG, 24h. Results are presented as means ± standard errors, from three individual experiments. For each treatment, representative dot plots as well as histograms were presented (left panel). a, b, c = Histograms with unlike superscript letters were significantly different (p < 0.050). Three replicates per treatment were analysed, and median values of ROS (+) and ROS (-) cell percentages were showed.
Fig 2
Fig 2
The effects of GSM on the antioxidant genes expression (A) and antioxidant activity (B, C, D) in IPEC-1 cells. IPEC-1 cells were incubated with the following treatments: Control = untreated cells; LPS = cells treated with LPS (5μg/ml) + 100 μL culture media, 24h; GSM = cells pre-incubated 4h without LPS and treated after with 100 μL (50μg/mL) of GSM phenolic extract; LPS + GSM = cells pre-incubated with LPS (5μg/ml) 4 h and treated after with 100 μL (50μg/mL) of GSM phenolic extract 24h; EGCG = cells pre-incubated 4h without LPS and treated after with 100 μL (23μg/ml) EGCG; LPS + EGCG = cells pre-incubated with LPS (5μg/ml) 4 h and treated after with 100 μL (23μg/ml) EGCG, 24h. Results are presented as means ± standard errors, from three experimental series. a, b, c = Histograms for each group with unlike superscript letters were significantly different (p < 0.050). The enzyme activities were expressed as: μmol/ml (CAT), U/ml (SOD), μmol/ml (TAC). The heatmap (the upper right panel) represents antioxidant gene expression levels in experimental groups of cells. The magnitude of gene expression level is represented by a colour scale (top) going from low (blue) to high (red).
Fig 3
Fig 3. The effects of GSM on the expression of genes coding for Keap1/Nrf2 signalling pathway in IPEC-1 cells.
IPEC-1 cells were incubated with the following treatments: Control = untreated cells; LPS = cells treated with LPS (5μg/ml) + 100 μL culture media, 24h; GSM = cells pre-incubated 4h without LPS and treated after with 100 μL (50μg/mL) of GSM phenolic extract; LPS + GSM = cells pre-incubated with LPS (5μg/ml) 4 h and treated after with 100 μL (50μg/mL) of GSM phenolic extract 24h; EGCG = cells pre-incubated 4h without LPS and treated after with 100 μL (23μg/ml) EGCG; LPS + EGCG = cells pre-incubated with LPS (5μg/ml) 4 h and treated after with 100 μL (23μg/ml) EGCG, 24h. Results are presented as means ± standard errors, from three experimental series. a, b, c Histograms for each group with unlike superscript letters were significantly different (p < 0.050). The heatmap (the right panel) represents the Keap1, Nrf2, NQO1 and HO1 gene expression levels of experimental groups. The magnitude of the gene expression level is represented by a colour scale (top) going from low (blue) to high (red).
Fig 4
Fig 4. Effect of DSS and GSM diet on ROS and TBARS levels in colon and mesenteric lymph nodes.
Unchallenged and DSS-challenged pigs were assigned for 30 days to a control diet (Control and DSS groups) or 8% GSM diet (GSM and DSS + GSM groups). At the end of the experiment, colon and lymph nodes samples from all animals (n = 5) were collected and analysed for ROS and TBARS Results are presented as means ± standard errors. a, b, c = Histograms for each group with unlike superscript letters were significantly different (p < 0.050).
Fig 5
Fig 5
Effect of DSS and dietary GSM treatment on antioxidant gene expression in colon (A), and mesenteric lymph nodes (B) and on enzyme activity and TCA in colon (C) and lymph nodes (D). Unchallenged and DSS-treated pigs were assigned for 30 days to a Control diet (Control and DSS groups) or 8% GSM diet (GSM and DSS + GSM groups). At the end of the experiment, colon and lymph nodes samples from all animals (n = 5) were collected and analysed for gene expression (qPCR), enzymes activity and total antioxidant capacity (TCA). The enzyme activities were expressed as: μmol/min/g tissue (CAT and GPx), U/g tissue (SOD), μmol/g tissue (TAC). Results are presented as means ± standard errors. a, b, c = Histograms for each group with unlike superscript letters were significantly different (p < 0.050). The heatmap (upper right panels) represents gene expression levels in colon (A-right panel) and mesenteric lymph nodes (B–right panel). The blue and red colours correspond to low and high gene expression, respectively.
Fig 6
Fig 6
The effect of DSS and dietary GSM treatment on the expression of genes coding for Keap1/Nrf2 signalling pathway in colon (A) and mesenteric lymph nodes (B). Unchallenged and DSS-treated pigs were assigned for 30 days to a Control diet (Control and DSS groups) or 8% GSM diet (GSM and DSS + GSM groups). At the end of the experiment, colon and lymph nodes samples from all animals (n = 5) were collected and analysed for gene expression (qPCR). a, b, c = Histograms for each group with unlike superscript letters were significantly different (p < 0.050). The heatmap (right panels) represents of Keap1, NQO1 and HO1 mRNA levels in colon (A-right panel) and mesenteric lymph nodes (B–right panel) collected from piglets. The blue and red colours correspond to low and high gene expression, respectively.
Fig 7
Fig 7
Expression of Nrf2 gene (A) and protein (B) in colon and mesenteric lymph nodes under DSS and GSM action. Unchallenged and DSS-treated pigs were assigned for 30 days to a Control diet (Control and DSS groups) or 8% GSM diet (GSM and DSS + GSM groups). At the end of the experiment, colon and mesenteric lymph nodes samples from all animals (n = 5) were collected. (A) The Nrf2 gene expression was analysed by qPCR and expressed as Fc. Results are presented as means ± standard errors. (B). The Nrf2 protein expression levels were expressed as arbitrary units (A.U.) as means ± standard errors of the mean (SEM). a, b, c Histograms for each group with unlike superscript letters were significantly different (p < 0.050).
Fig 8
Fig 8
Principal component plots experimental groups with antioxidant genes based on qPCR data set in IPEC-1 cells (A), colon (B) and mesenteric lymph nodes (C). The loading plot with differentially expressed genes in relation to the largest portion of the variance among experimental groups.
Fig 9
Fig 9. The postulated mechanism of action of DSS and GSM on oxidative stress markers and signalling.
DSS treatment reduced the nuclear translocation of nNrf2 into the nucleus leading to (i) stimulation of ROS production and the oxidative degradation of DNA, proteins and lipids; (ii) reduction of the gene expression and activity of antioxidant enzymes, CAT, SOD, GPx and increase of eNOS and iNOS expression. GSM showed anti-oxidant properties counteracting the pro-oxidant response induced by DSS and restoring the levels of endogenous antioxidant enzymes in colon and mesenteric lymph nodes. These effects were mediated via Nrf2 signalling pathway by restoring the expression of Nrf2, Keap1, HO1 and NQO1 genes.

Similar articles

Cited by

References

    1. Alemany-Cosme E., Saez-Gonzalez E, Moret I., Mateos B., Iborra M., Nos P., et al.. Oxidative Stress in the Pathogenesis of Crohn’s Disease and the Interconnection with Immunological Response, Microbiota, External Environmental Factors, and Epigenetics. Antioxidants (Basel). 2021;10(64):21. doi: 10.3390/antiox10010064 - DOI - PMC - PubMed
    1. Wang Y, Chen Y, Zhang X, Lu Y, Chen H. New insights in intestinal oxidative stress damage and the health intervention effects of nutrients: A review. Journal of Functional Foods. 2020;75:17. doi: 10.1016/j.jff.2020.104248 - DOI
    1. Tian T., Wang Z, Zhang J. Pathomechanisms of Oxidative Stress in Inflammatory Bowel Disease and Potential Antioxidant Therapies. Oxidative Medicine and Cellular Longevity. 2017;2017:18. doi: 10.1155/2017/4535194 - DOI - PMC - PubMed
    1. Piechota-Polanczyk A., Fichna J. Review article: the role of oxidative stress in pathogenesis and treatment of inflammatory bowel diseases. Naunyn Schmiedebergs Arch Pharmacol 2014;387(7):16. doi: 10.1007/s00210-014-0985-1 PubMed Central PMCID: PMC4065336. - DOI - PMC - PubMed
    1. Moura F.A., de Andrade K.Q., Dos Santos J.C.F., Araújo O.R.P., Goulart M.O.F. Antioxidant therapy for treatment of inflammatory bowel disease: Does it work?. Redox Biology. 2015;6:23. doi: 10.1016/j.redox.2015.10.006 - DOI - PMC - PubMed

Publication types