. 2023 Apr;3(4):e722.
doi: 10.1002/cpz1.722.

Using the Reactome Database

Affiliations

Using the Reactome Database

Karen Rothfels et al. Curr Protoc. 2023 Apr.

Abstract

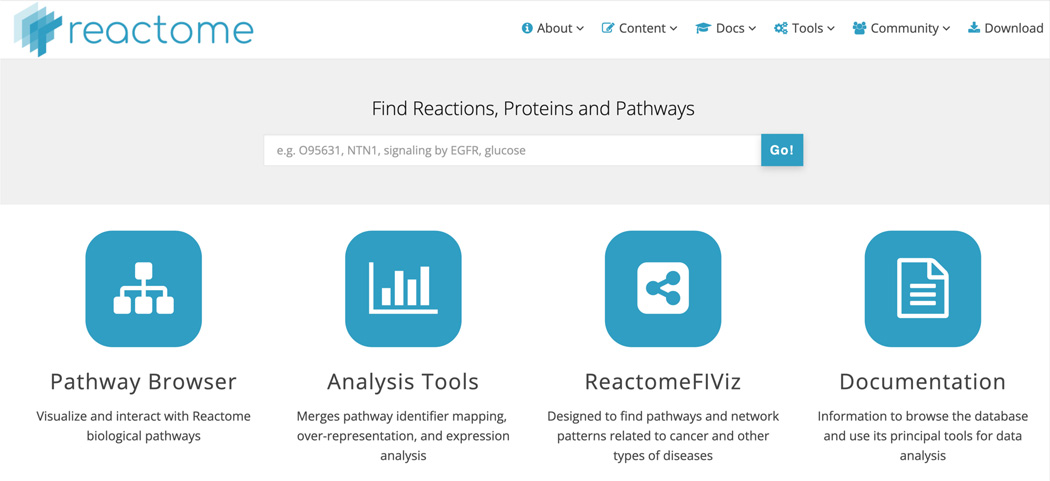
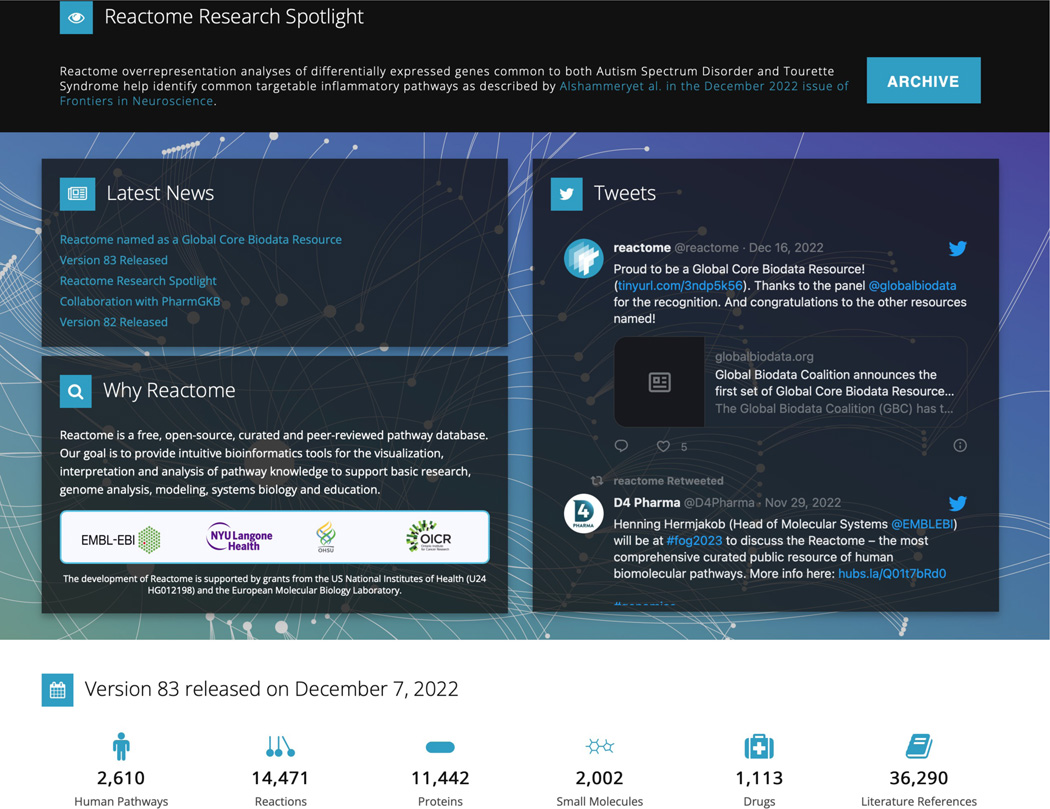
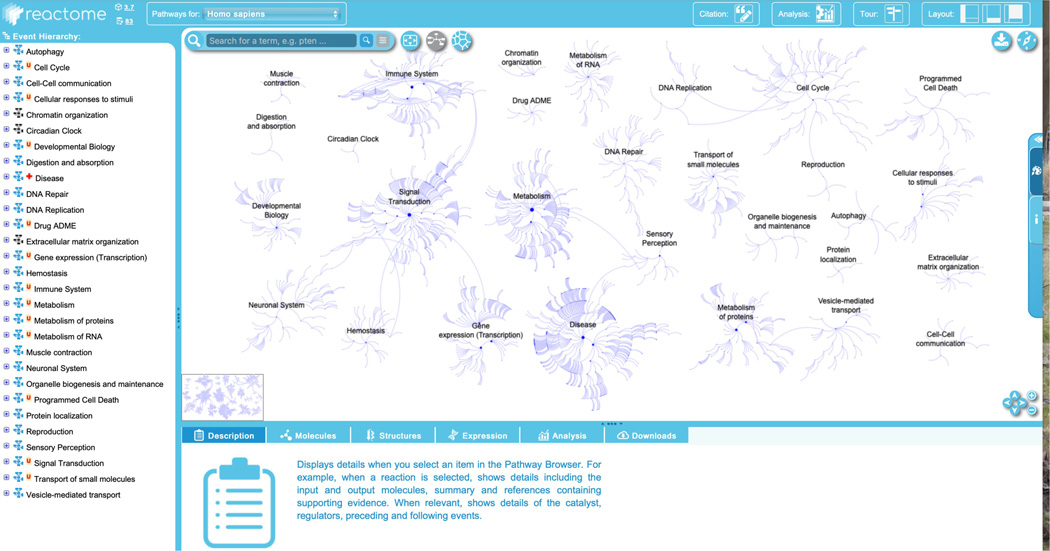
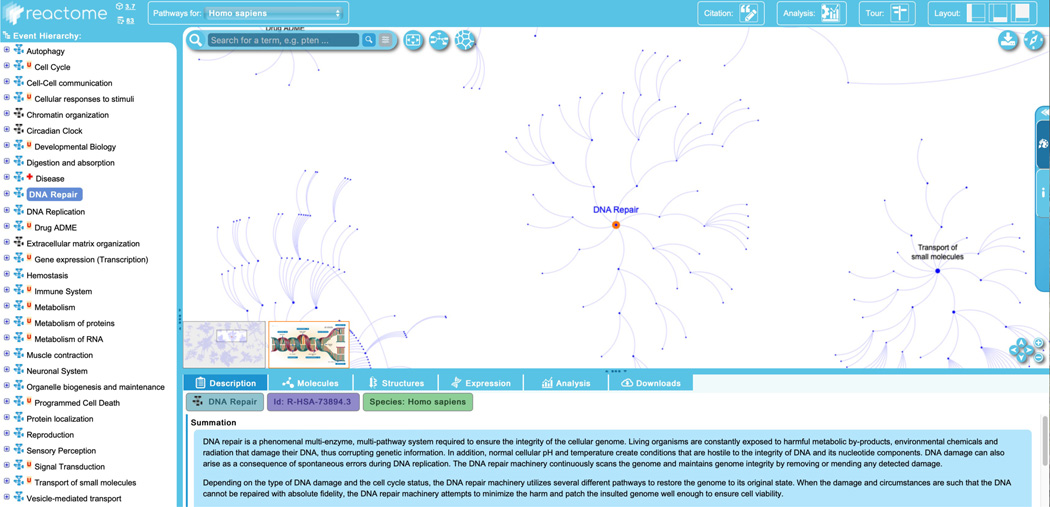
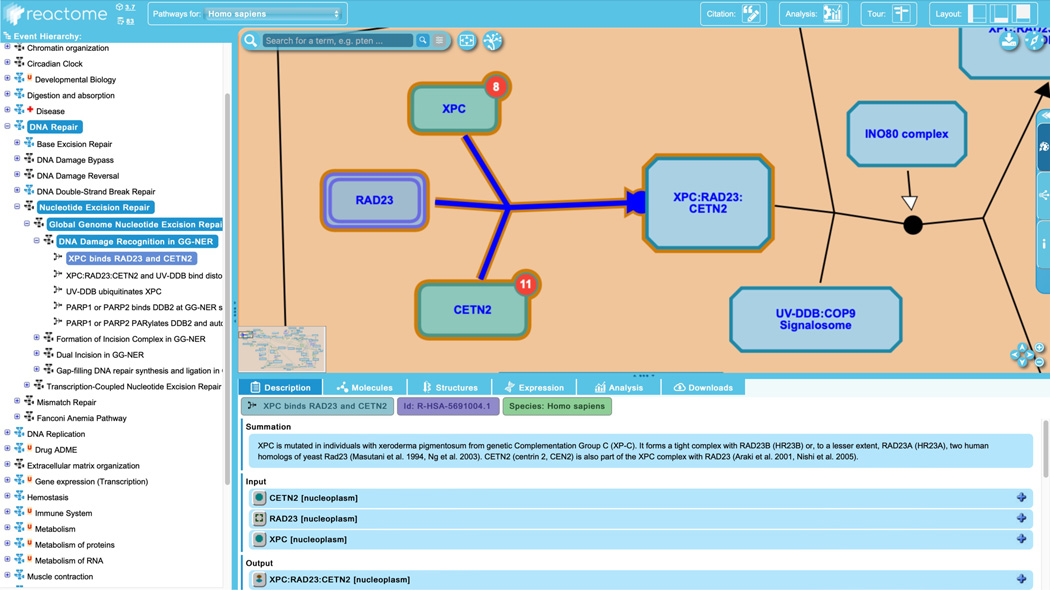
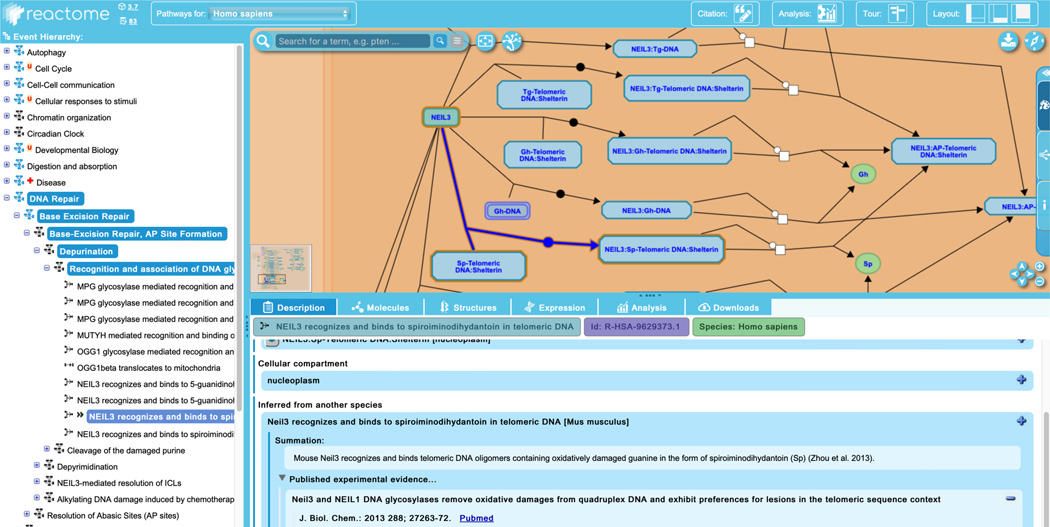
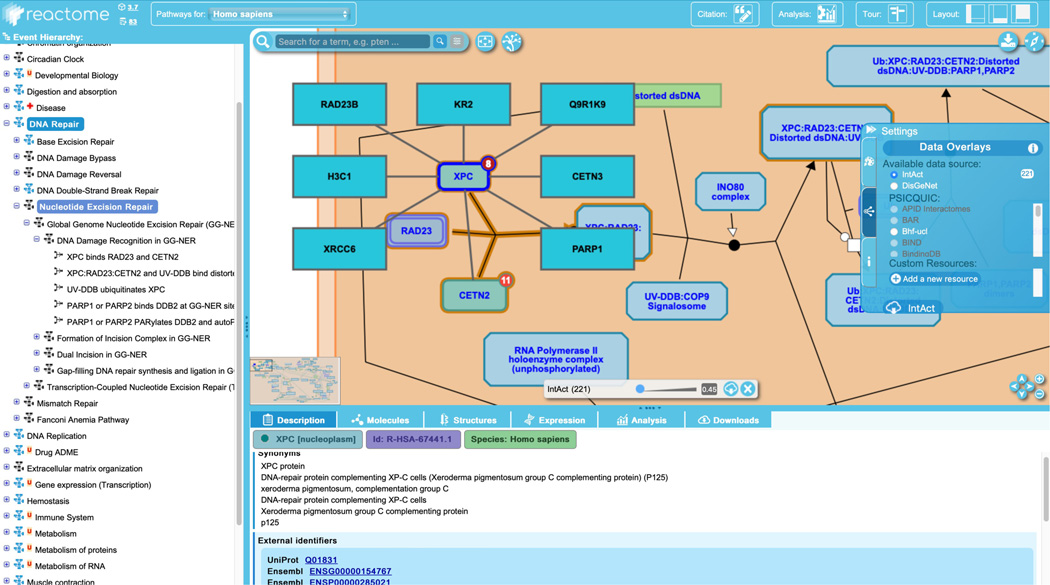
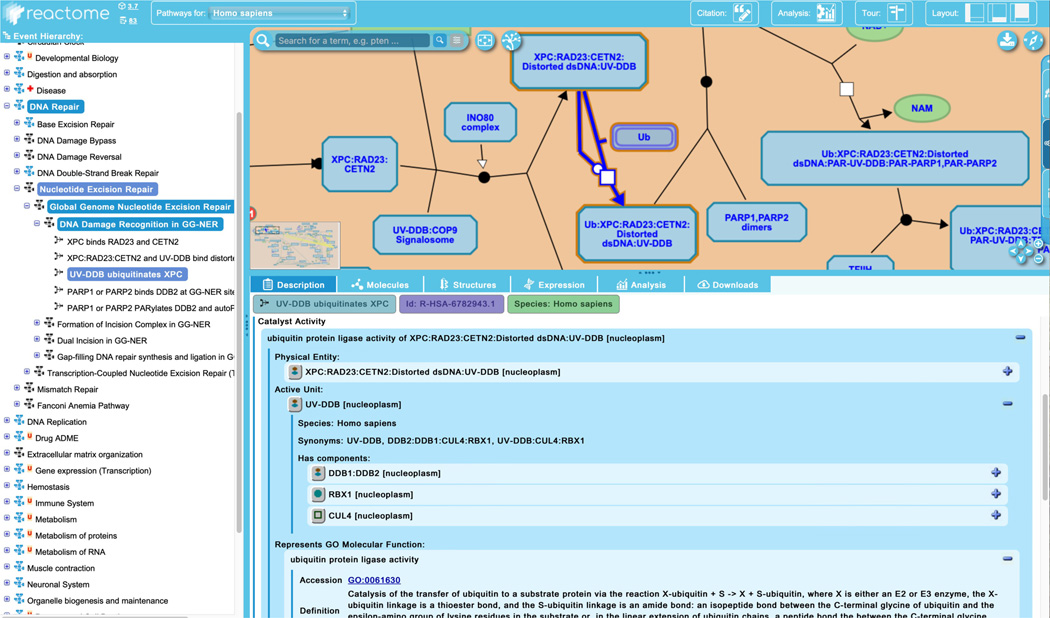
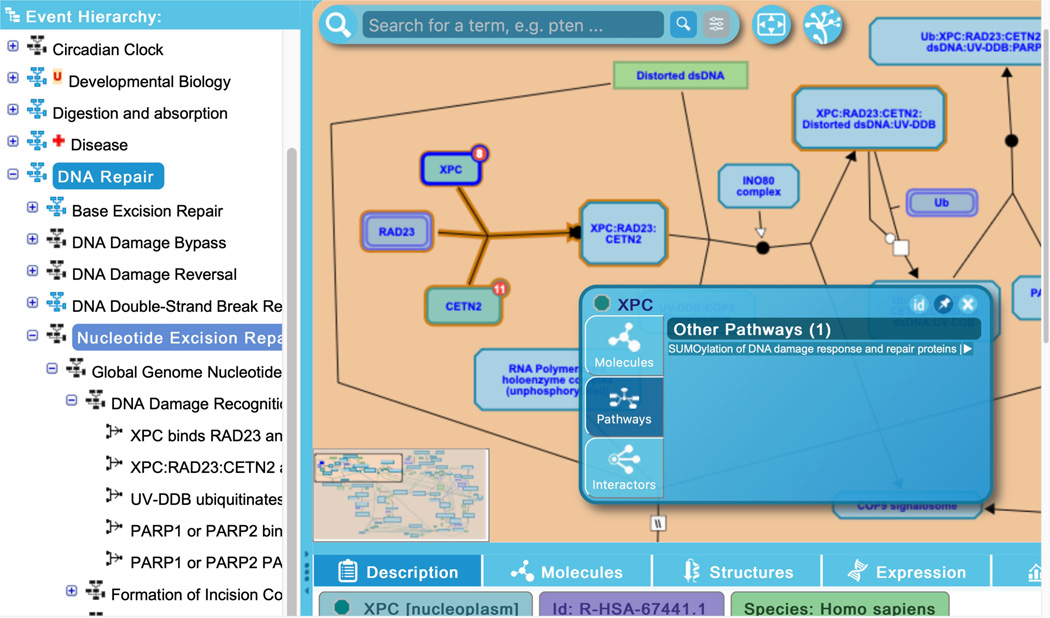
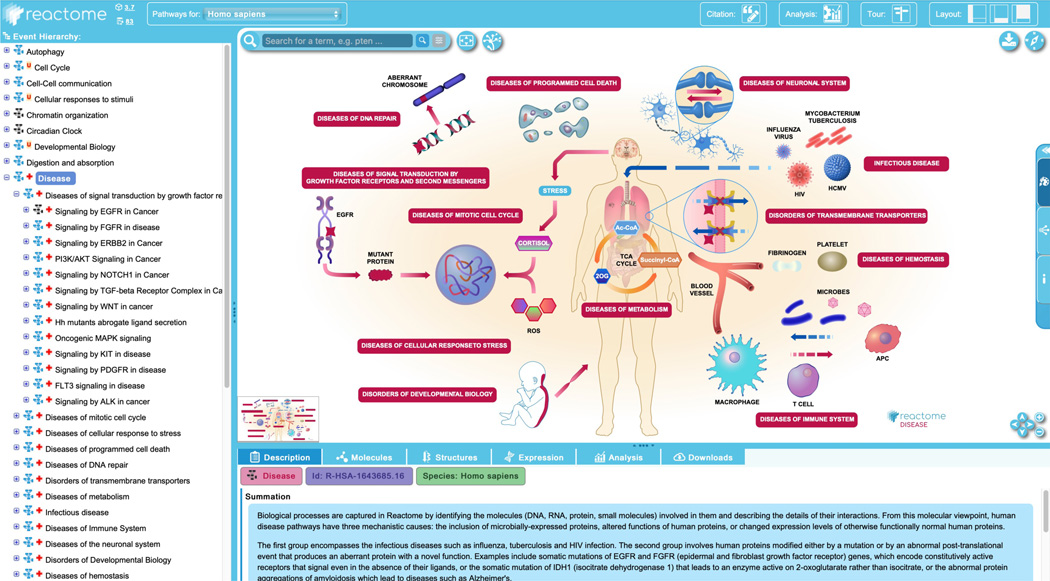
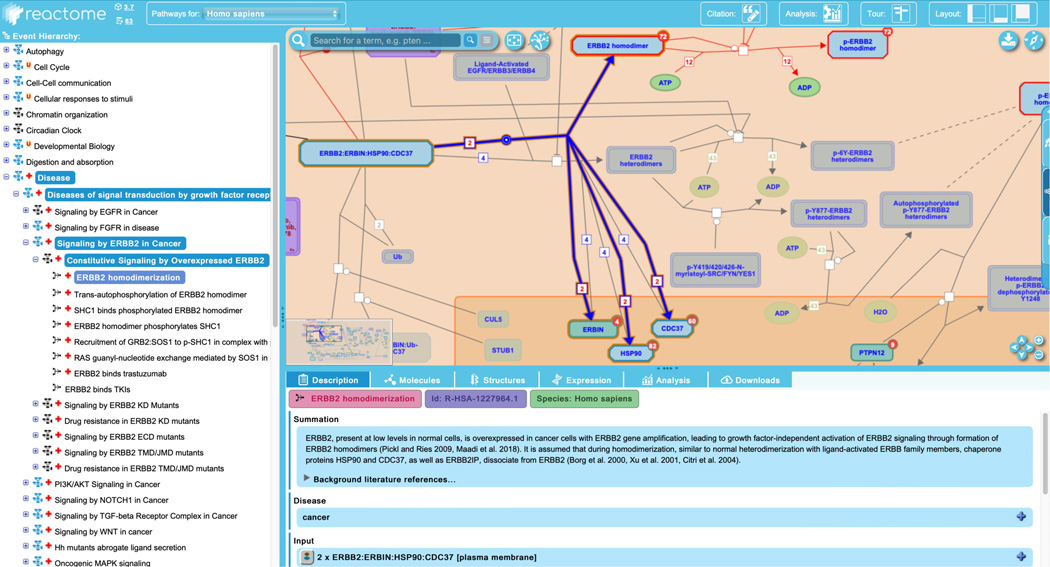
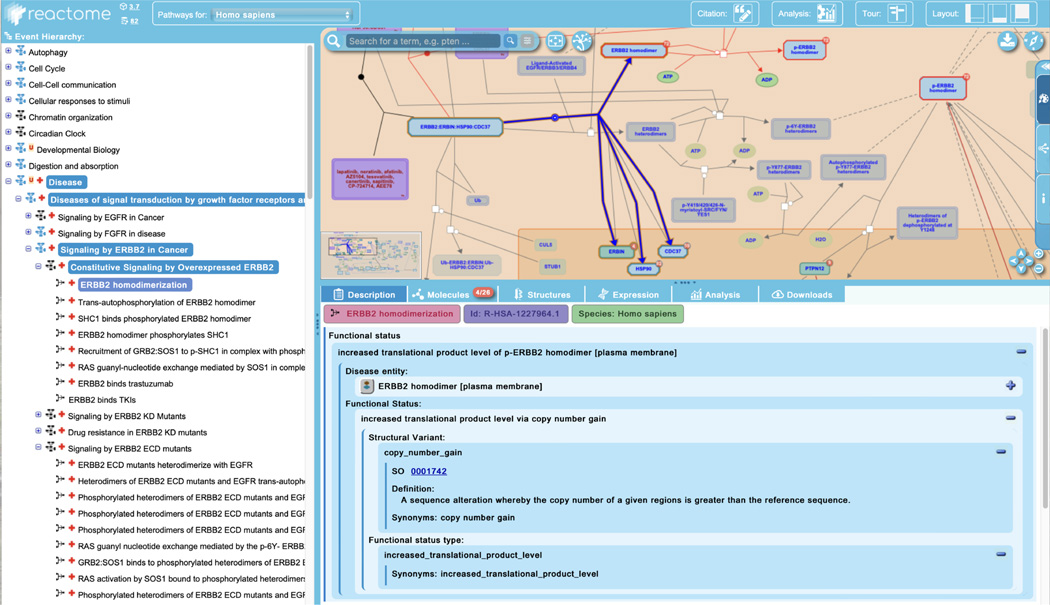
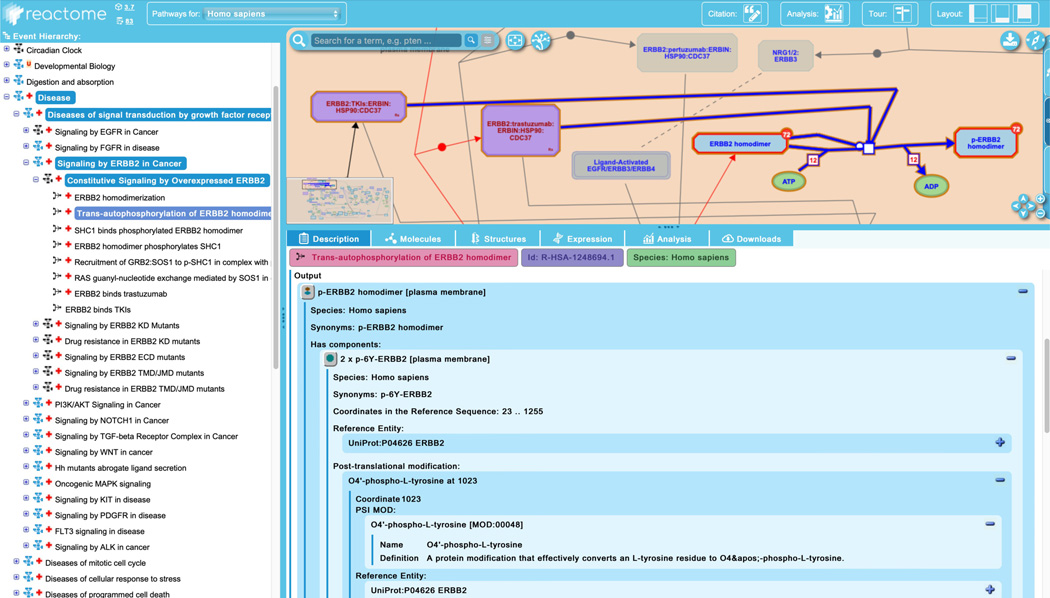
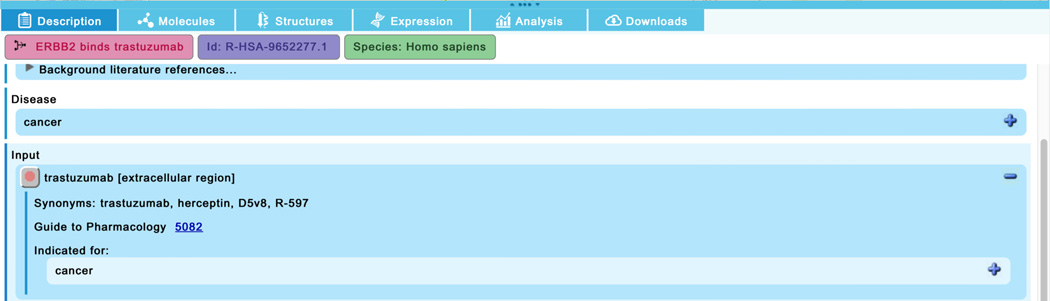
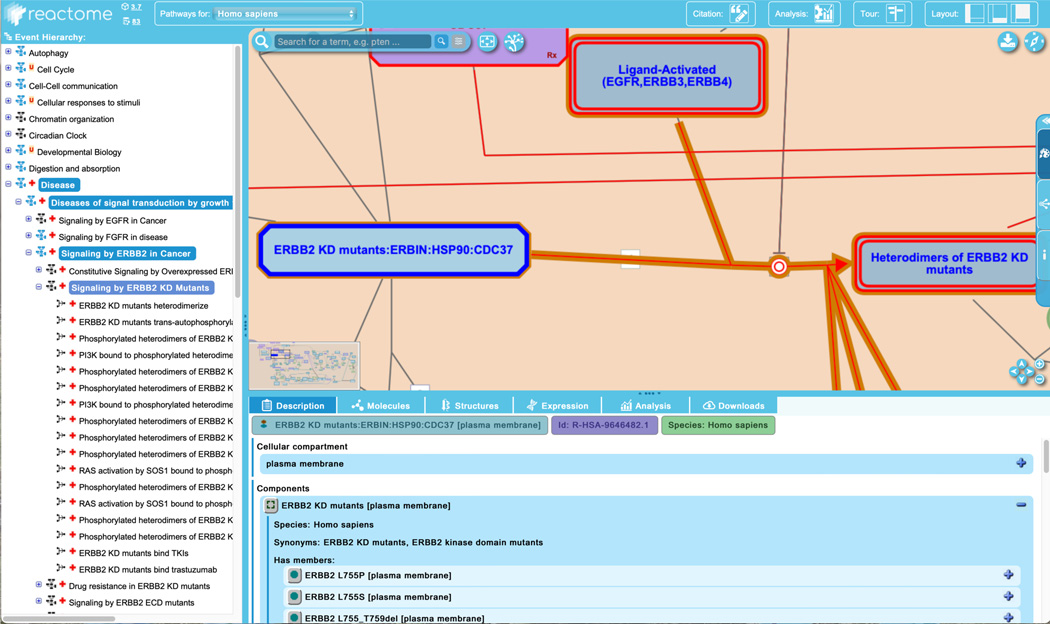
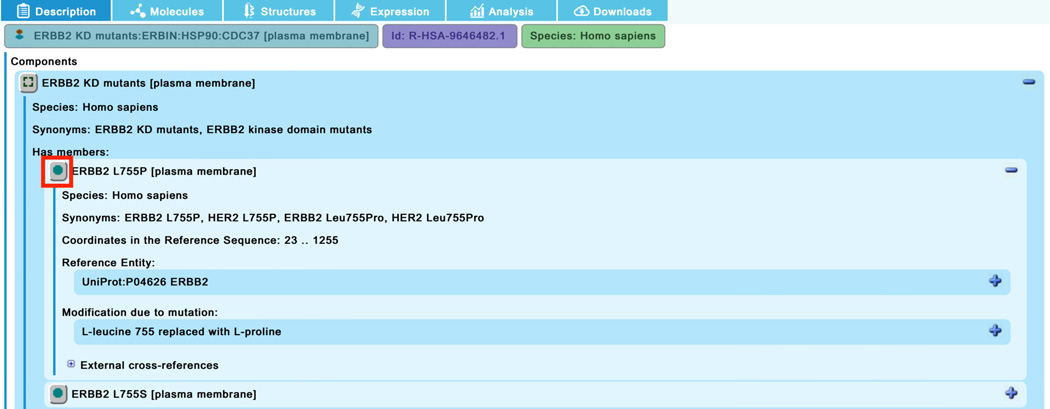
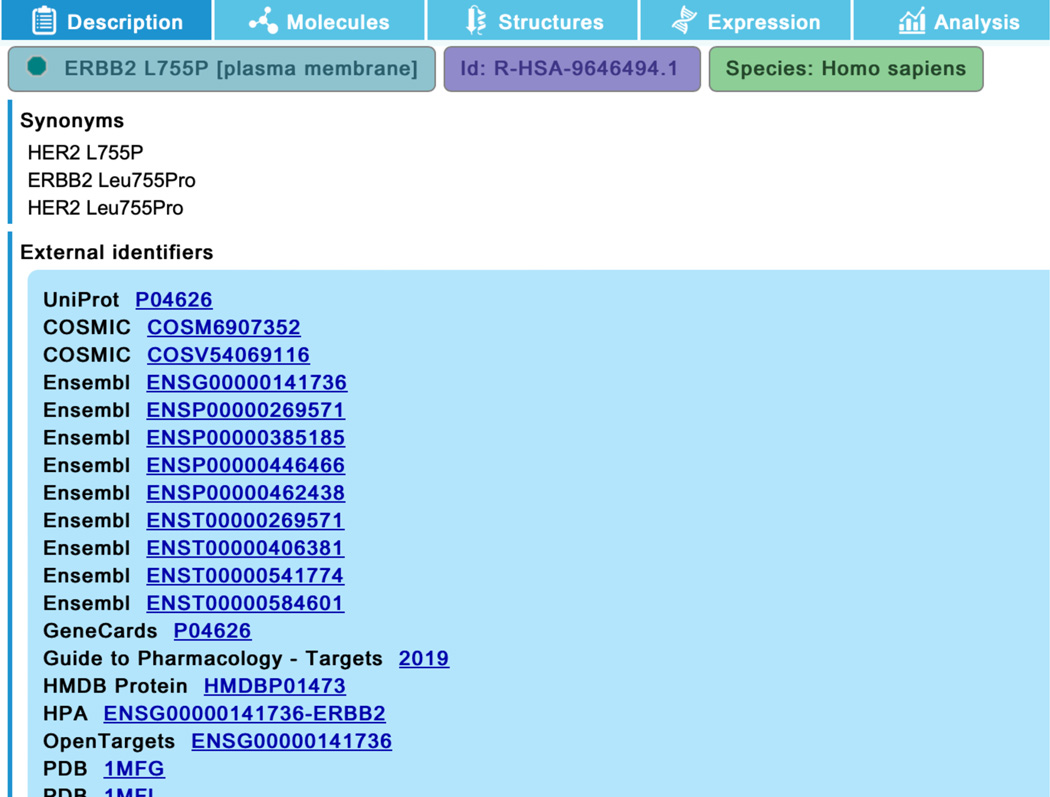
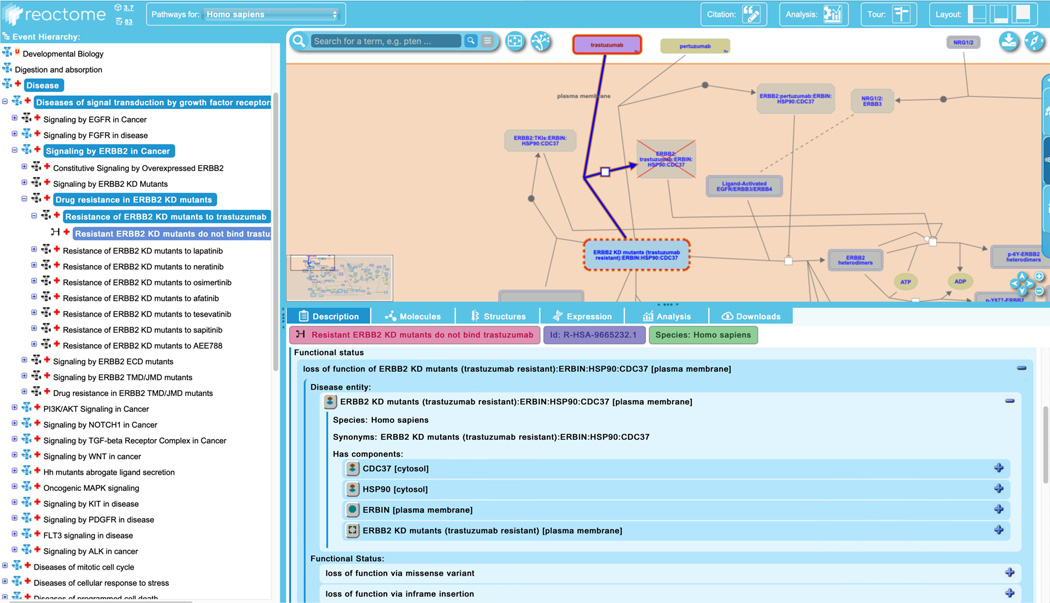
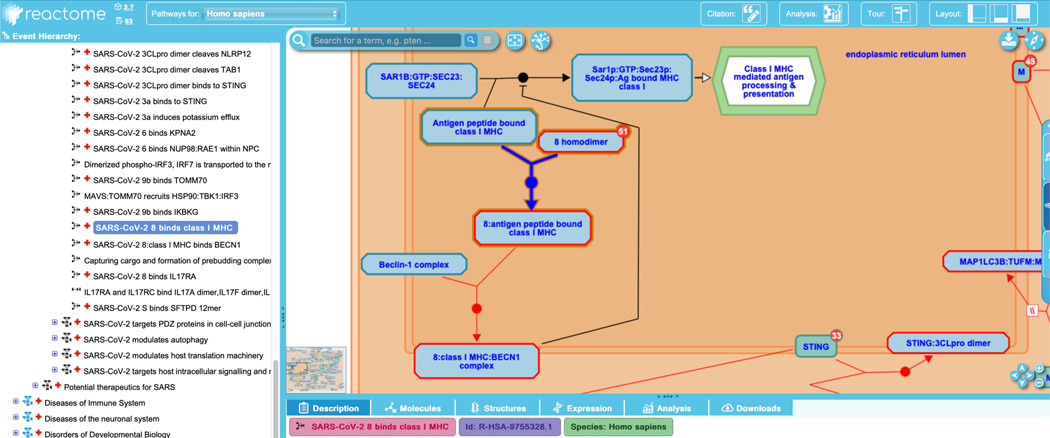
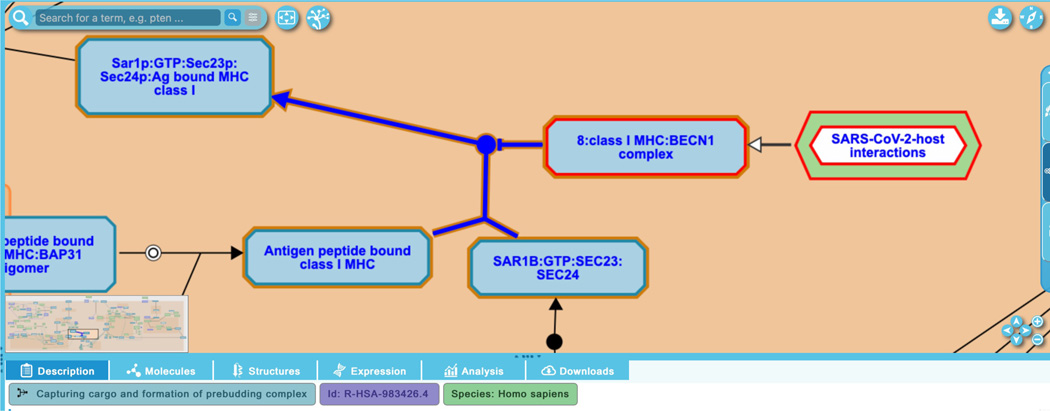
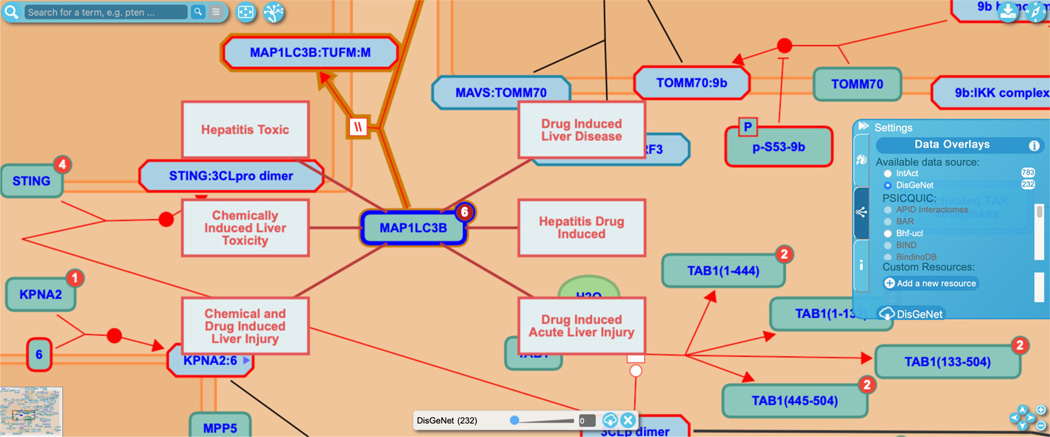
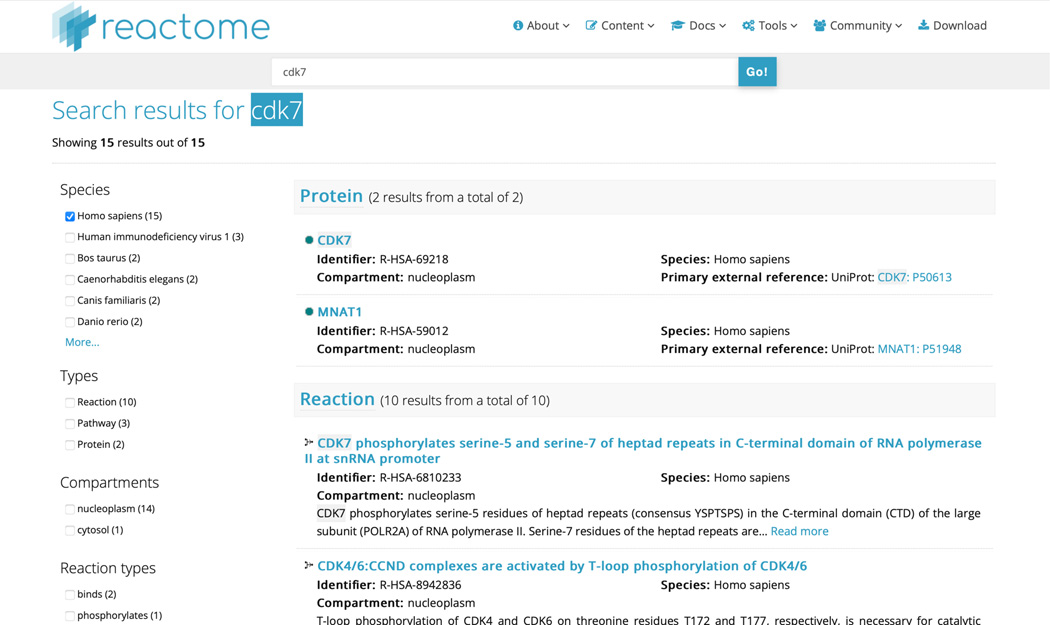
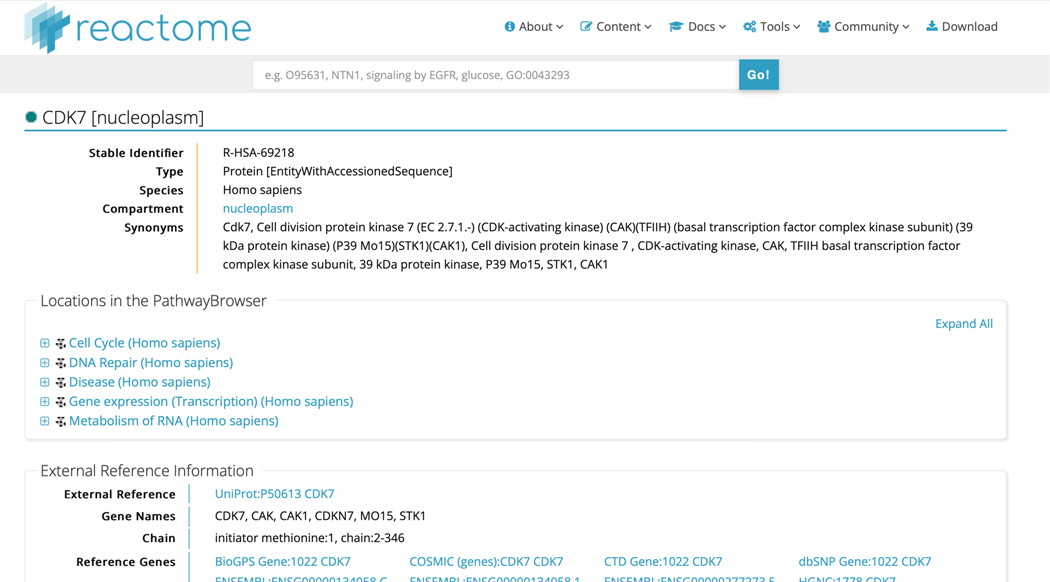
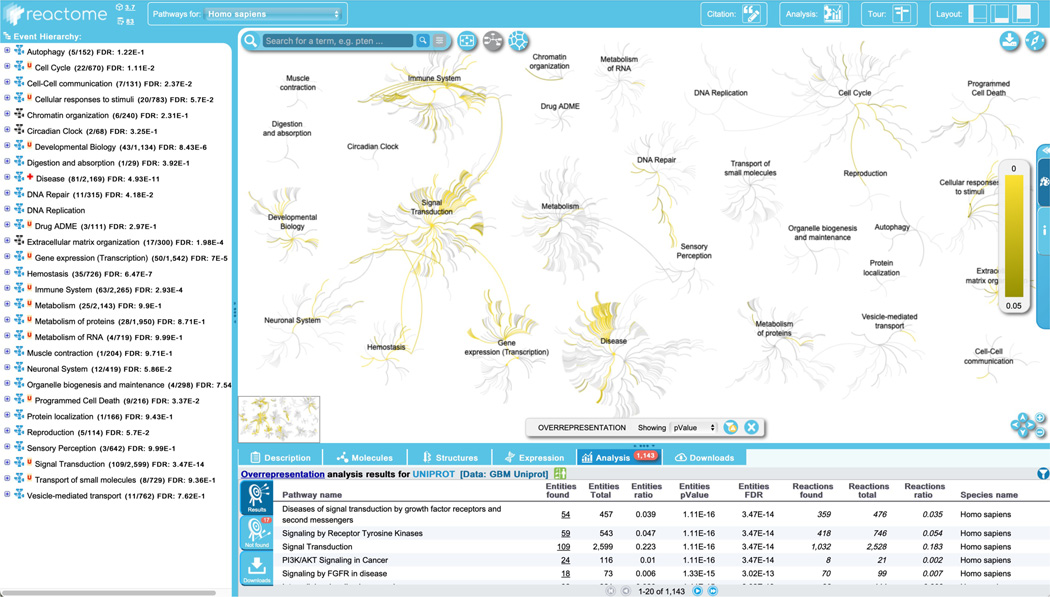
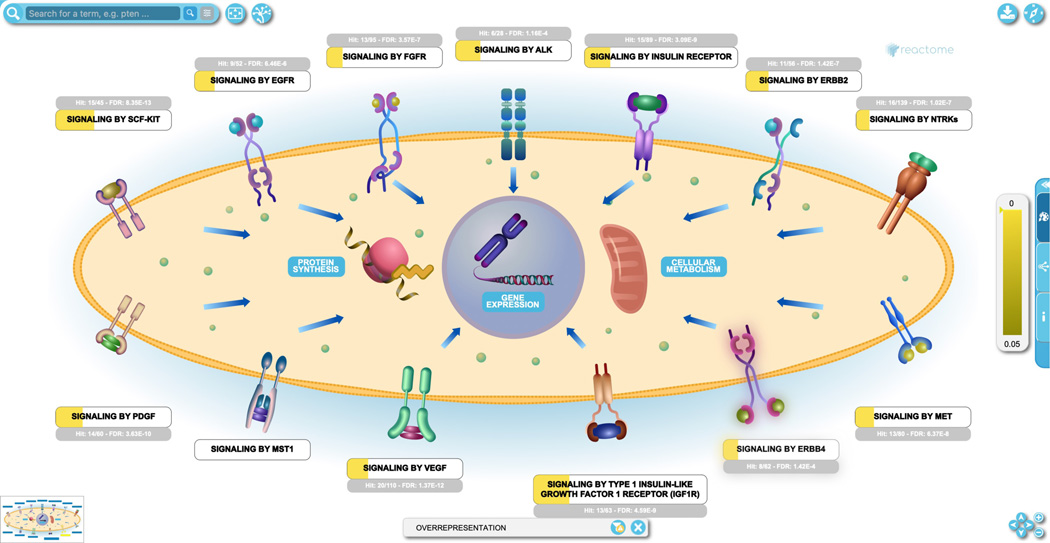
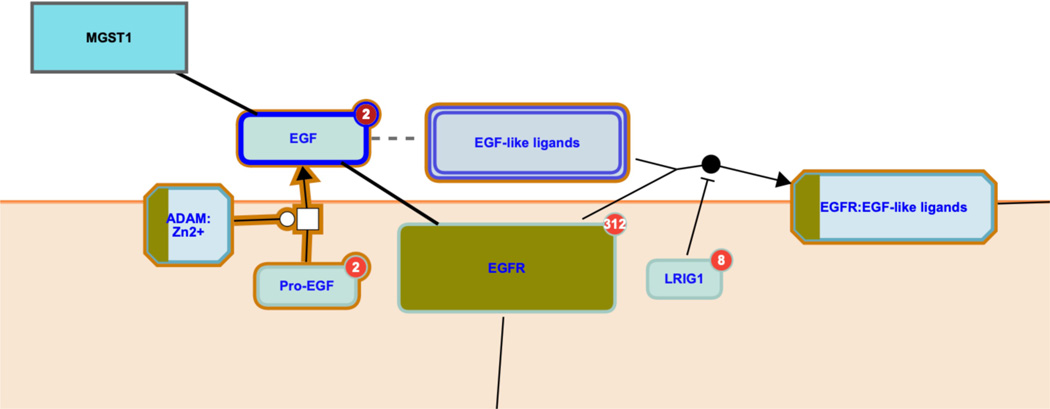
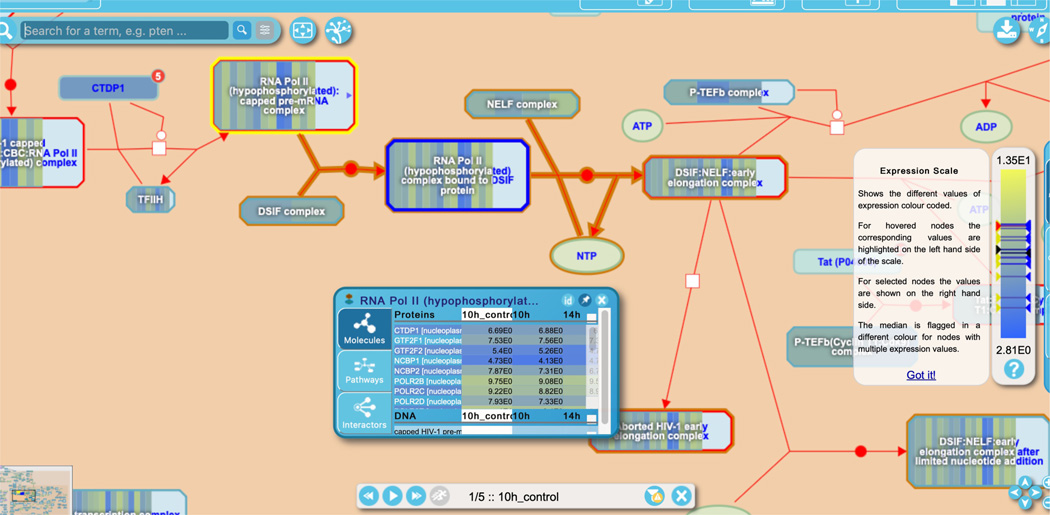
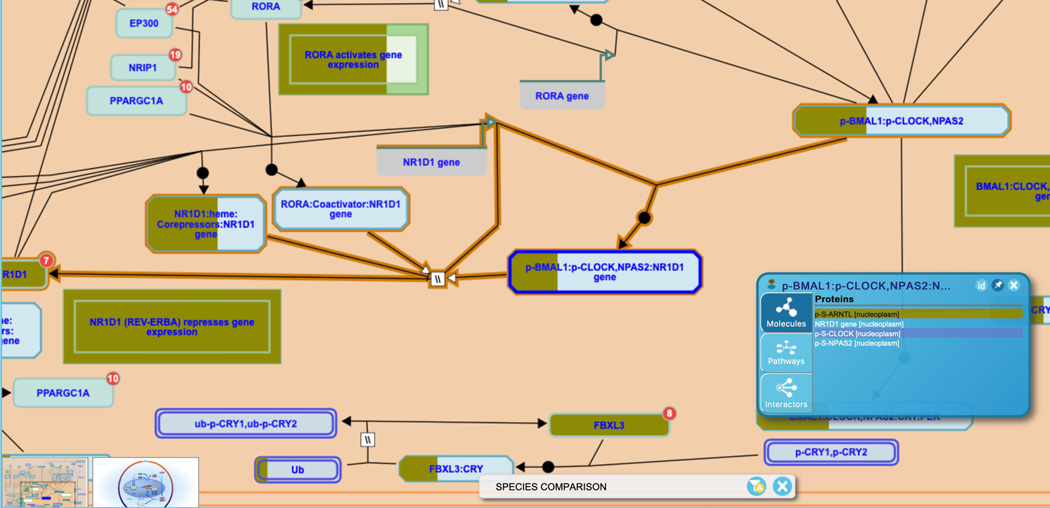
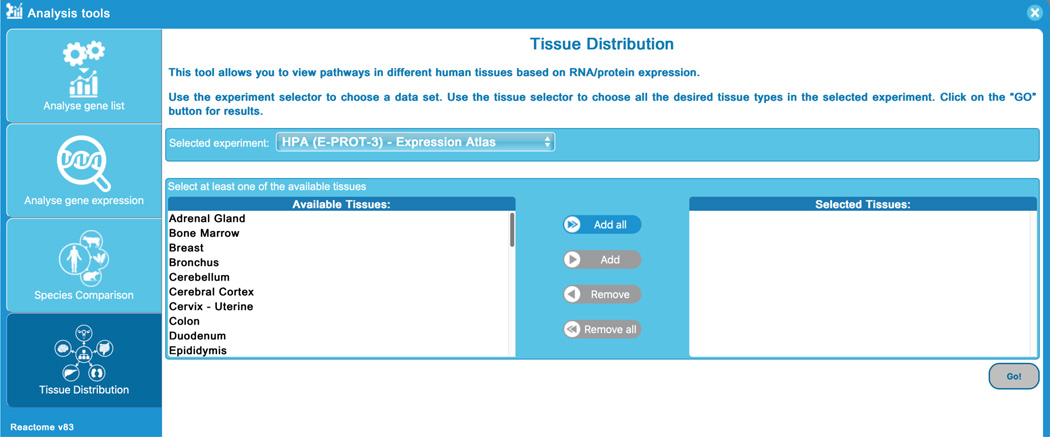
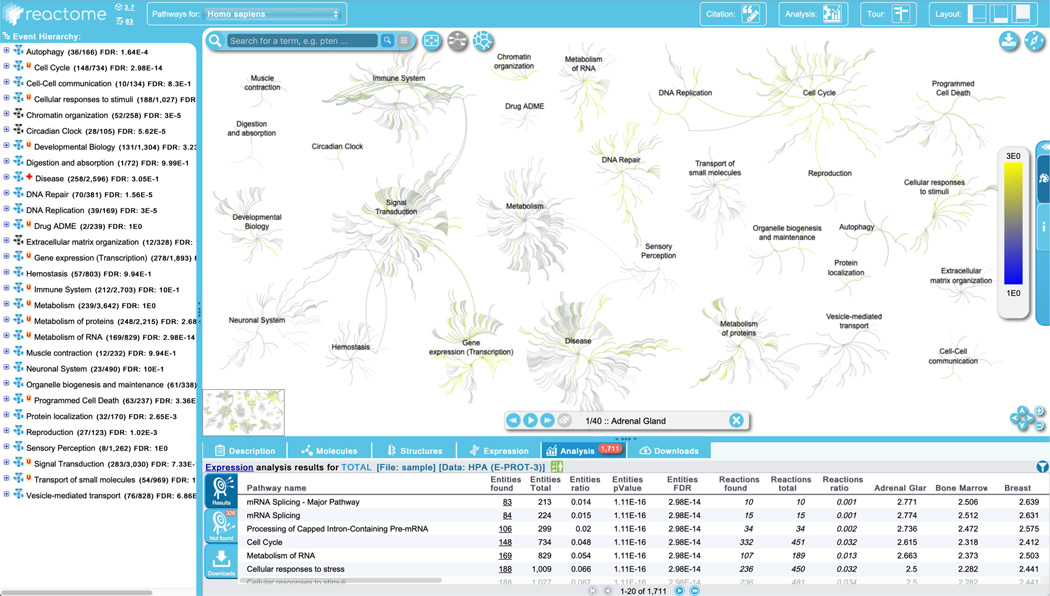
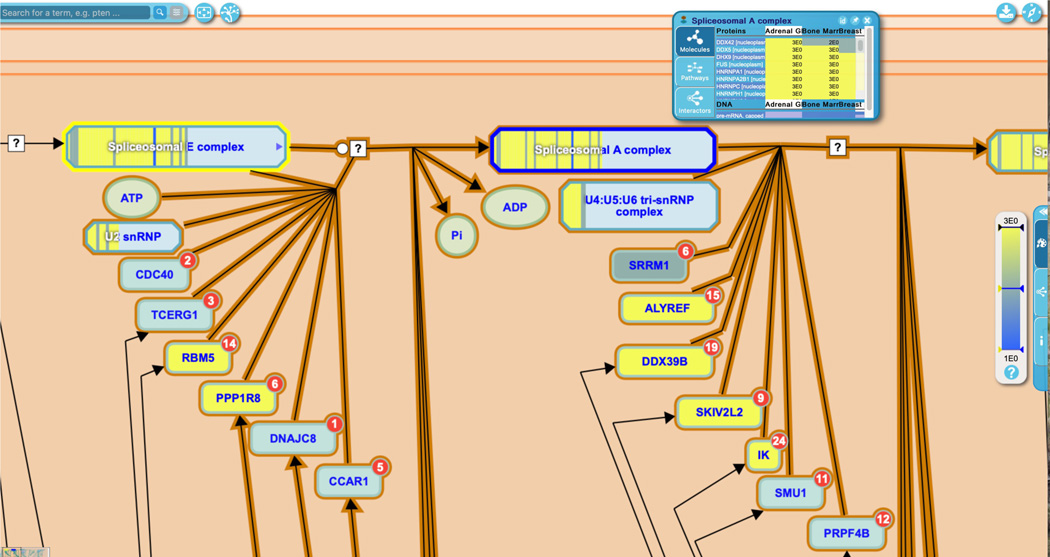
Pathway databases provide descriptions of the roles of proteins, nucleic acids, lipids, carbohydrates, and other molecular entities within their biological cellular contexts. Pathway-centric views of these roles may allow for the discovery of unexpected functional relationships in data such as gene expression profiles and somatic mutation catalogues from tumor cells. For this reason, there is a high demand for high-quality pathway databases and their associated tools. The Reactome project (a collaboration between the Ontario Institute for Cancer Research, New York University Langone Health, the European Bioinformatics Institute, and Oregon Health & Science University) is one such pathway database. Reactome collects detailed information on biological pathways and processes in humans from the primary literature. Reactome content is manually curated, expert-authored, and peer-reviewed and spans the gamut from simple intermediate metabolism to signaling pathways and complex cellular events. This information is supplemented with likely orthologous molecular reactions in mouse, rat, zebrafish, worm, and other model organisms. © 2023 The Authors. Current Protocols published by Wiley Periodicals LLC. Basic Protocol 1: Browsing a Reactome pathway Basic Protocol 2: Exploring Reactome annotations of disease and drugs Basic Protocol 3: Finding the pathways involving a gene or protein Alternate Protocol 1: Finding the pathways involving a gene or protein using UniProtKB (SwissProt), Ensembl, or Entrez gene identifier Alternate Protocol 2: Using advanced search Basic Protocol 4: Using the Reactome pathway analysis tool to identify statistically overrepresented pathways Basic Protocol 5: Using the Reactome pathway analysis tool to overlay expression data onto Reactome pathway diagrams Basic Protocol 6: Comparing inferred model organism and human pathways using the Species Comparison tool Basic Protocol 7: Comparing tissue-specific expression using the Tissue Distribution tool.

Keywords: Reactome database; biological pathway; interaction network; pathway analysis; pathway visualization.


Conflict of interest statement

CONFLICT OF INTEREST STATEMENT:

None declared.

Figures

Figure 1
Figure 1
The Reactome home page (https://reactome.org) features a header panel with drop-down menus to access web content, a search bar and four large buttons linking to key features of the website - Pathway Browser, Analysis Tools, the Reactome FIViz app, and documentation.
Figure 2
Figure 2
The Reactome home page also contains announcements (news, Twitter, research Spotlight, project information), and statistics from the most recent release.
Figure 3
Figure 3
Lower down on the home page is a help panel with buttons linking to guides for users and developers, and buttons for API and data access.
Figure 4
Figure 4
The Pathway Browser, including the event hierarchy (left panel), the details panel (bottom) and the visualization panel displaying the “Pathway Overview” view.
Figure 5
Figure 5
High-level view of the DNA Repair pathway in the Pathway Browser, showing pathway-level summation in the details panel, a zoomed-in view of the Pathway Overview and a thumbnail of the textbook-style illustration in the visualization panel. [*Copyeditor: Two versions of Figure 6 has been provided by the authors. Please pick figure 6v1 for publication and tell the authors that figure 6v1 has been chosen for publication]
Figure 6
Figure 6
A key to the SGBN-based icons used in the molecular level events in Reactome.
Figure 6
Figure 6
A key to the SGBN-based icons used in the molecular level events in Reactome.
Figure 7
Figure 7
Selection of a particular reaction (“XPC binds RAD23 and CETN2” in the “DNA damage and recognition in the GG-NER” pathway) updates the Pathway Browser appropriately.
Figure 8
Figure 8
The reaction “NEIL3 recognizes and binds to spiroiminodihydatoin in telomeric DNA” is inferred from a corresponding reaction in Mus musculus, as evidenced by the double arrowhead beside the event name in the hierarchy.
Figure 9
Figure 9
Proteins that interact with XPC as described in the IntAct database are displayed as a halo around XPC in the visualization panel.
Figure 10
Figure 10
The details of a Reactome catalyst are shown in the context of the reaction “UV-DDB ubiquitinates XPC”.
Figure 11
Figure 11
The Contextual Information Panel (CIP) displays information about a given pathway entity, including constituent molecules, other Reactome pathways where that entity occurs, and interactors.
Figure 12
Figure 12
The textbook-style illustration and the pathway summation for the top-level Disease pathway.
Figure 13
Figure 13
A gain-of-function reaction in the “Constitutive Signaling by Overexpressed ERBB2” pathway.
Figure 14
Figure 14
The details panel identifies the “Functional Status” of the disease entity (here, p-ERBB2 homodimer), describing the underlying genetic changes that result in abnormal molecular behaviour and disease outcomes.
Figure 15
Figure 15
The details panel captures precise information about post-translational modifications to pathway entities.
Figure 16
Figure 16
Reactome captures the effect of therapeutics on pathway events where possible and links the therapeutics to appropriate external resources in the details panel.
Figure 17a
Figure 17a
A list of the members and candidates of the “ERBB2 KD mutants” set is revealed by clicking on the “+” symbol on the right side of the details panel after the disease complex is selected in the pathway diagram.
Figure 17b
Figure 17b
Detailed molecular information about the genetic changes that give rise to mutant ERBB2 L755P is displayed by clicking on the “+” symbol to the right of the variant name in the details panel Linkouts to appropriate databases and ontologies are provided.
Figure 17c
Figure 17c
Further cross-references are available by clicking on the green circle to the left of the disease entity name.
Figure 18
Figure 18
Loss-of-function reaction “Resistant ERBB2 KD mutants do no bind trastuzumab” is shown with the loss-of-function entity bordered by a broken red line and the output of the failed reaction crossed out.
Figure 19a
Figure 19a
Infectious diseases and processes are novel events with no normal counterparts. They are laid out in their own diagrams and are shown interacting with and modulating the function of normal entities and events, as shown here for the SARS-CoV-2 subpathway “SARS-CoV-2 host interactions”.
Figure 19b
Figure 19b
Encapsulated pathway icons like “SARS-CoV-2 host interactions” shown here provide connections between pathways that share entities or events.
Figure 20
Figure 20
Pathway diagrams can be overlaid with disease associations taken from DisGeNet, as shown here for the protein MAP1LC3B.
Figure 21
Figure 21
The results page from a simple CDK7 search on the Reactome home page are shown here.
Figure 22
Figure 22
The CDK7 reference entity page.
Figure 23
Figure 23
The Pathway Overview showing results of an overrepresentation analysis using the “Analyse Gene list” tool with a list of UniProtKB identifiers.
Figure 24
Figure 24
Results of an overrepresentation analysis overlaid on the interactive textbook-style illustration for the “Signaling by Receptor Tyrosine Kinases” pathway.
Figure 25
Figure 25
Overrepresentation analysis displayed at the entity level for the reactions in the “Signaling by EGFR” pathway. Interactors for EGF are displayed.
Figure 26
Figure 26
Results from a gene expression analysis using the “Analyse Gene list” tool are overlaid on entities in a reaction from the “HIV Infection” pathway.
Figure 27
Figure 27
Results from the Species Comparison tool, showing conservation of entities and events from the “Circadian Clock” pathway in mouse.
Figure 28
Figure 28
View of the data selection panel in the Tissue Distribution tool.
Figure 29
Figure 29
Pathway Overview display of the Tissue Distribution analysis results.
Figure 30
Figure 30
Results of a Tissue Distribution analysis displayed at the entity and reaction level on the pathway “Processing of Capped Intron-containing Pre-mRNA”.

Similar articles

Cited by

References

    1. Armstrong DR, Berrisford JM, Conroy MJ, et al. PDBe: improved findability of macromolecular structure data in the PDB. Nucleic Acids Res. 2020;48(D1):D335–D343. doi:10.1093/nar/gkz990 - DOI - PMC - PubMed
    1. Bansal P, Morgat A, Axelsen KB, et al. Rhea, the reaction knowledgebase in 2022. Nucleic Acids Res. 2022;50(D1):D693–D700. doi:10.1093/nar/gkab1016 - DOI - PMC - PubMed
    1. Benjamini Y, & Hochberg Y. (1995). Controlling the False Discovery Rate: A Practical and Powerful Approach to Multiple Testing. Journal of the Royal Statistical Society. Series B (Methodological), 57(1), 289–300.
    1. Blucher AS, McWeeney SK, Stein L, & Wu G. (2019). Visualization of drug target interactions in the contexts of pathways and networks with ReactomeFIViz. F1000Research, 8, 908. 10.12688/f1000research.19592.1 - DOI - PMC - PubMed
    1. Bohler A, Wu G, Kutmon M, Pradhana LA, Coort SL, Hanspers K, Haw R, Pico AR, & Evelo CT (2016). Reactome from a WikiPathways Perspective. PLoS computational biology, 12(5), e1004941. 10.1371/journal.pcbi.1004941 - DOI - PMC - PubMed

LinkOut - more resources