

The relative importance of key meteorological factors affecting numbers of mosquito vectors of dengue fever
- PMID: 37053307
- PMCID: PMC10128945
- DOI: 10.1371/journal.pntd.0011247
The relative importance of key meteorological factors affecting numbers of mosquito vectors of dengue fever
Abstract
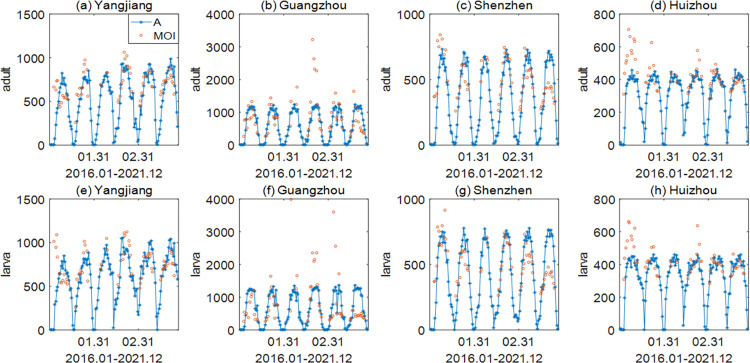
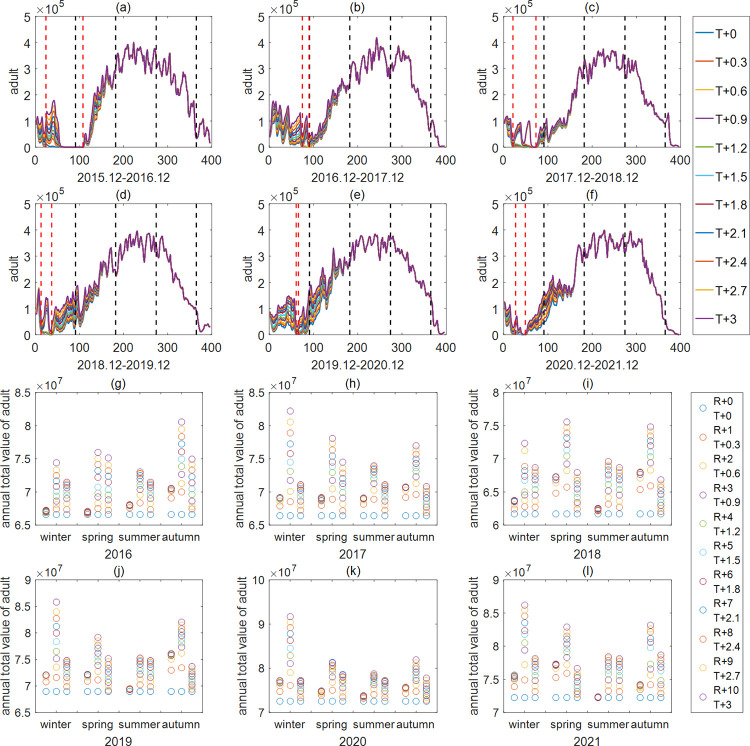
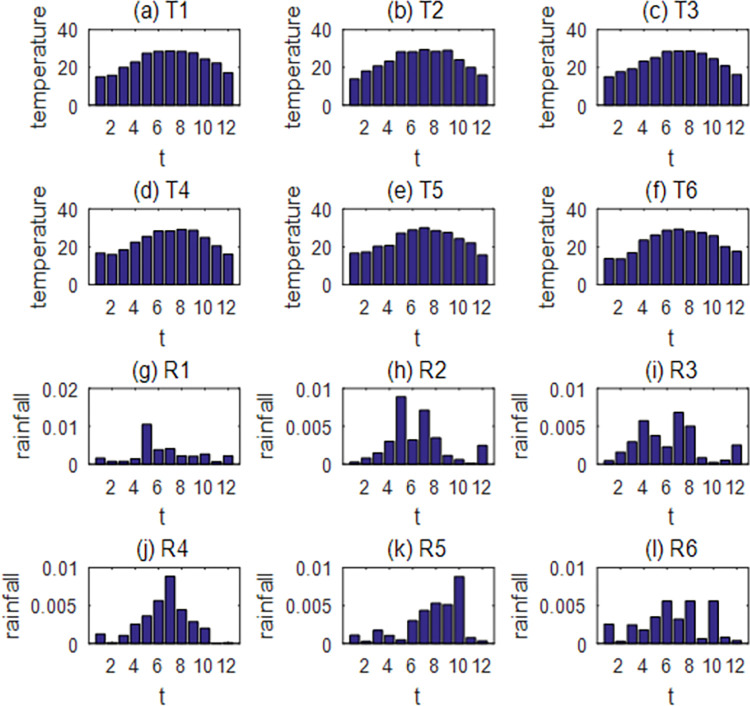
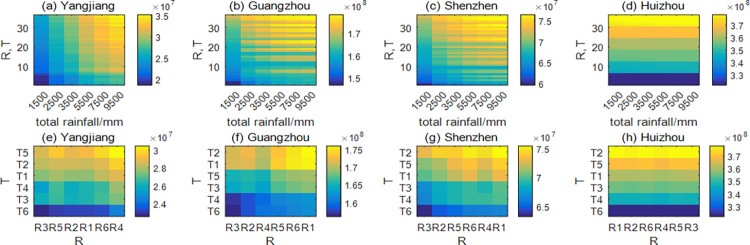
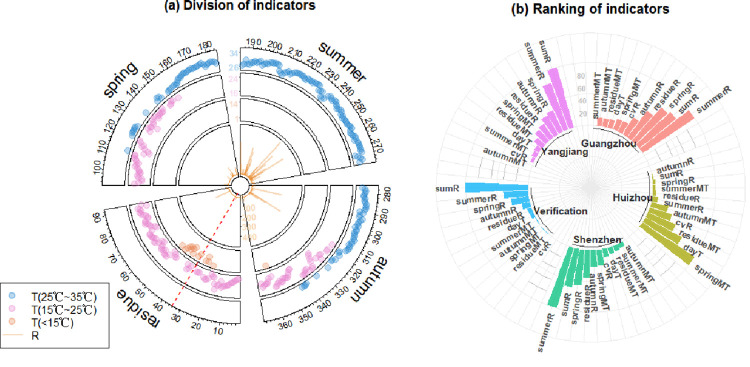
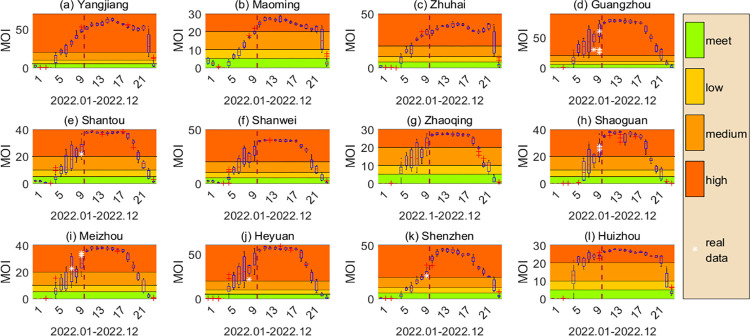
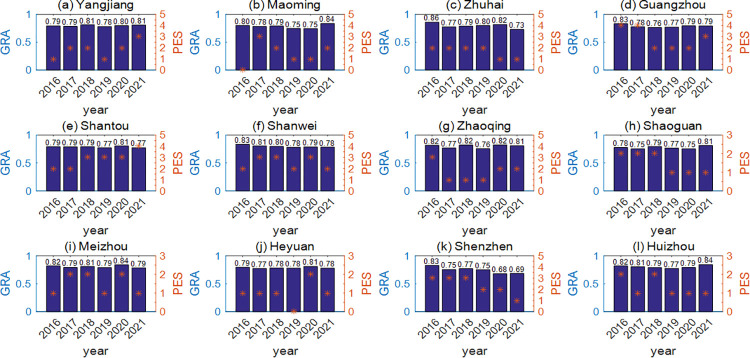
Although single factors such as rainfall are known to affect the population dynamics of Aedes albopictus, the main vector of dengue fever in Eurasia, the synergistic effects of different meteorological factors are not fully understood. To address this topic, we used meteorological data and mosquito-vector association data including Breteau and ovitrap indices in key areas of dengue outbreaks in Guangdong Province, China, to formulate a five-stage mathematical model for Aedes albopictus population dynamics by integrating multiple meteorological factors. Unknown parameters were estimated using a genetic algorithm, and the results were analyzed by k-Shape clustering, random forest and grey correlation analysis. In addition, the population density of mosquitoes in 2022 was predicted and used for evaluating the effectiveness of the model. We found that there is spatiotemporal heterogeneity in the effects of temperature and rainfall and their distribution characteristics on the diapause period, the numbers of peaks in mosquito densities in summer and the annual total numbers of adult mosquitoes. Moreover, we identified the key meteorological indicators of the mosquito quantity at each stage and that rainfall (seasonal rainfall and annual total rainfall) was more important than the temperature distribution (seasonal average temperature and temperature index) and the uniformity of rainfall annual distribution (coefficient of variation) for most of the areas studied. The peak rainfall during the summer is the best indicator of mosquito population development. The results provide important theoretical support for the future design of mosquito vector control strategies and early warnings of mosquito-borne diseases.
Copyright: © 2023 Liu et al. This is an open access article distributed under the terms of the Creative Commons Attribution License, which permits unrestricted use, distribution, and reproduction in any medium, provided the original author and source are credited.
Conflict of interest statement
The authors have declared that no competing interests exist.
Figures

Similar articles
-
Effect of meteorological factors on the seasonal prevalence of dengue vectors in upland hilly and lowland Terai regions of Nepal.Parasit Vectors. 2019 Jan 18;12(1):42. doi: 10.1186/s13071-019-3304-3. Parasit Vectors. 2019. PMID: 30658693 Free PMC article.
-
Meteorological variables and mosquito monitoring are good predictors for infestation trends of Aedes aegypti, the vector of dengue, chikungunya and Zika.Parasit Vectors. 2017 Feb 13;10(1):78. doi: 10.1186/s13071-017-2025-8. Parasit Vectors. 2017. PMID: 28193291 Free PMC article.
-
Evaluation of the Effects of Aedes Vector Indices and Climatic Factors on Dengue Incidence in Gampaha District, Sri Lanka.Biomed Res Int. 2019 Jan 31;2019:2950216. doi: 10.1155/2019/2950216. eCollection 2019. Biomed Res Int. 2019. PMID: 30834259 Free PMC article.
-
The Density of Aedes albopictus in a High-Latitude and High-Risk Dengue Fever Transmission Region in Shandong Province, Northern China.Vector Borne Zoonotic Dis. 2023 Aug;23(8):411-418. doi: 10.1089/vbz.2023.0003. Epub 2023 Jun 30. Vector Borne Zoonotic Dis. 2023. PMID: 37389829
-
Ovitrap surveillance of dengue vector mosquitoes in Bandung City, West Java Province, Indonesia.PLoS Negl Trop Dis. 2021 Oct 28;15(10):e0009896. doi: 10.1371/journal.pntd.0009896. eCollection 2021 Oct. PLoS Negl Trop Dis. 2021. PMID: 34710083 Free PMC article.
Cited by
-
Assessing the influencing factors of dengue fever in Chinese mainland based on causal analysis.Sci Rep. 2025 May 1;15(1):15311. doi: 10.1038/s41598-025-00218-9. Sci Rep. 2025. PMID: 40312495 Free PMC article.
-
Integrating dynamic models and neural networks to discover the mechanism of meteorological factors on Aedes population.PLoS Comput Biol. 2024 Sep 27;20(9):e1012499. doi: 10.1371/journal.pcbi.1012499. eCollection 2024 Sep. PLoS Comput Biol. 2024. PMID: 39331695 Free PMC article.
-
A novel approach to quantify the optimal range and causal effect of rainfall on vector-borne diseases: a case study of dengue epidemics.J R Soc Interface. 2025 Jun;22(227):20250029. doi: 10.1098/rsif.2025.0029. Epub 2025 Jun 25. J R Soc Interface. 2025. PMID: 40555387
-
Spatial and temporal characterization of Aedes albopictus oviposition activity in candidate urban settings for sterile insect technique testing in La Reunion Island.Infect Dis Poverty. 2024 Oct 25;13(1):78. doi: 10.1186/s40249-024-01250-z. Infect Dis Poverty. 2024. PMID: 39456106 Free PMC article.
-
Ecological features and insecticide resistance of Aedes albopictus in Xi'an, a high-risk dengue transmission area in China.PeerJ. 2024 Oct 22;12:e18246. doi: 10.7717/peerj.18246. eCollection 2024. PeerJ. 2024. PMID: 39465170 Free PMC article.
References
-
- da Cruz Ferreira DA, Degener CM, de Almeida Marques-Toledo C, Bendati MM, Fetzer LO, Teixeira CP, et al.. Meteorological variables and mosquito monitoring are good predictors for infestation trends of Aedes aegypti, the vector of dengue, chikungunya and Zika. Parasit Vectors. 2017; 10: 78. doi: 10.1186/s13071-017-2025-8 - DOI - PMC - PubMed
Publication types
MeSH terms
LinkOut - more resources
Full Text Sources
Medical
