. 2023 Apr 14;380(6641):203-210.
doi: 10.1126/science.abp9563. Epub 2023 Apr 13.

Engineered skin bacteria induce antitumor T cell responses against melanoma

Affiliations

Engineered skin bacteria induce antitumor T cell responses against melanoma

Y Erin Chen et al. Science. .

Abstract

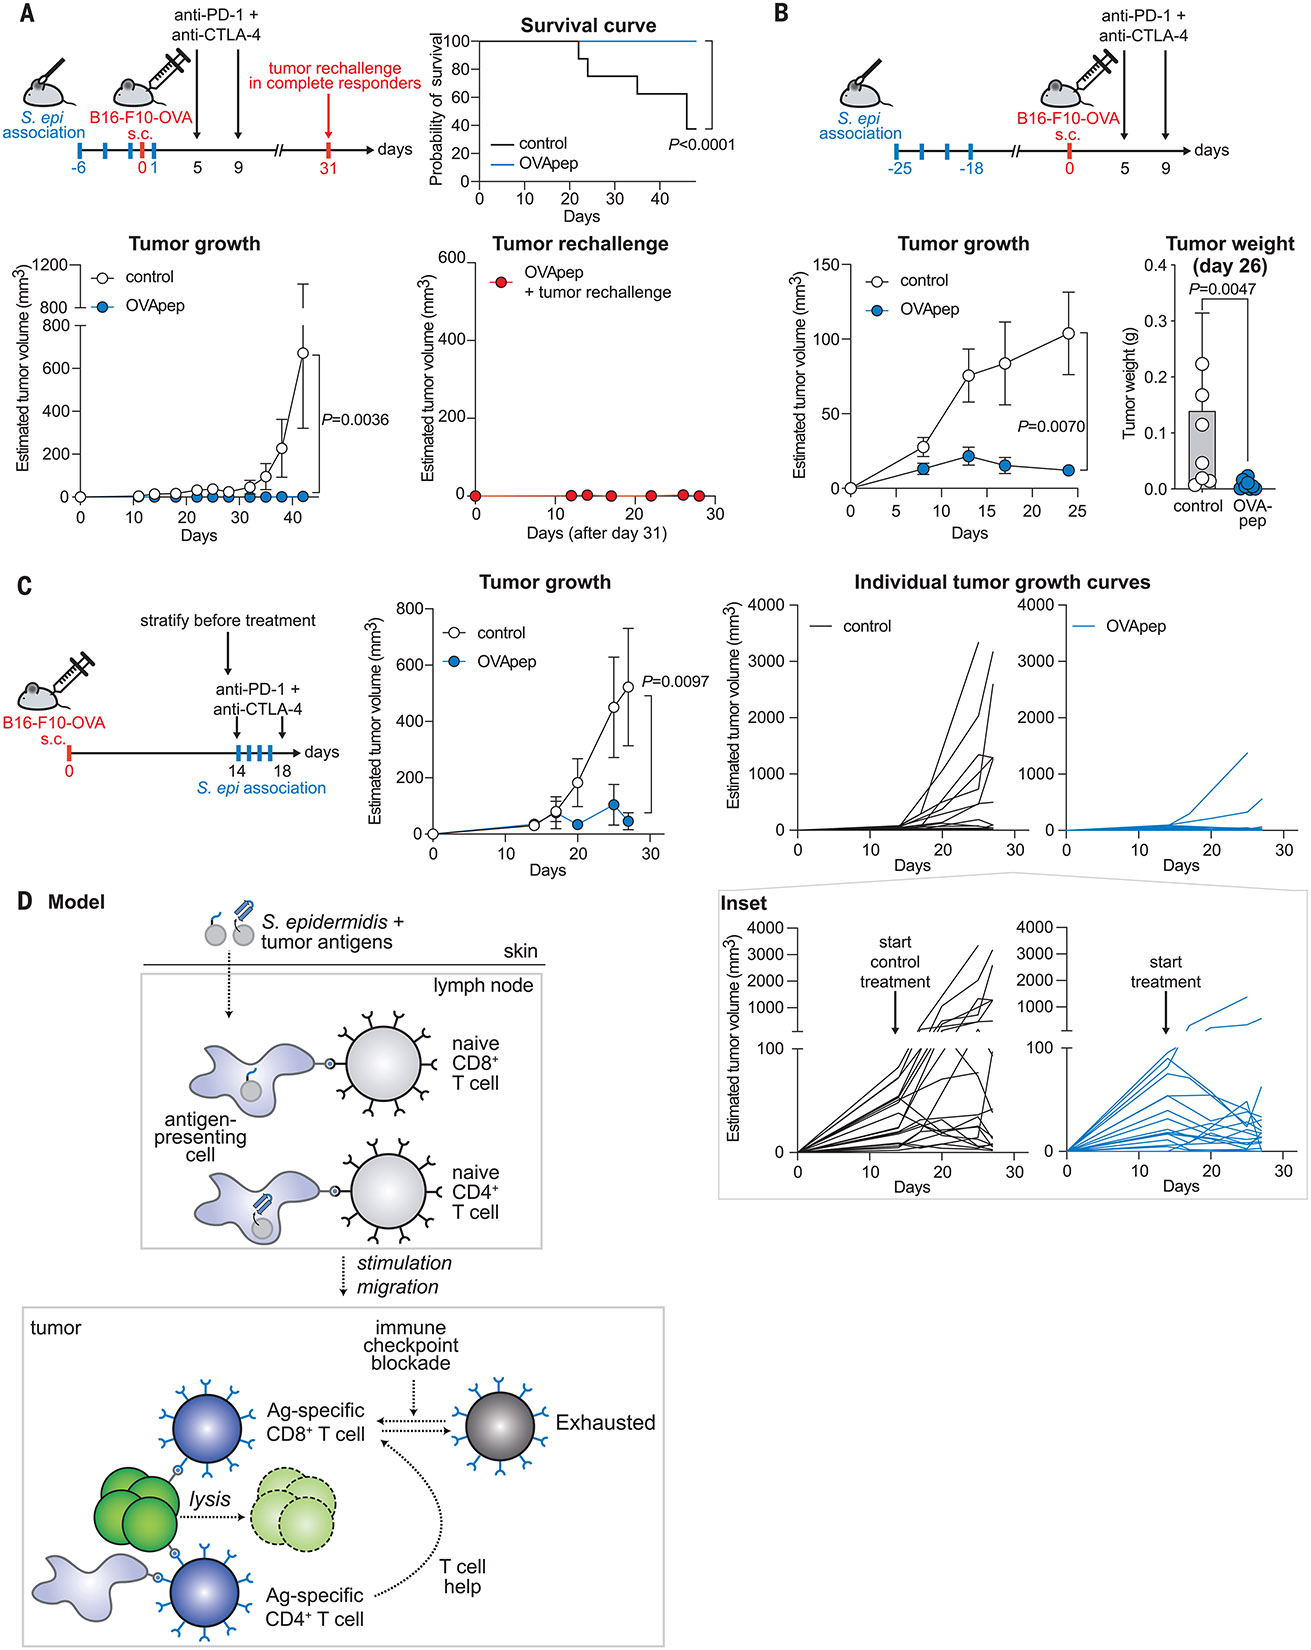
Certain bacterial colonists induce a highly specific T cell response. A hallmark of this encounter is that adaptive immunity develops preemptively, in the absence of an infection. However, the functional properties of colonist-induced T cells are not well defined, limiting our ability to understand anticommensal immunity and harness it therapeutically. We addressed both challenges by engineering the skin bacterium Staphylococcus epidermidis to express tumor antigens anchored to secreted or cell-surface proteins. Upon colonization, engineered S. epidermidis elicits tumor-specific T cells that circulate, infiltrate local and metastatic lesions, and exert cytotoxic activity. Thus, the immune response to a skin colonist can promote cellular immunity at a distal site and can be redirected against a target of therapeutic interest by expressing a target-derived antigen in a commensal.


Figures

Fig. 1.
Fig. 1.. Engineering S. epidermidis to express non-native antigens.
(A) Experimental approach. By colonizing mice with an engineered strain of S. epidermidis that expresses a tumor antigen, we elicit T cells in vivo that are licensed by the commensal immune program but specific for a tumor. These T cells can then be subjected to functional assays in vivo, such as tumor killing. (B) Schematic of the genetic system that we developed for S. epidermidis. Advances include improved preparation of DNA and competent cells (materials and methods). Staphylococcus is subjected to heat shock before (Method #1) or after (Method #2) electroporation with the plasmid. (C) Phylogenetic tree of S. epidermidis and S. aureus strains. Circles indicate the strains for which our transformation method was successful (green) or unsuccessful (magenta). Strains in bold were not previously published as genetically tractable. (D) Design of the ovalbumin (OVA)–derived constructs expressed in S. epidermidis and their predicted localization. OVA is expressed either as a full-length protein (OVA), a class I major histocompatibility complex (MHC)–restricted antigenic peptide (OT-I, “1”), or a class II MHC-restricted antigenic peptide (OT-II, “2”). RBS, ribosome binding site; Ppen, promoter; bp, base pair.
Fig. 2.
Fig. 2.. Engineered S. epidermidis strains slow tumor progression and stimulate antigen-specific T cells in vivo.
(A) Experimental schematic. Mice are naïve or colonized with live or heat-killed (HK; 95°C for 30 min) S. epidermidis strains (shown in box; OT-I, “1”; OT-II, “2”) on days −6 to +1. When HK is used, mice are associated twice weekly throughout the entire experiment. On day 0, B16-F0-OVA melanoma cells are injected subcutaneously into the flank. Tissues are collected for analysis on days 14 or 21. (B) (Left) Day 19 blinded caliper measurements of subcutaneous B16-F0-OVA tumors (n = 5 to 10 mice per group). (Middle) Day 21 masses of dissected tumors (n = 24 to 28 mice per group). (Right) Blinded caliper measurements of tumors over time (n = 16 mice per group). (C) (Left) Blinded caliper measurements over time and (right) masses of subcutaneous B16-F0-OVA tumors on day 21 from mice associated with live or HK strains (gray dots). (D) Frequency of OT-I-specific T cells in the indicated organs as measured by H2-Kb-SIINFEKL tetramer staining or IFN-γ+ ELISpot assay at day 14. Tetramer staining is gated on live CD90.2+TCRβ+CD8β+ cells. (E) Endpoint caliper measurements of tumors from S. epidermidis–associated mice treated or not with anti-CD8α (2.43) or anti-TCRb (H57-597) neutralizing antibodies (dark blue dots) (n = 4 to 9 mice per group). (F) Masses of subcutaneous B16-F0-OVA tumors on day 21 from mice colonized with S. epidermidis harboring control or various OVA constructs (n = 8 to 10 mice per group). For tumor burden bar graphs, nonparametric testing was used to generate P values (Mann-Whitney U test for two groups and Kruskal-Wallis H test for more than two groups). For flow cytometry data, parametric testing was used (unpaired Student’s t test). For tumor-growth time courses, two-way analysis of variance (ANOVA, mixed-effects model) with multiple comparison testing was used. All experiments show unilateral tumors pooled from two [(B), left and right, (E), and (F)] or three [(B), middle] independent experiments.
Fig. 3.
Fig. 3.. Engineered S. epidermidis strains slow the progression of metastatic tumors.
(A) Study design. Mice associated with S. epidermidis strains are injected intravenously (day 0) with B16-F10-OVA melanoma cells that constitutively express luciferase (OT-I, “1”). (B) Schematic of neoantigen expression constructs and their predicted subcellular localization within S. epidermidis. The neoantigen sequence (red box) encodes peptides centered around Obsl1(T1764M) for the wall-attached construct (wB16Ag) or Ints11(D314N) for the secreted construct (sB16Ag). (C) Average measurement of tumor bioluminescence over time (n = 20 mice per group, two experiments pooled). (D) Treatment of metastatic B16-F10-OVA melanoma with association of S. epi-OVApep. (Left) Tumor burden over time as quantified by bioluminescence imaging. (Middle) Frequency of OT-I–specific T cells in the spleen at days 14 and 21 by H2-Kb-SIINFEKL tetramer staining. Cells are gated on live CD90.2+ TCRβ+ CD8β+ cells. (Right) Frequency of tetramer+ CD8+ T cells versus tumor radiance. (E) Memory cell phenotypes of tetramer+ CD8+ T cells in the spleens of control or treated mice with metastatic melanoma. SCM, stem cell–like memory; CM, central memory; EM, effector memory. For tumor burden bar graphs, nonparametric testing was used to generate P values (Mann-Whitney U test for two groups and Kruskal-Wallis H test for more than two groups). For flow cytometry data, parametric testing was used (unpaired Student’s t test). For tumor growth time courses, two-way ANOVA (mixed-effects model) with multiple comparison testing was used.
Fig. 4.
Fig. 4.. Engineered S. epidermidis synergizes with immune checkpoint blockade.
(A) Treatment of subcutaneous B16-F10-OVA melanoma with immune checkpoint blockade after preassociation with S. epi-OVApep. (Bottom left) Blinded caliper measurements (n = 8 mice, bilateral tumors). (Top right) Kaplan-Meier survival curve. P value generated by the log-rank (Mantel-Cox) test. (Bottom right) Fourteen of 16 responders initially injected with unilateral tumors were rechallenged (in the opposite flank) without receiving any additional treatment. The graph depicts caliper measurements of the rechallenged left-flank tumors. (B) Vaccination against subcutaneous B16-F10-OVA melanoma by associating with S. epi-OVApep 25 days before tumor cell injection. (Bottom left) Blinded caliper measurements (n = 8 mice, unilateral tumors). (Bottom right) Day 26 masses of dissected tumors (n = 8 mice). (C) Treatment of established B16-F10-OVA melanoma with immune checkpoint blockade and topical S. epi-OVApep 14 days after tumor cell injection. On day 14, before the initiation of treatment, mice with no tumors or particularly large tumors (>100 mm3) were excluded from the analysis. Blinded caliper measurements are shown (middle) averaged or (right) as growth curves of individual tumors. Inset with segmented y axis shows tumors initially growing and then regressing after treatment (n = 19 to 20 mice, unilateral tumors). For bar graphs, the Mann-Whitney U test was used to generate P values. For tumor growth time courses, two-way ANOVA with multiple comparison testing was used. (D) Model: Engineered strains of S. epidermidis colonize the skin and induce antigen-presenting cells to stimulate antigen-specific T cells, which traffic to the tumor and restrict tumor growth. Immune checkpoint blockade synergizes with engineered commensals. All data shown are representative of two independent experiments.

Comment in

References

    1. Yang Y et al. , Nature 510, 152–156 (2014). - PMC - PubMed
    1. Naik S et al. , Science 337, 1115–1119 (2012). - PMC - PubMed
    1. Naik S et al. , Nature 520, 104–108 (2015). - PMC - PubMed
    1. Scharschmidt TC et al. , Immunity 43, 1011–1021 (2015). - PMC - PubMed
    1. Ridaura VK et al. , J. Exp. Med 215, 785–799 (2018). - PMC - PubMed

MeSH terms

Substances