. 2023 Apr 14;380(6641):eabn7113.
doi: 10.1126/science.abn7113. Epub 2023 Apr 14.

The origins and functional effects of postzygotic mutations throughout the human life span

Affiliations

The origins and functional effects of postzygotic mutations throughout the human life span

Nicole B Rockweiler et al. Science. .

Abstract

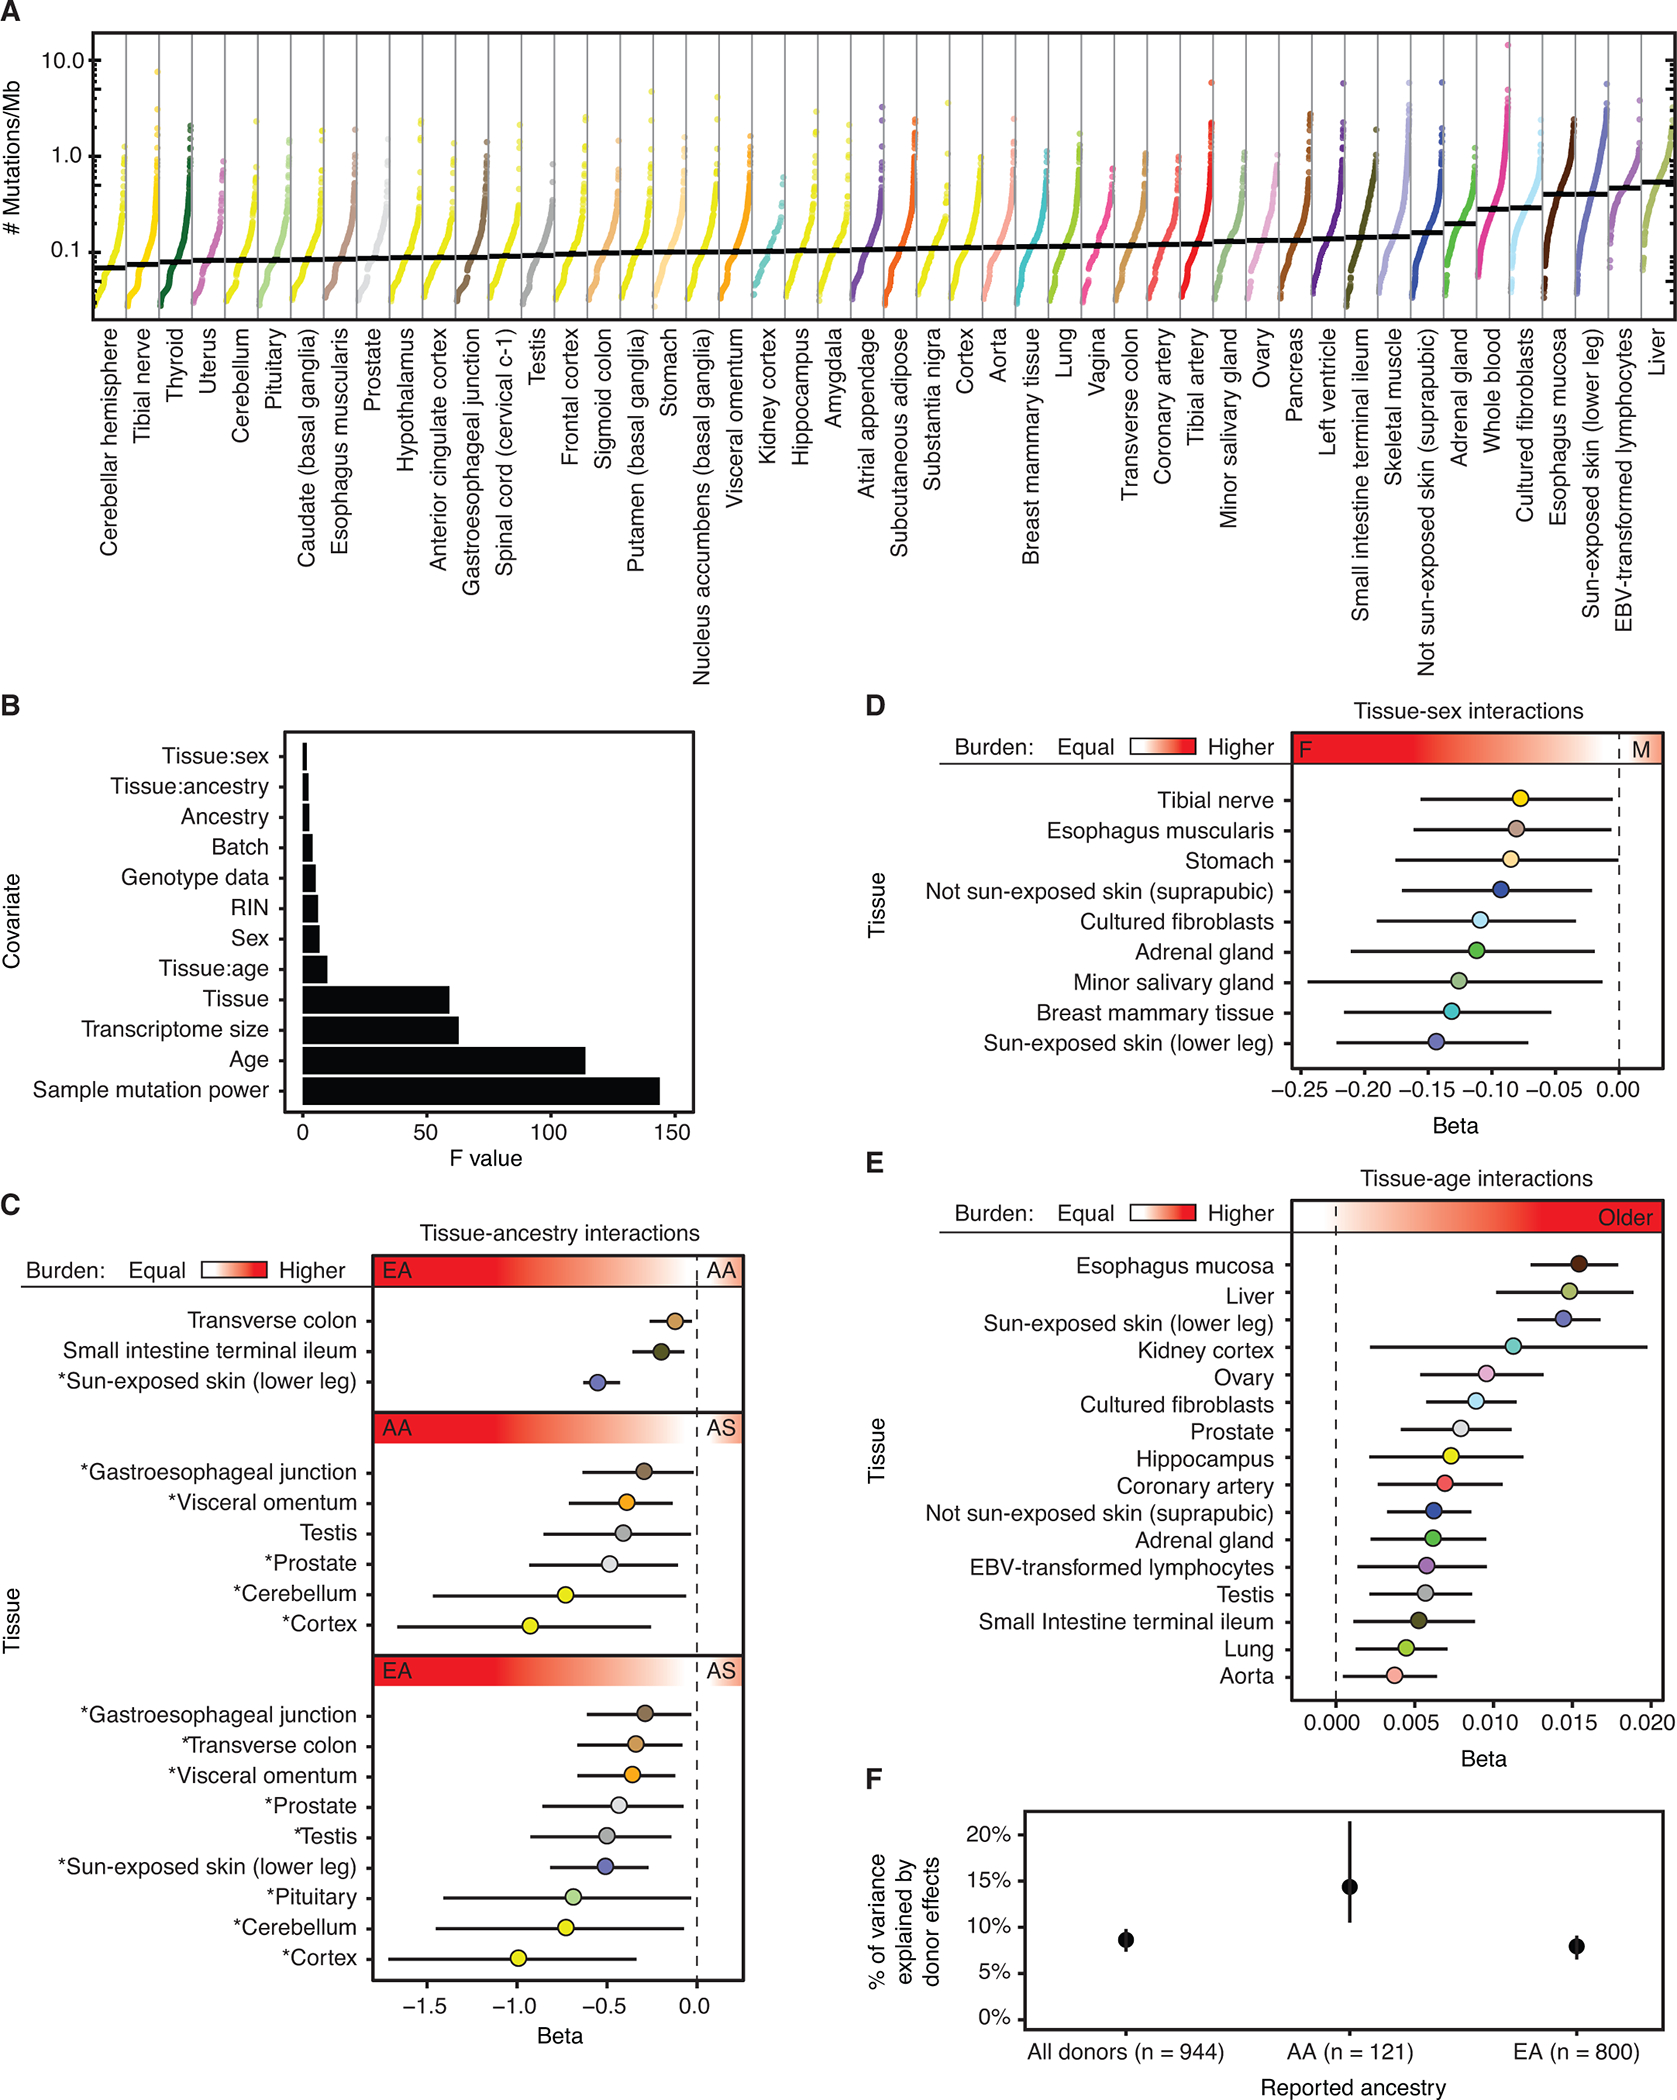
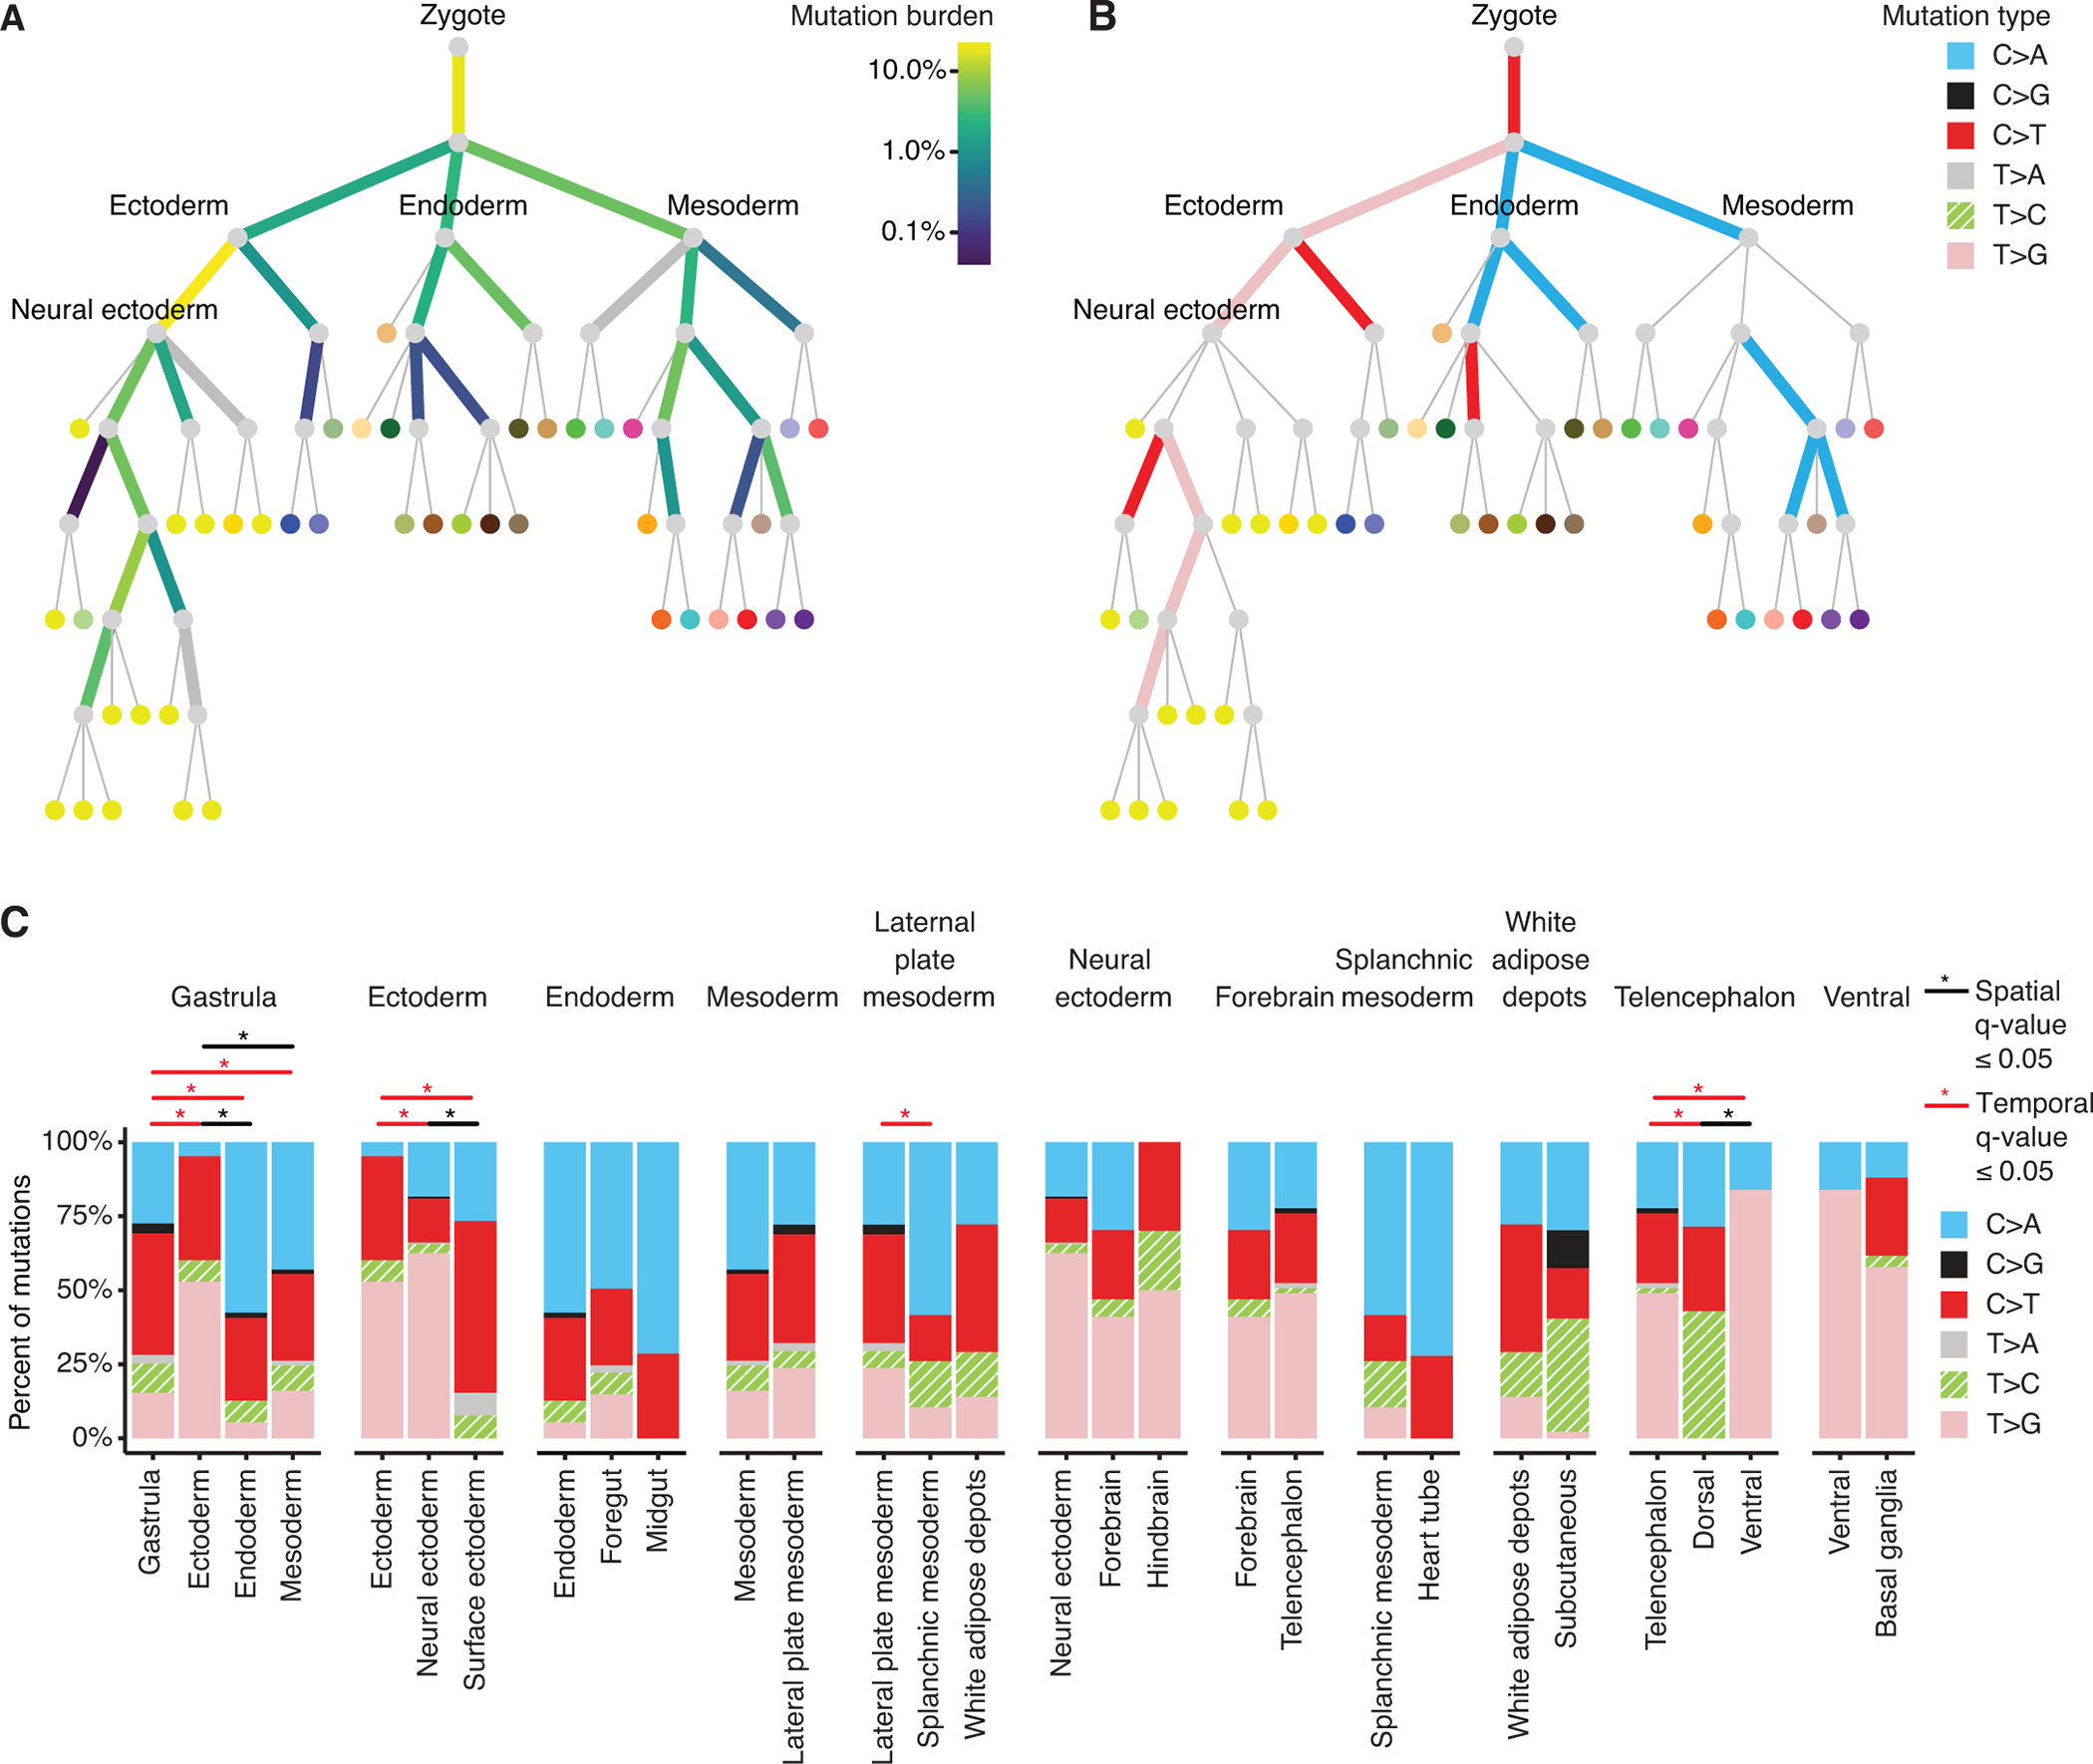
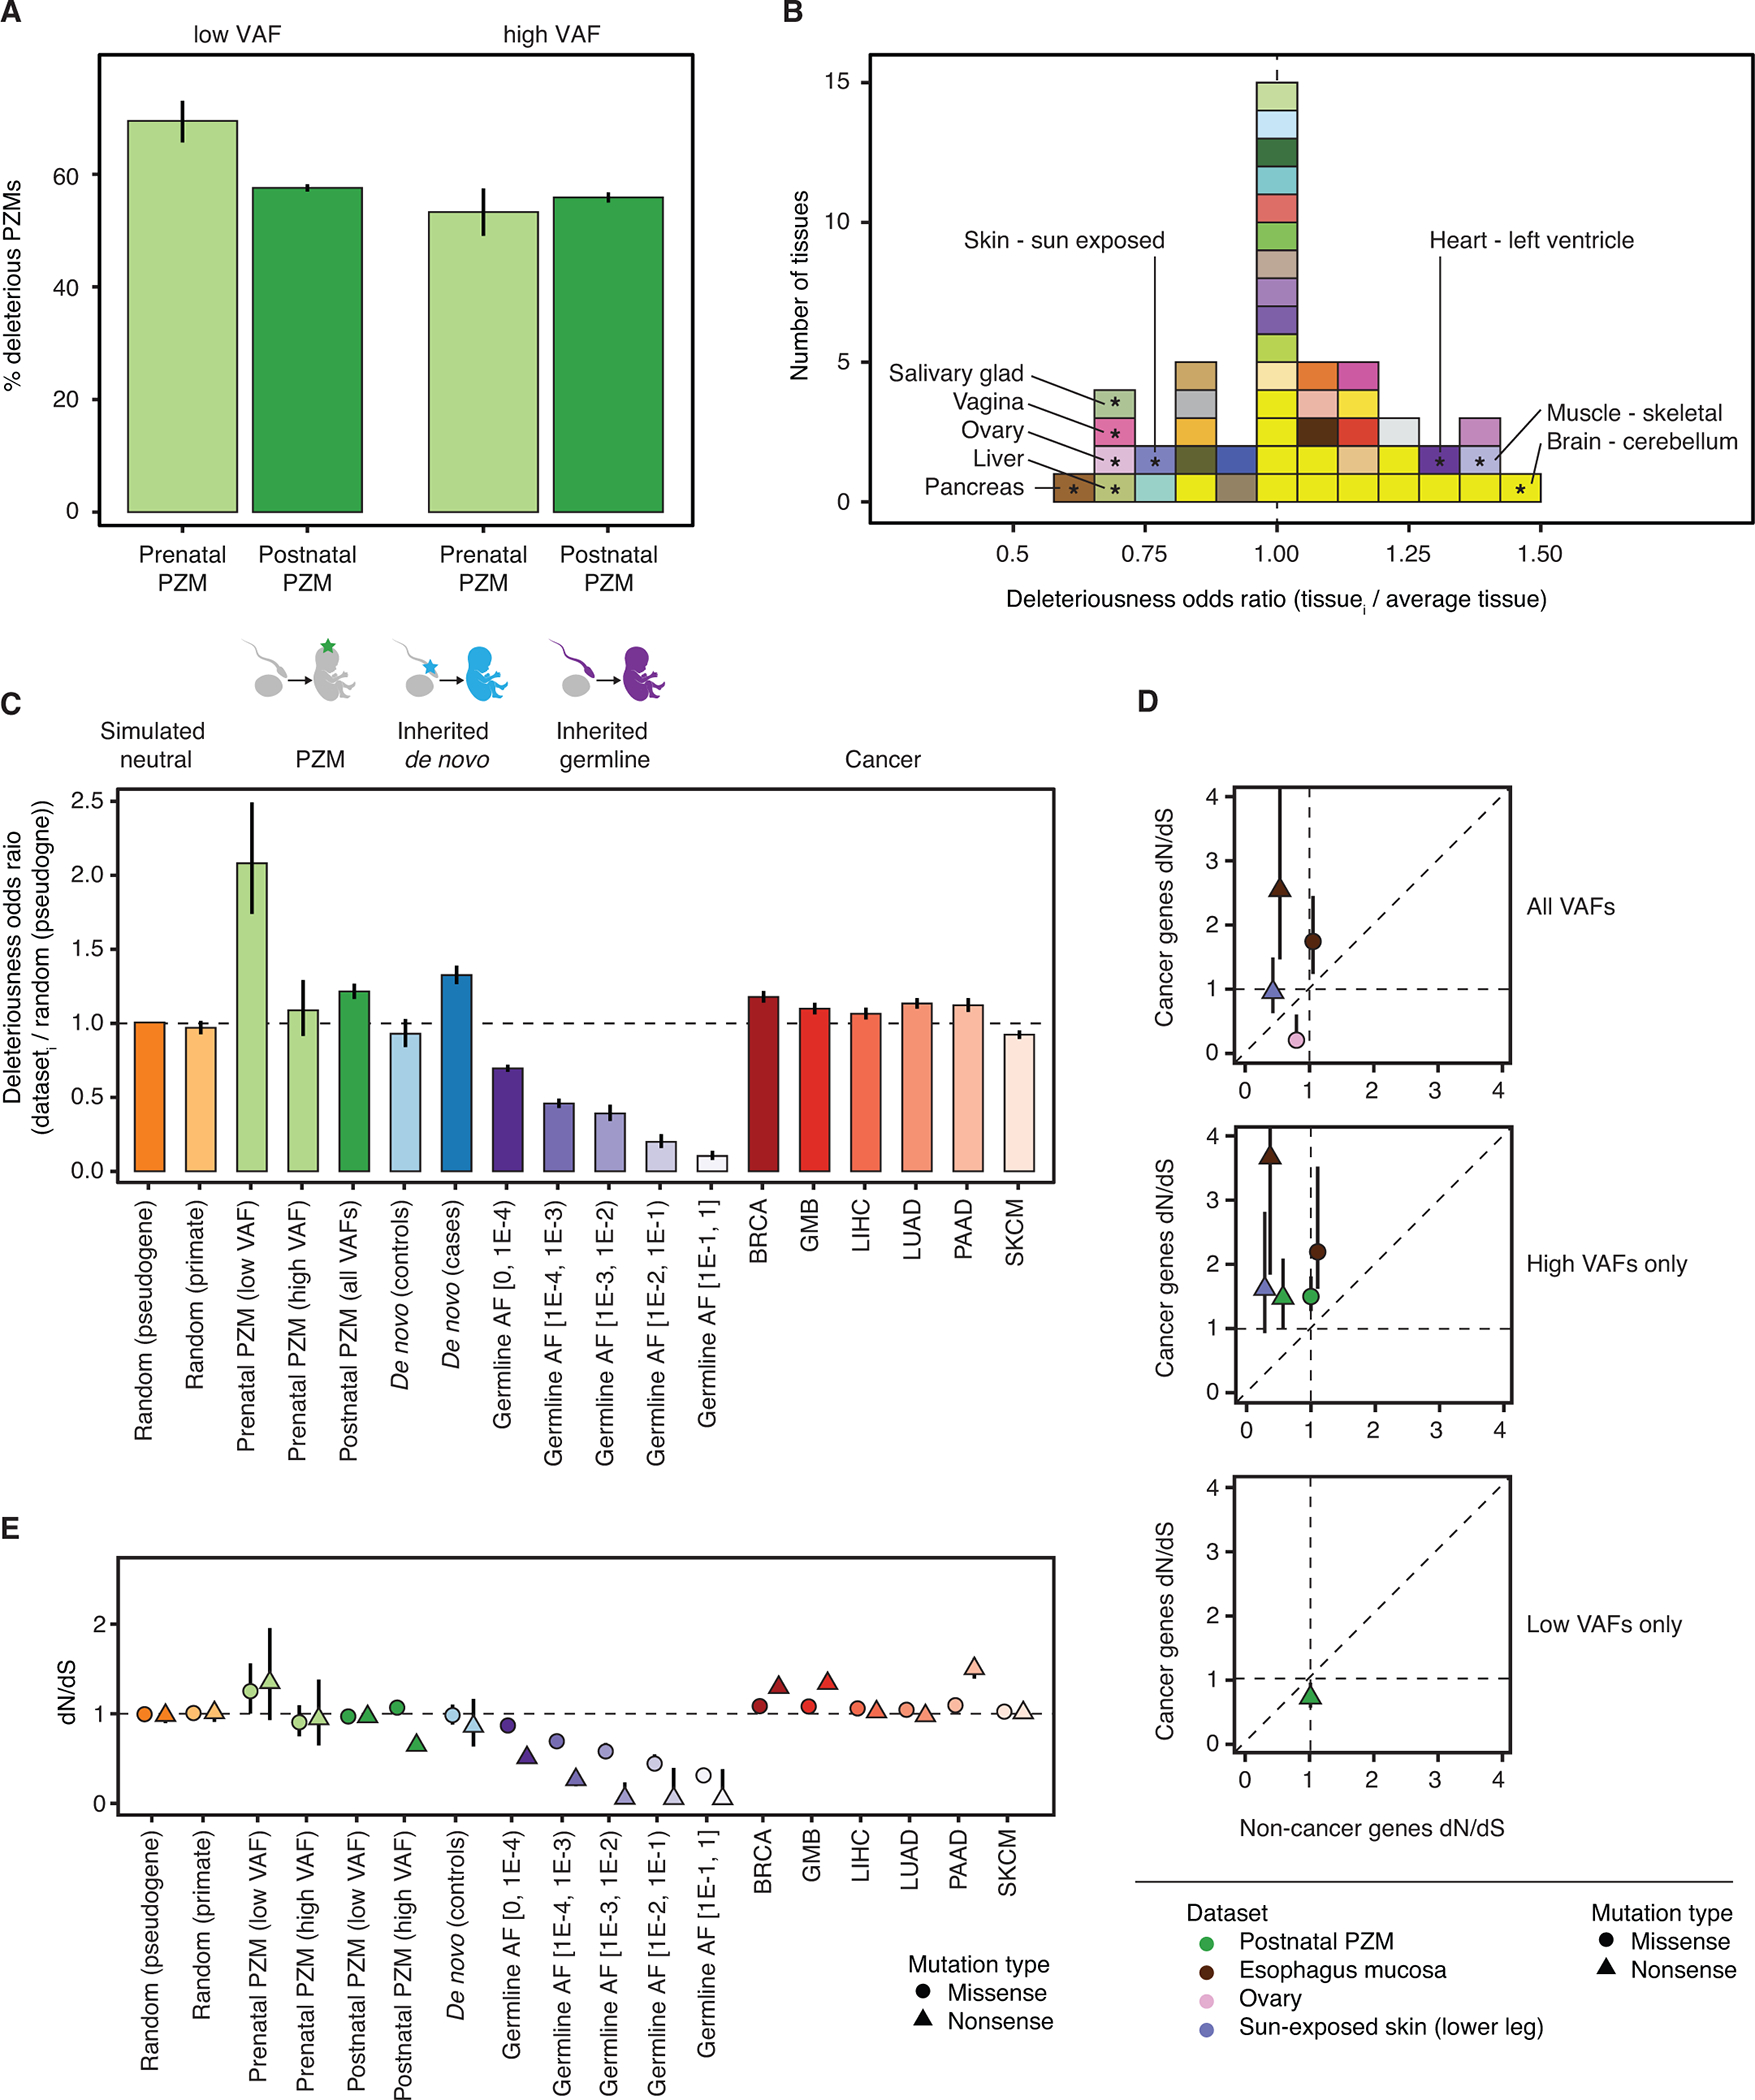
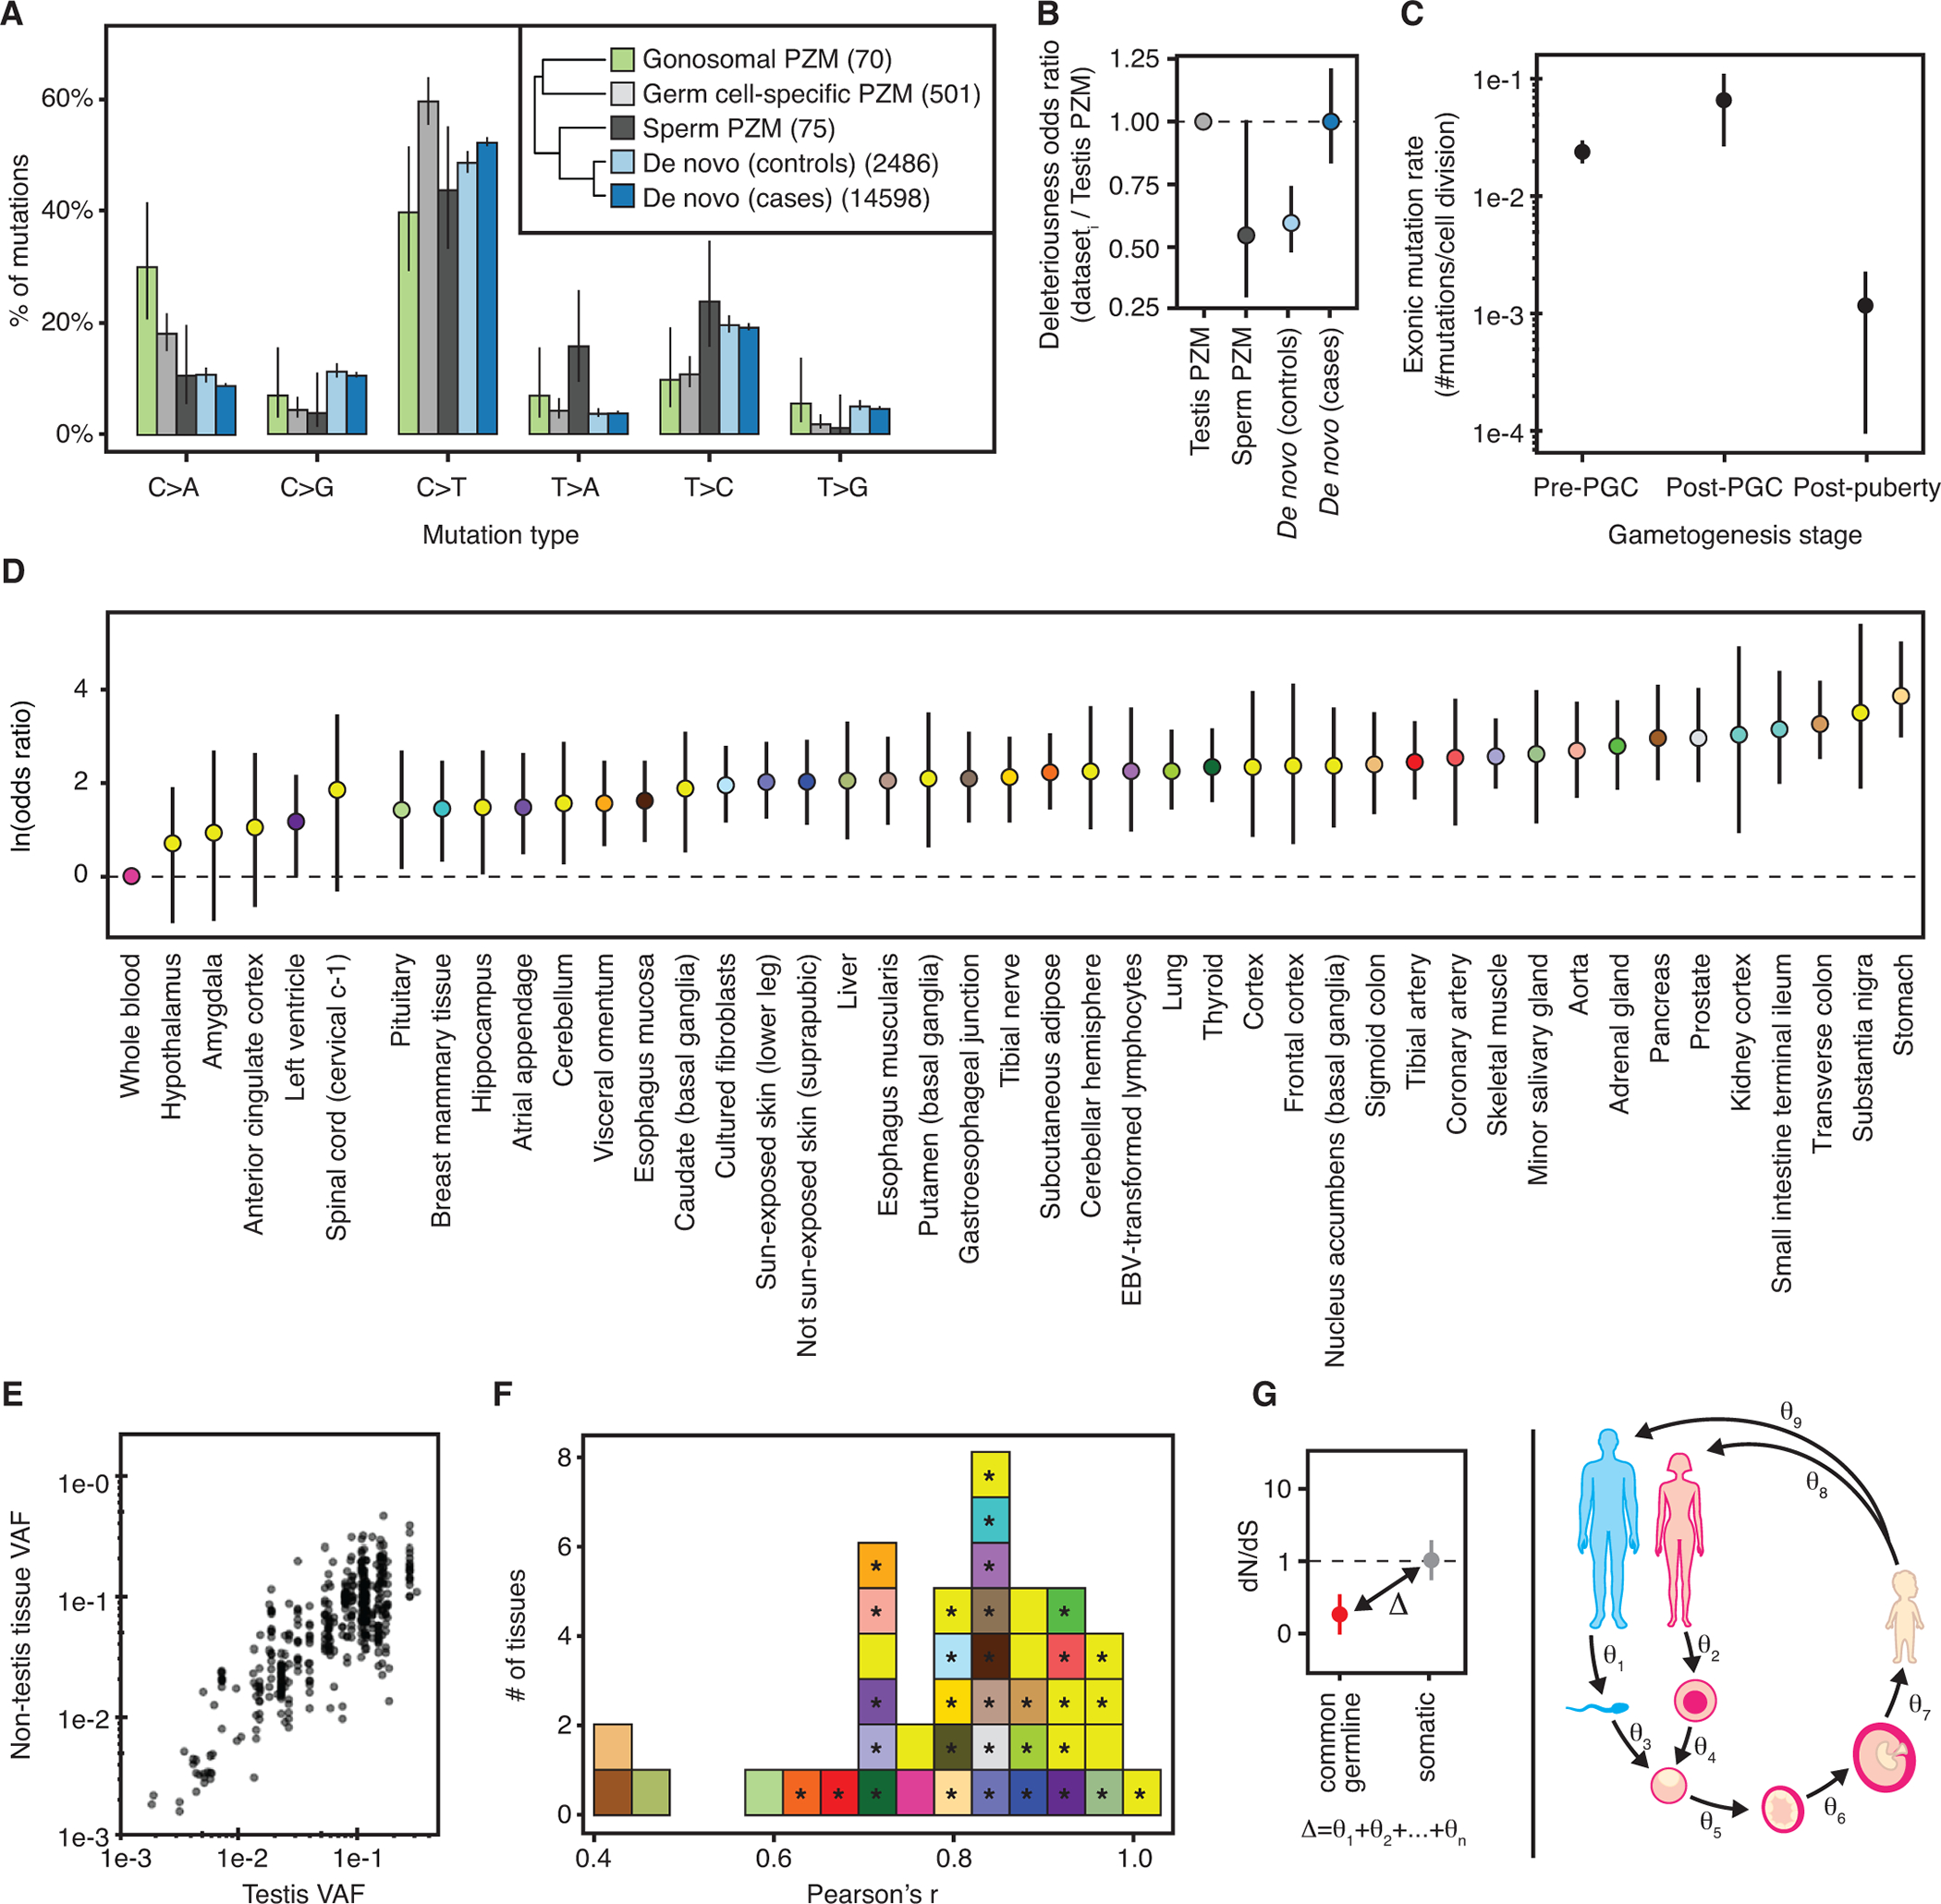
Postzygotic mutations (PZMs) begin to accrue in the human genome immediately after fertilization, but how and when PZMs affect development and lifetime health remain unclear. To study the origins and functional consequences of PZMs, we generated a multitissue atlas of PZMs spanning 54 tissue and cell types from 948 donors. Nearly half the variation in mutation burden among tissue samples can be explained by measured technical and biological effects, and 9% can be attributed to donor-specific effects. Through phylogenetic reconstruction of PZMs, we found that their type and predicted functional impact vary during prenatal development, across tissues, and through the germ cell life cycle. Thus, methods for interpreting effects across the body and the life span are needed to fully understand the consequences of genetic variants.


Conflict of interest statement

Competing interests

D.F.C. is an advisor to Paterna Biosciences. All other authors declare that they have no competing interests.

Figures

Fig. 1.
Fig. 1.. PZM burden is correlated with biological and technical variables.
Each datapoint represents a single tissue sample and is colored by tissue. Median normalized PZM burden in a tissue denoted by horizontal black line. Tissues are sorted by increasing median normalized PZM burden. A pseudocount of 1 mutation was added to each sample before normalization and log transformation for visualization. (B) We fit a regression model for single-tissue PZM burden using 12 covariates and 48 tissues. Shown here are the Type II ANOVA F statistics for each covariate in the model. Larger F statistics correspond to greater explanatory power of the covariate. (C) Regression coefficients of tissue-ancestry interactions and (D) tissue-sex interactions indicate strong effects of ancestry and sex on PZM burden. AA = African American. AS = Asian American. EA = European American. * in C denote differences in mutation burden among ancestry groups that are consistent with cancer incidence trends (18) (E) Significant positive tissue-age interaction effects were detected for 16/48 (33%) tissues. In C-E, the red gradient and text labels within indicate the meaning of the regression coefficients’ sign and magnitude. (F) Variance component estimates of donor-specific random effects on PZM burden indicate that 8%−15% of variation among tissues can be ascribed to donor effects, which could be genetic and environmental. Dashed vertical lines at beta = 0 in interaction plots denote no association between mutation burden and interaction. C,D,E,F: Error bars represent 95% CIs. A,C,D,E: Tissues are colored using the GTEx coloring convention (see Table S8 for a complete legend).
Fig. 2.
Fig. 2.. Mutation burden and spectra of prenatal PZMs across time and space.
(A) Prenatal PZM mutation burden. Edge color represents the percent of prenatal PZMs mapped to that period in development. Thick gray edges are edges with limited mutation detection power. (B) Edge color represents the predominant mutation type of mutations mapped to that edge, as established by binomial testing. Thin gray edges are edges with no predominant mutation type. See Fig. S13A for the full set of vertex labels. Adult tissues (leaves of tree) are colored using the GTEx coloring convention (see Table S8 for a complete legend). (C) Local variation in mutation spectra across developmental space and time. Each facet represents the mutation spectra observed in a parent edge (leftmost barplot) and its children’s edges. Statistically significant differences in mutation spectra are annotated with “*”.
Fig. 3.
Fig. 3.
Deleteriousness and selective pressure changes as a function of VAF, space, time, and classes of genetic variation. (A) Relative odds of detecting deleterious mutations across developmental time (gray bars) and VAF bins (green bars). (B) Histogram of the odds of detecting deleterious postnatal PZMs in each tissue compared to the average tissue. Tissues are colored using the GTEx coloring convention (see Table S8 for a complete legend). Tissues with significant odds ratios (at q-value ≤ 0.05) are marked with “*” and labeled with their names. Vertical dashed line at odds ratio = 1 indicates no difference in odds. (C) Relative odds of detecting deleterious PZM mutations compared to different classes of genetic variation. Dashed line at odds ratio = 1 indicates no difference in odds of detecting deleterious mutations compared to reference group. Error bars represent 95% CIs. (D) Comparison of postnatal PZM selection pressure in cancer and non-cancer genes. For clarity, only PZM datasets that had different selection pressure between cancer and non-cancer genes are shown. Top: PZM datasets that had variable selection when using all mutations; middle: high VAF mutations; bottom: low VAF mutations. Error bars represent 95% CIs. Some CIs are smaller than the datapoint so are not directly visible. (E) dN/dS values for classes of genetic variation, as in (C). CIs are plotted behind each datapoint and are sometimes smaller than the datapoint size. dN/dS = 1 indicates neutral expectation. AF = allele frequency. BRCA = breast invasive carcinoma. GBM = glioblastoma multiforme. LIHC = liver hepatocellular carcinoma. PAAD = pancreatic adenocarcinoma. SKCM = skin cutaneous melanoma.
Fig. 4.
Fig. 4.. Germ cell PZM characteristics.
(A) Mutation spectra of different germ cell mutation classes. Number of mutations used in each dataset is listed in the inset. Inset: Hierarchical clustering of germ cell mutation spectra. (B) Relative odds of detecting deleterious mutations across germ cell datasets compared to testis PZMs. Bars colored by dataset. Horizontal black line at odds ratio = 1 denotes no difference in odds. (C) Germ cell mutation rate varies during gametogenesis in males. (D) Majority of somatic tissues have a higher odds of detecting a gonosomal PZM than blood. Natural log odds ratio for detecting a gonosomal PZM in each somatic tissue compared to blood. Dashed line at Y = 0 denotes no difference in odds. (E) Comparison of gonosomal PZM VAF in non-testis tissues versus testis tissue. (F) Distribution of tissue-specific Pearson correlations of log10-transformed gonosomal PZM VAFs in each somatic tissue and testis. Significant correlations at q-value ≤ 0.05 marked with “*”. (G) Schematic of the difference in selective constraint between germline and somatic genetic variation partitioned into discrete stages of the life cycle. A,B,C,D: Error bars denote 95% CIs.

References

    1. Melzer D, Pilling LC, Ferrucci L, The genetics of human ageing. Nat. Rev. Genet. 21, 88–101 (2020). - PMC - PubMed
    1. Genovese G, Kähler AK, Handsaker RE, Lindberg J, Rose SA, Bakhoum SF, Chambert K, Mick E, Neale BM, Fromer M, Purcell SM, Svantesson O, Landén M, Höglund M, Lehmann S, Gabriel SB, Moran JL, Lander ES, Sullivan PF, Sklar P, Grönberg H, Hultman CM, McCarroll SA, Clonal hematopoiesis and blood-cancer risk inferred from blood DNA sequence. N. Engl. J. Med. 371, 2477–2487 (2014). - PMC - PubMed
    1. Xie M, Lu C, Wang J, McLellan MD, Johnson KJ, Wendl MC, McMichael JF, Schmidt HK, Yellapantula V, Miller CA, Ozenberger BA, Welch JS, Link DC, Walter MJ, Mardis ER, Dipersio JF, Chen F, Wilson RK, Ley TJ, Ding L, Age-related mutations associated with clonal hematopoietic expansion and malignancies. Nat. Med. 20, 1472–1478 (2014). - PMC - PubMed
    1. Young AL, Challen GA, Birmann BM, Druley TE, Clonal haematopoiesis harbouring AML-associated mutations is ubiquitous in healthy adults. Nat. Commun. 7, 12484 (2016). - PMC - PubMed
    1. Lodato MA, Woodworth MB, Lee S, Evrony GD, Mehta BK, Karger A, Lee S, Chittenden TW, D’Gama AM, Cai X, Luquette LJ, Lee E, Park PJ, Walsh CA, Somatic mutation in single human neurons tracks developmental and transcriptional history. Science. 350, 94–98 (2015). - PMC - PubMed

LinkOut - more resources