. 2023 May:91:104555.
doi: 10.1016/j.ebiom.2023.104555. Epub 2023 Apr 11.

Macrophage CD5L is a target for cancer immunotherapy

Affiliations

Macrophage CD5L is a target for cancer immunotherapy

Lidia Sanchez-Moral et al. EBioMedicine. 2023 May.

Abstract

Background: Reprogramming of immunosuppressive tumor-associated macrophages (TAMs) presents an attractive therapeutic strategy in cancer. The aim of this study was to explore the role of macrophage CD5L protein in TAM activity and assess its potential as a therapeutic target.

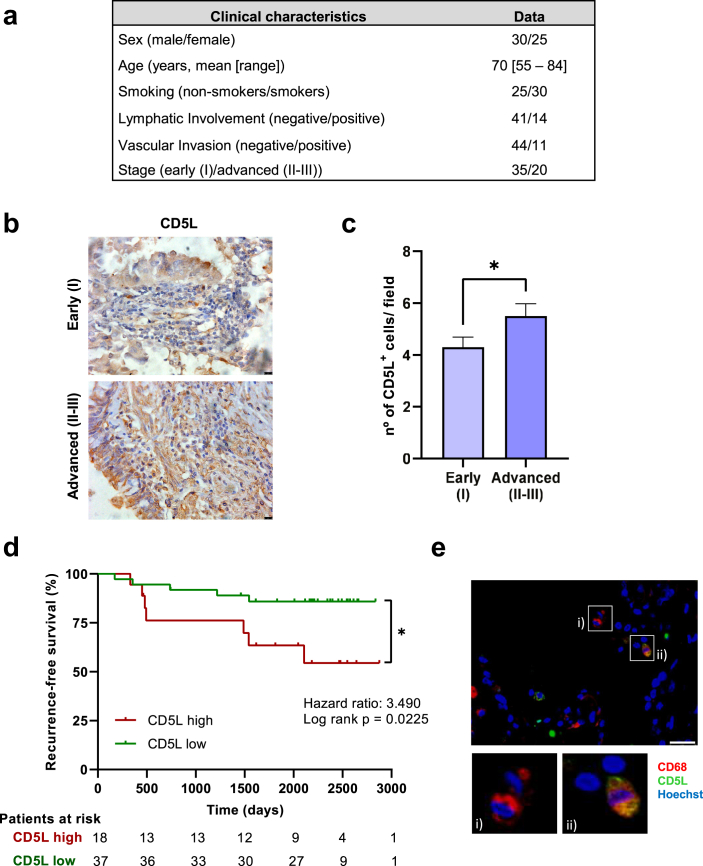
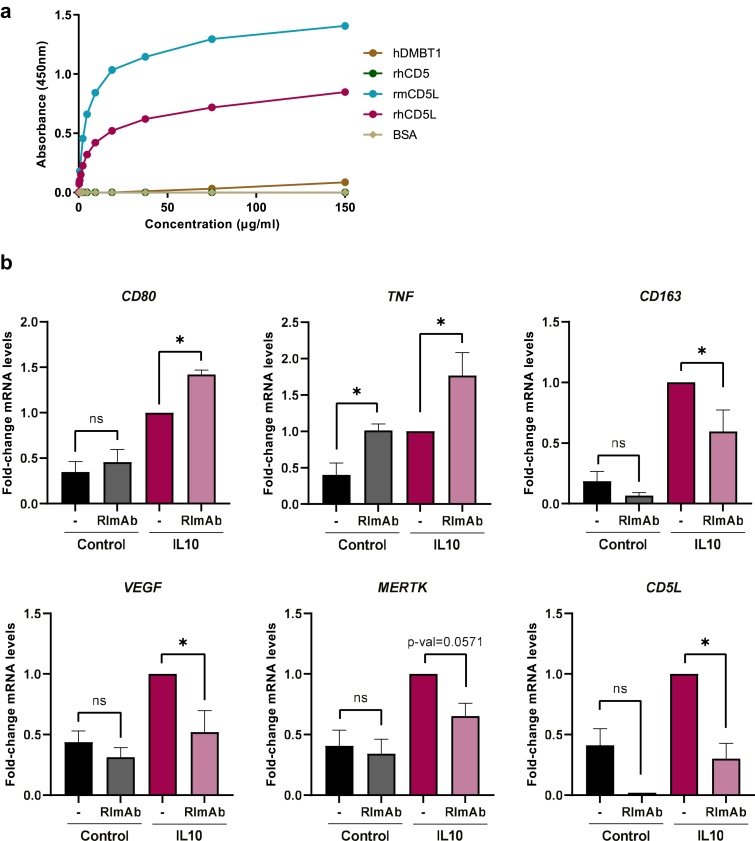
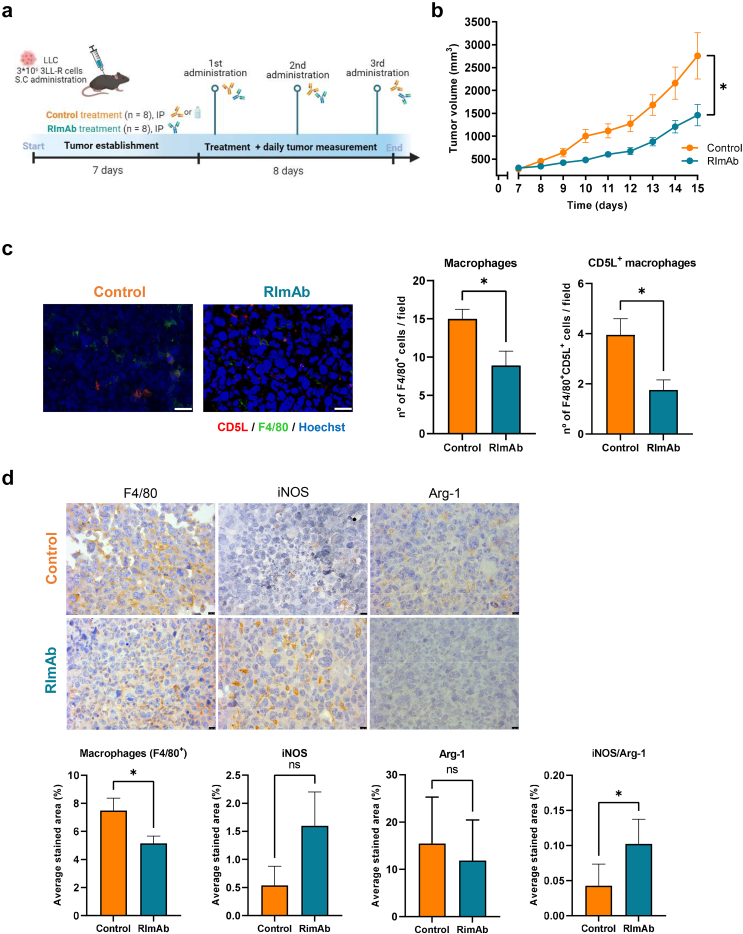
Methods: Monoclonal antibodies (mAbs) against recombinant CD5L were raised by subcutaneous immunization of BALB/c mice. Peripheral blood monocytes were isolated from healthy donors and stimulated with IFN/LPS, IL4, IL10, and conditioned medium (CM) from different cancer cell lines in the presence of anti-CD5L mAb or controls. Subsequently, phenotypic markers, including CD5L, were quantified by flow cytometry, IF and RT-qPCR. Macrophage CD5L protein expression was studied in 55 human papillary lung adenocarcinoma (PAC) samples by IHC and IF. Anti-CD5L mAb and isotype control were administered intraperitoneally into a syngeneic Lewis Lung Carcinoma mouse model and tumor growth was measured. Tumor microenvironment (TME) changes were determined by flow cytometry, IHC, IF, Luminex, RNAseq and RT-qPCR.

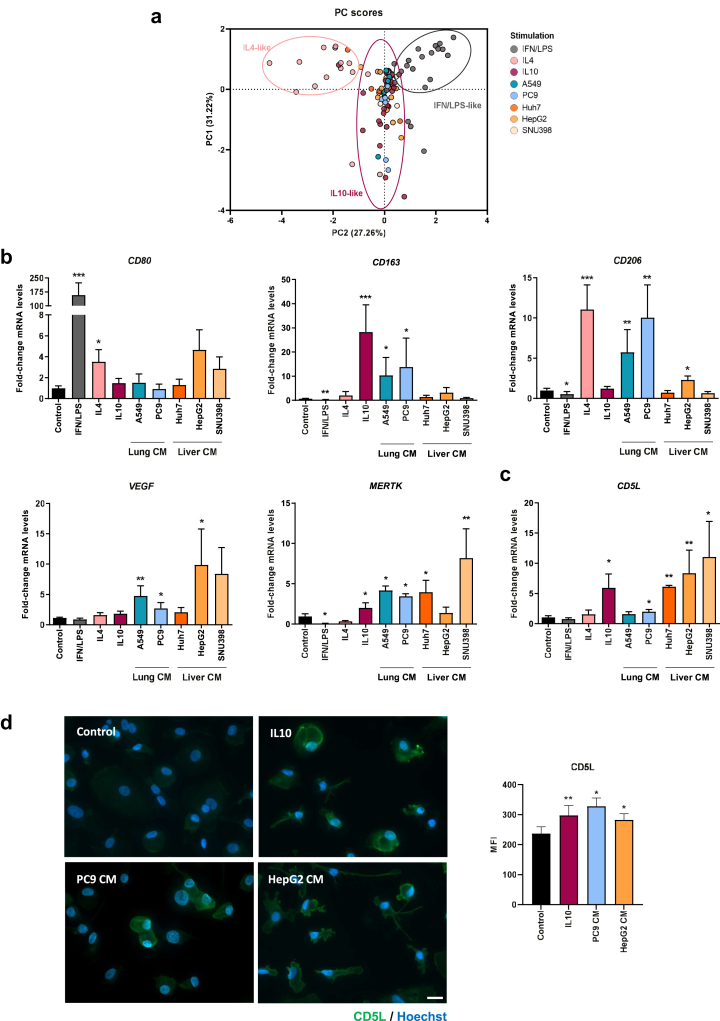
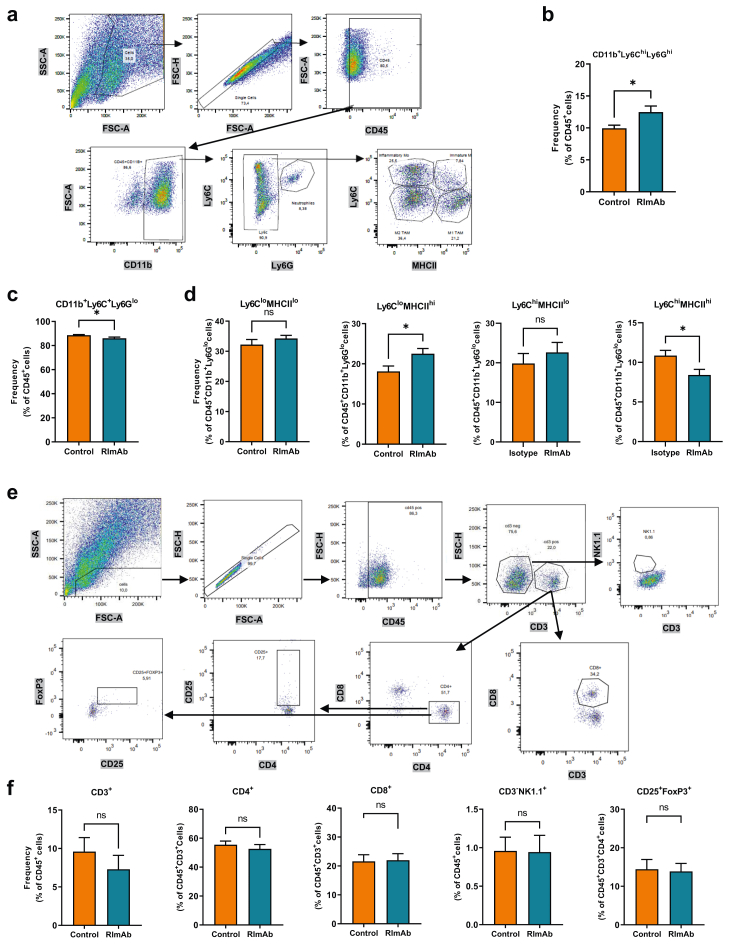
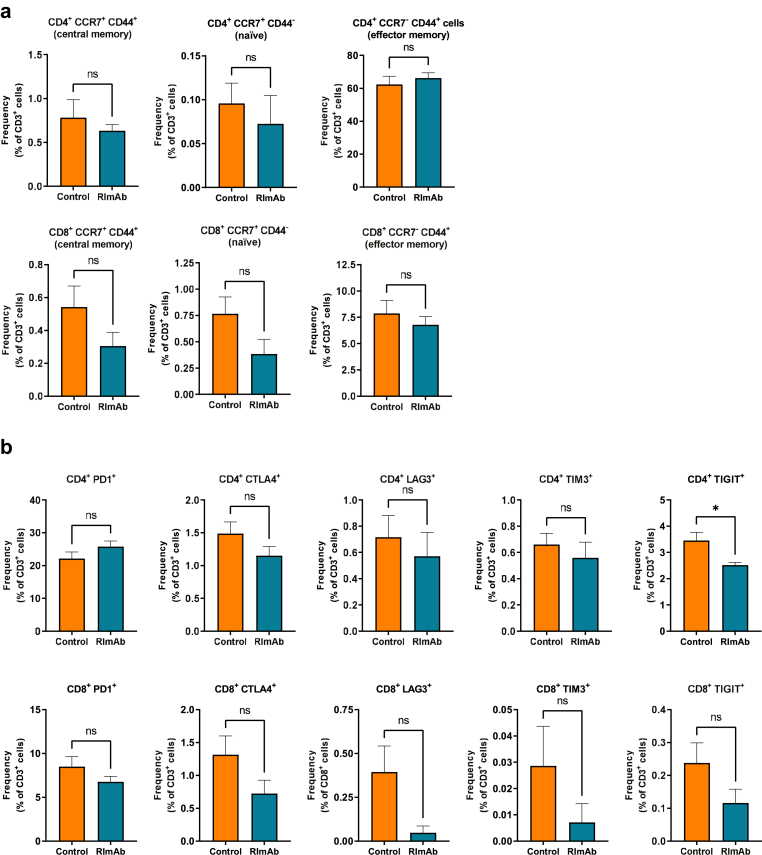
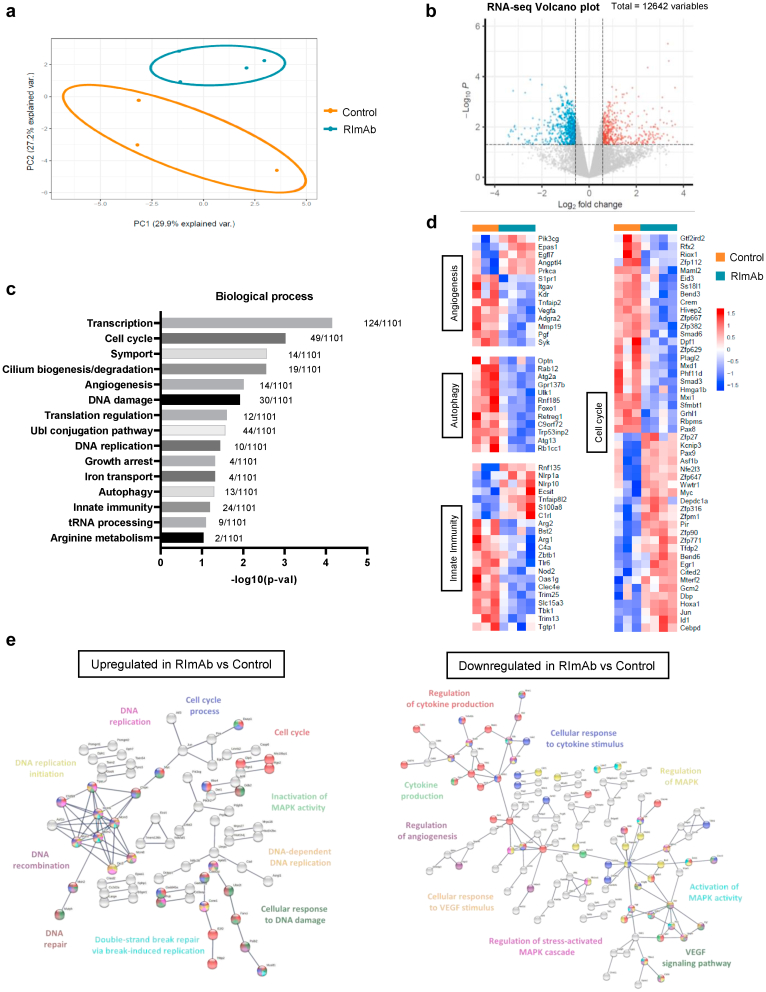
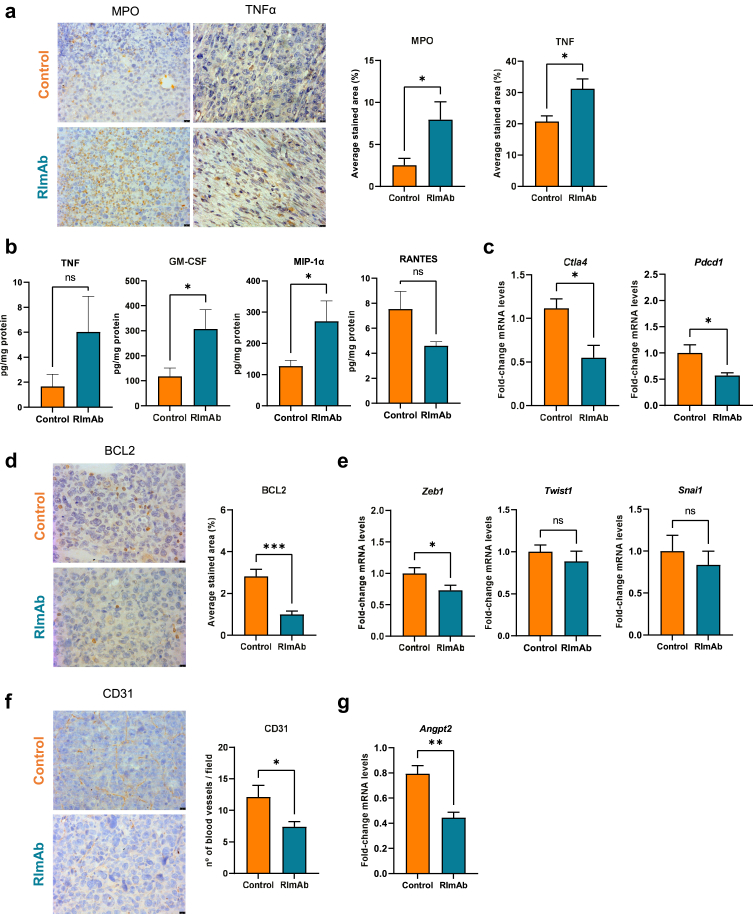
Findings: Cancer cell lines CM induced an immunosuppressive phenotype (increase in CD163, CD206, MERTK, VEGF and CD5L) in cultured macrophages. Accordingly, high TAM expression of CD5L in PAC was associated with poor patient outcome (Log-rank (Mantel-Cox) test p = 0.02). We raised a new anti-CD5L mAb that blocked the immunosuppressive phenotype of macrophages in vitro. Its administration in vivo inhibited tumor progression of lung cancer by altering the intratumoral myeloid cell population profile and CD4+ T-cell exhaustion phenotype, thereby significantly modifying the TME and increasing the inflammatory milieu.

Interpretation: CD5L protein plays a key function in modulating the activity of macrophages and their interactions within the TME, which supports its role as a therapeutic target in cancer immunotherapy.

Funding: For a full list of funding bodies, please see the Acknowledgements.

Keywords: CD5L; Immunotherapy; Lung adenocarcinoma; Macrophage; Monoclonal antibody; Scavenger receptor cysteine rich.


Conflict of interest statement

Declaration of interests A patent protecting a method for the detection of CD5L has been submitted to the European Patent Office (EP3653646A1). Likewise, the RImAb antibody is the object of an EP3476863A1 patent. LK is part of an institutional licensing agreement with SunRock Biopharma, and co-inventor of two patents (EP22382093.7 and 62828195). JB received support from MSD, Grífols and Hipra through institutional grants, and by AlbaJuna Therapeutics S.L. through an Institutional License. He is Founder and CEO of AlbaJuna Therapeutics S.L. from which he owns stock options. He is also consultant for MSD and Nesapor S.L, and received support from Gilead for attending meetings. GT has received honoraria from Takeda for lectures.

Figures

Fig. 1
Fig. 1
Lung and liver cancer cell-conditioned media (CM) induce an IL10-like phenotype and CD5L expression in macrophages.a) Principal Component Analysis (PCA) scatterplot of PB monocytes treated for 72 h with medium alone (control), reference activation stimuli (IFN/LPS, IL4, and IL10), or cancer cell-CM. Projection based on the expression profile of surface markers characterized by multicolor flow cytometry. PC1 and PC2 represented in each axis depict the first and second principal components, respectively. b) Expression of CD80, CD163, CD206, VEGF, MERTK and c)CD5L mRNA was assessed by RT-qPCR in PB monocytes treated for 24 h with the indicated stimuli. mRNA levels normalized to GAPDH, and fold induction levels were calculated using the average expression of each gene in control macrophages as a reference. Data are represented as mean ± SEM (n = 5 to 9). d) CD5L immunofluorescence staining (green) in macrophages treated with the indicated stimuli for 72 h. Nuclei were counterstained with Hoechst 33258 (blue). Scale bar represents 20 μm. CD5L mean fluorescence intensity (MFI) was calculated with ZenLite software and is represented as MFI ± SEM of 50 macrophages scored in random fields (right) (n = 3). Significance was calculated using the Mann–Whitney t-test (∗p ≤ 0.05, ∗∗p ≤ 0.01, ∗∗∗p ≤ 0.001).
Fig. 2
Fig. 2
CD5L expression by TAMs is associated with poor prognosis in papillary lung adenocarcinoma. a) Clinical characteristics of patients diagnosed with Papillary Adenocarcinoma (PAC) who participated in this study. b) Representative immunohistochemistry images showing CD5L expression in early (I) and advanced (II–III) stages of papillary lung adenocarcinoma. Scale bar represents 10 μm. c) Graph shows the number of CD5L+ macrophages per field in early (I, n = 35) and advanced (II–III, n = 20) stages. Data are presented as the mean ± SEM, ∗p < 0.01 determined by the Mann–Whitney t-test. d) Kaplan–Meier analysis of recurrence-free survival in cases with lower and higher TAM CD5L expression. The mean number of CD5L+ macrophages from stage I was taken as the limit value, ∗p < 0.01 determined by the Log-rank (Mantel–Cox) test. e) Representative immunofluorescence image depicting CD68+ (red) (i) and CD5L+ (green) macrophages, and their co-expression (orange), (ii). Scale bar represents 25 μm.
Fig. 3
Fig. 3
RImAb specifically binds to human and mouse CD5L and reverts the polarization induced by IL10. a) Direct ELISA of RImAb to hDMBT1, rhCD5, rmCD5L, rhCD5L, or BSA. A representative experiment of three performed is shown. b) RT-qPCR quantification of mRNA expression of CD80, TNFA, CD163, VEGF, MERTK, and CD5L in PB monocytes treated, when indicated, with 5 μg/ml of RImAb for 45 min before the addition of IL10 (50 ng/ml) for 24 h. mRNA levels relative to GAPDH, and fold induction levels were calculated using the expression of each gene in IL10-stimulated macrophages for each donor as a reference. Data are represented as mean ± SEM (n = 5 to 9). Significance was calculated using the Mann–Whitney t-test (∗p ≤ 0.05).
Fig. 4
Fig. 4
Blockade of CD5L slows tumor growth in vivo and reprograms TAMs towards an antitumor profile. a) Study design and timeline for mouse model. b) LLC tumor growth in mm3 in mice treated with control (PBS) or the anti-CD5L RImAb. Data are presented as the mean ± SEM (n = 8 per group). ∗p < 0.01 determined by the two-way repeated measures ANOVA test. c) Left: Immunofluorescence demonstrating CD5L expression (red) by F4/80+ TAMs (green) in control (PBS) and RImAb-treated mice. Nuclei were counterstained with Hoechst 33258 (blue). Scale bars represent 25 μm. Right: graph representing the number of F4/80+ TAMs and F4/80+ TAMs expressing CD5L per field in control and RImAb-treated animals. Data are presented as the mean ± SEM (n = 8 per group). ∗p < 0.01 determined by the Mann–Whitney t-test. d) Immunohistochemistry depicting expression of F4/80, iNOS, and Arg-1 in tumor samples from control (PBS) and RImAb-treated mice. Scale bar represents 10 μm. Average stained area obtained from five random areas was calculated using Image J (color deconvolution) software. Graphs illustrate the average stained area for F4/80, iNOS, Arg-1 and ratio of iNOS/Arg-1 in control (PBS) and RImAb-treated mice. Data are presented as the mean ± SEM (n = 8 per group). ∗p < 0.01 determined by the Mann–Whitney t-test.
Fig. 5
Fig. 5
RImAb modifies the intratumoral myeloid cell compartment in a mouse model of LLC. a) Myeloid cell gating classification using the expression of surface markers CD45, CD11b, Ly6C, Ly6G, and MHCII. b) Percentage of CD45+CD11b+Ly6ChiLy6Ghi neutrophil population. c) Percentage of CD45+CD11b+Ly6C+Ly6Glo myeloid cell subset. d) Percentage of CD45+CD11b+Ly6CloMHCIIlo, CD45+CD11b+Ly6CloMHCIIhi, CD45+CD11b+Ly6ChiMHCIIlo and CD45+CD11b+Ly6ChiMHCIIhi myeloid cell subsets. e) Lymphoid cell gating classification using the expression of the CD45, CD3, CD8, CD4, CD25, NK1.1, and FoxP3 markers. f) Percentage of each lymphocytic subset population analyzed in control (isotype IgG2a) and RImAb-treated mice. Data are presented as the mean of ±SEM (n = 8 per group), and statistical comparisons were performed using the Mann–Whitney t-test.
Fig. 6
Fig. 6
RImAb modifies the exhaustion state of intratumoral T-cells in a mouse model of LLC. Flow cytometry analysis of a) CCR7 and CD44 memory markers, and b) CTLA4, PD1, LAG3, TIM3, TIGIT exhaustion markers, in CD4+ (upper panels) or CD8+ (lower panels) T-cells isolated from LLC tumor samples. Data are presented as the mean percentage with respect to CD3+ population ± SEM (n = 8 per group). ∗p < 0.01 determined by the Mann–Whitney t-test.
Fig. 7
Fig. 7
RImAb induces changes in the gene expression profile of the myeloid population in a mouse model of LLC. a) Principal Component Analysis (PCA) scatterplot of the gene expression profile of CD45+CD11b+Ly6C+Ly6Glo cells in control (isotype IgG2a) (n = 3) and RImAb (n = 4)-treated mice obtained by RNA-seq. Percentages represent variance captured by PCA 1 and 2. b) Volcano-plot representing genes differentially expressed in RImAb-treated vs. control (isotype IgG2a) group as detected by RNA-seq data sets. Red points mark the genes with significantly increased (right, 687 genes) or decreased (left, 512 genes) expression (p < 0.05). Gray line is set to p-value of 0.05. c) Gene Ontology (GO) enrichment analysis obtained from significantly differentially expressed genes (fold-change (FC) > 1.5, p-val < 0.05) between the control (isotype IgG2a) and RImAb-treated groups. Analysis was performed with DAVID database. d) Heatmaps of gene expression of the differentially expressed genes between the control (isotype IgG2a) and RImAb-treated groups for the GO Biological Processes of Angiogenesis, Autophagy, Innate Immunity, and Cell Cycle previously identified by DAVID. e) Interactome analysis of proteins coded by genes upregulated (left) and downregulated (right) in the RImAb-treated vs. control (isotype IgG2a) groups obtained with STRING (v11.5) software.
Fig. 8
Fig. 8
RImAb reprograms the tumor microenvironment towards a more inflammatory and antitumoral phenotype in a mouse model of LLC. a)Left: Representative immunohistochemistry images of MPO and TNF-α expression in tumor samples from control (PBS) and RImAb-treated groups. Right: quantification of the average stained area of five random images obtained from each group. b) Levels of TNF-α, GM-CSF, MIP-1α, and RANTES cytokines in tumor homogenates, expressed as pg cytokine/mg protein, in control (isotype IgG2a) and RImAb-treated mice (8 mice per group), measured by the Multiplex Assay. Bar graphs show means with SEM. c) Expression of Ctla4 and Pdcd1 mRNA was assessed by RT-qPCR in total tumor from control (isotype IgG2a) and RImAb-treated mice. d)Left: Representative immunohistochemistry images of BCL2 expression in tumor samples from the control (PBS) and RImAb-treated mice. Right: quantification of the average stained area of 5 random images obtained from each group. e) Expression of EMT markers Zeb1, Snail1, and Twist1 mRNA was assessed by RT-qPCR in total tumor from control (isotype IgG2a) and RImAb-treated mice. f)Left: Representative immunohistochemistry images of CD31 expression in the tumor samples from control (PBS) and RImAb-treated mice. Right: Quantification shows the number of blood vessels per field of five random images obtained from each group. g) Expression of Angpt2 mRNA was assessed by RT-qPCR in total tumor from control (isotype IgG2a) and RImAb-treated mice. For a), d) and f), pictures were quantified using Image J (color deconvolution) software. Scale bars represent 10 μm, and data are presented as the mean ± SEM (n = 8 per group). For c), e), and g), mRNA levels are relative to Actb, and fold induction levels were calculated by using as a reference the average level of expression of each gene in tumors from control (isotype IgG2a) mice, and are represented with a boxplot showing median with whiskers (min to max) (n = 8 per group). For all panels, data are presented as the mean ± SEM, and statistical significance was calculated using the Mann–Whitney t-test, ∗p < 0.05, ∗∗p < 0.01, ∗∗∗p ≤ 0.001.

References

    1. Whiteside T.L. The tumor microenvironment and its role in promoting tumor growth. Oncogene. 2008;27(45):5904–5912. - PMC - PubMed
    1. Bejarano L., Jordāo M.J., Joyce J.A., Bejarano L., Jordāo M., Author C. Therapeutic targeting of the tumor microenvironment. Cancer Discov. 2021;11(4):933–959. - PubMed
    1. Cassetta L., Pollard J.W. Targeting macrophages: therapeutic approaches in cancer. Nat Rev Drug Discov. 2018;17(12):887–904. - PubMed
    1. Qian B., Pollard J.W. Macrophage diversity enhances tumor progression and metastasis. Cell. 2010;141(1):39–51. - PMC - PubMed
    1. Casanova-Acebes M., Dalla E., Leader A.M., et al. Tissue-resident macrophages provide a pro-tumorigenic niche to early NSCLC cells. Nature. 2021;595(7868):578–584. - PMC - PubMed

Substances