. 2023 May 17;43(20):3764-3785.
doi: 10.1523/JNEUROSCI.2102-22.2023. Epub 2023 Apr 13.

Cross-Platform Synaptic Network Analysis of Human Entorhinal Cortex Identifies TWF2 as a Modulator of Dendritic Spine Length

Affiliations

Cross-Platform Synaptic Network Analysis of Human Entorhinal Cortex Identifies TWF2 as a Modulator of Dendritic Spine Length

Courtney K Walker et al. J Neurosci. .

Abstract

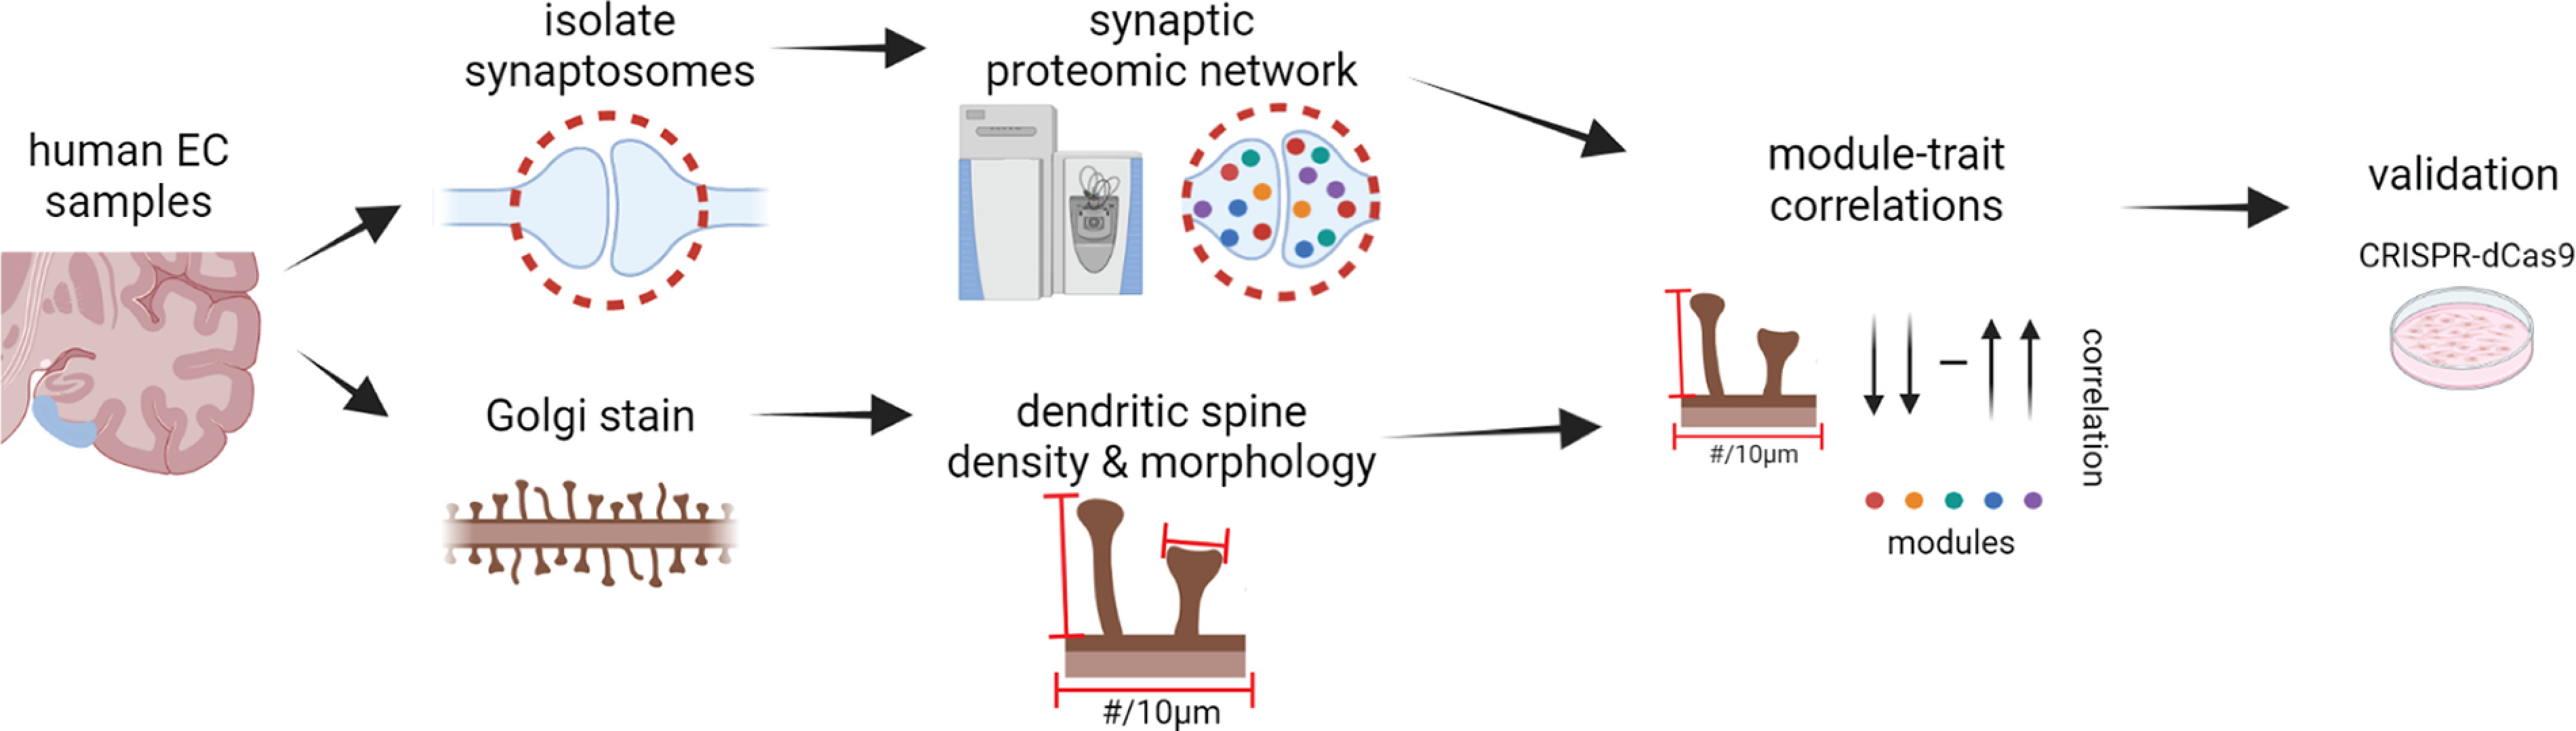
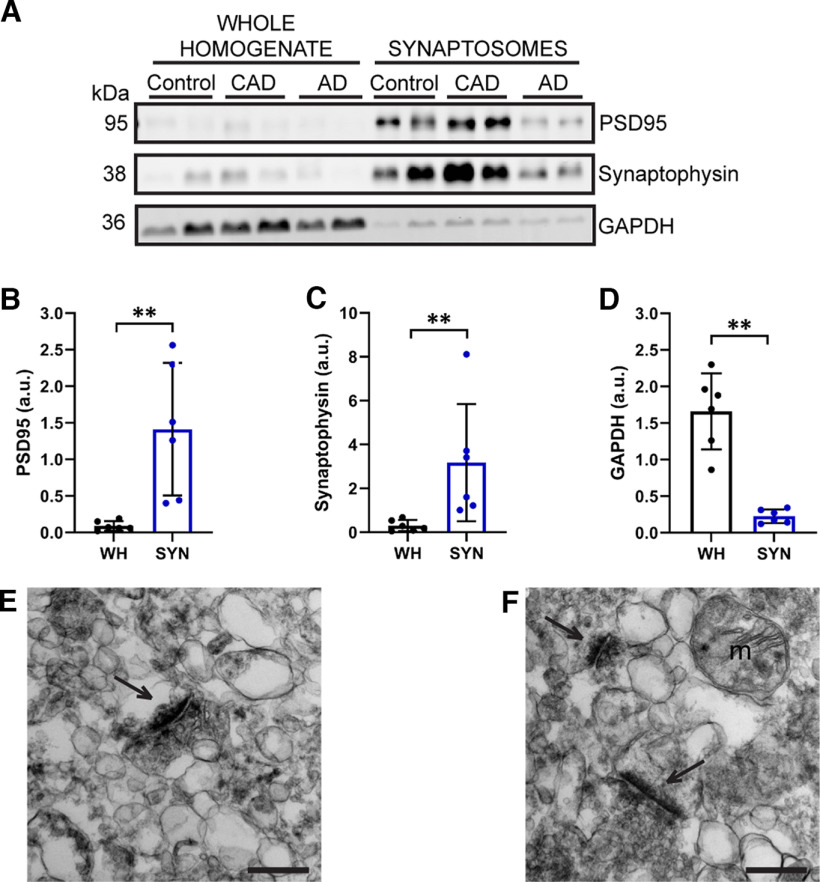
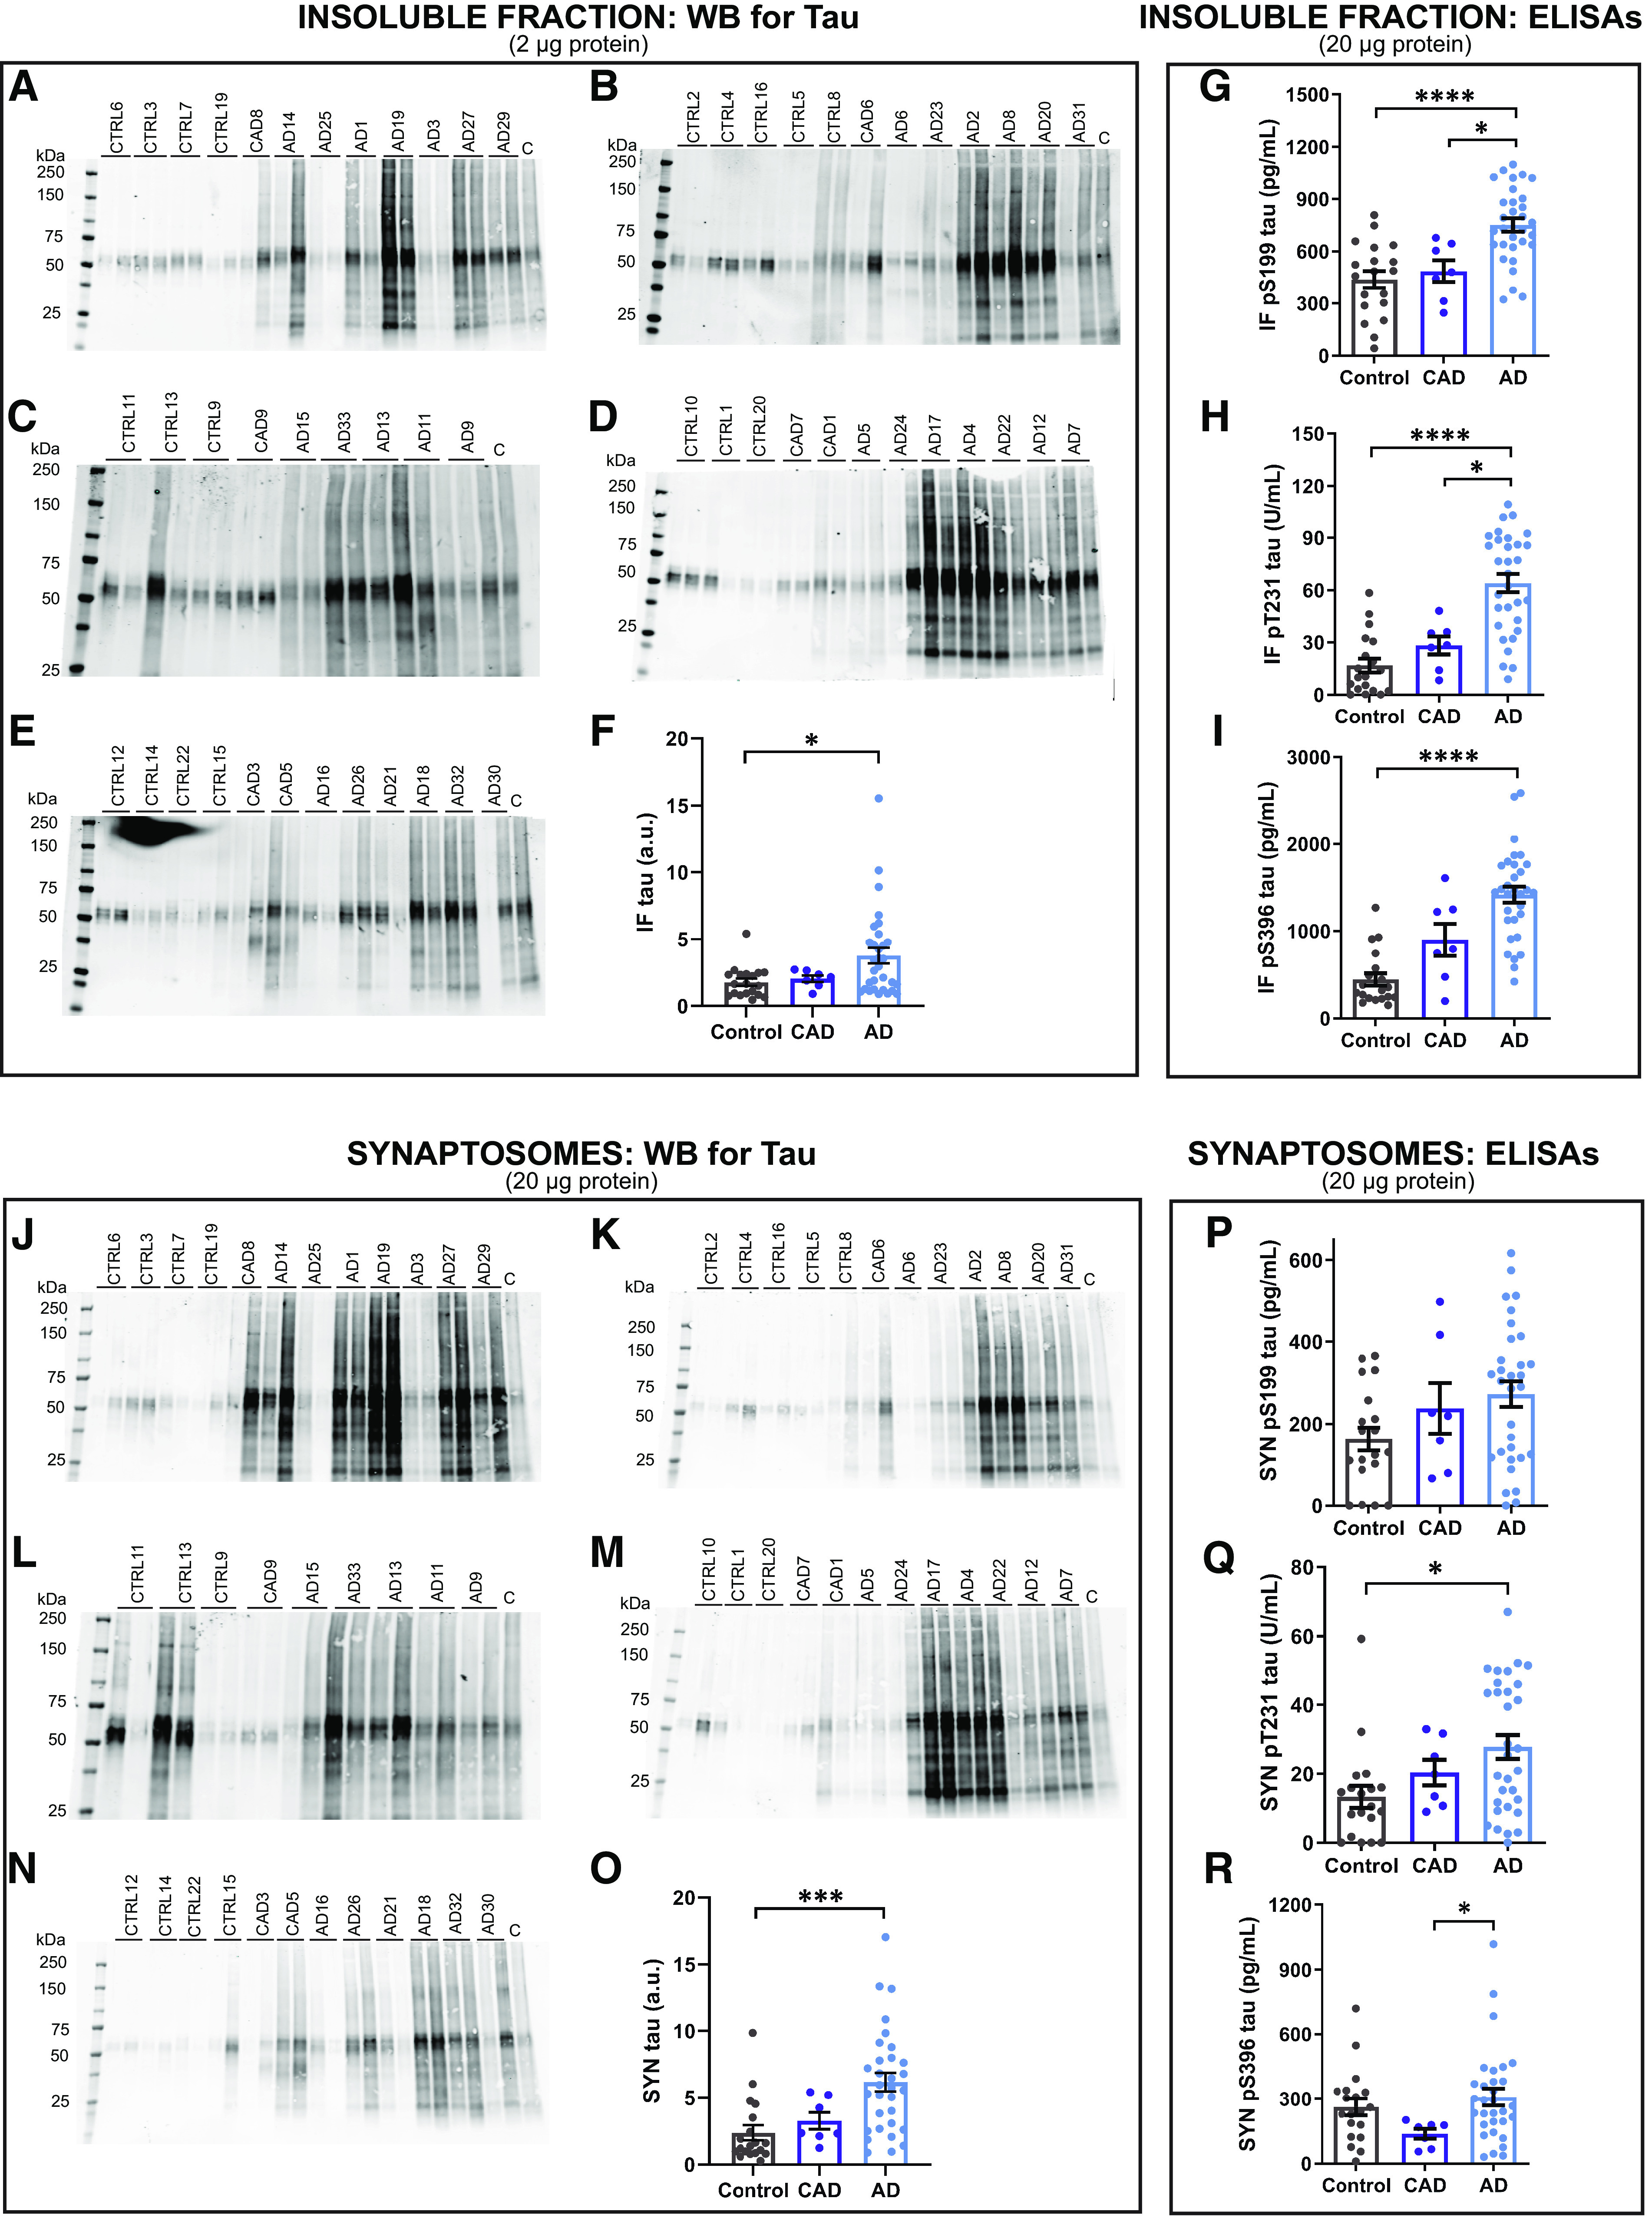
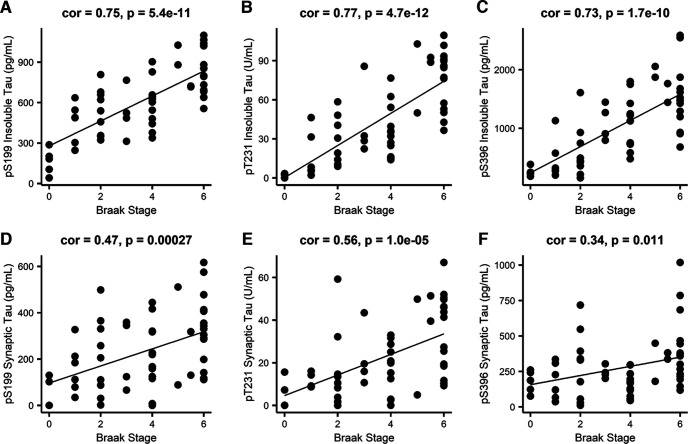
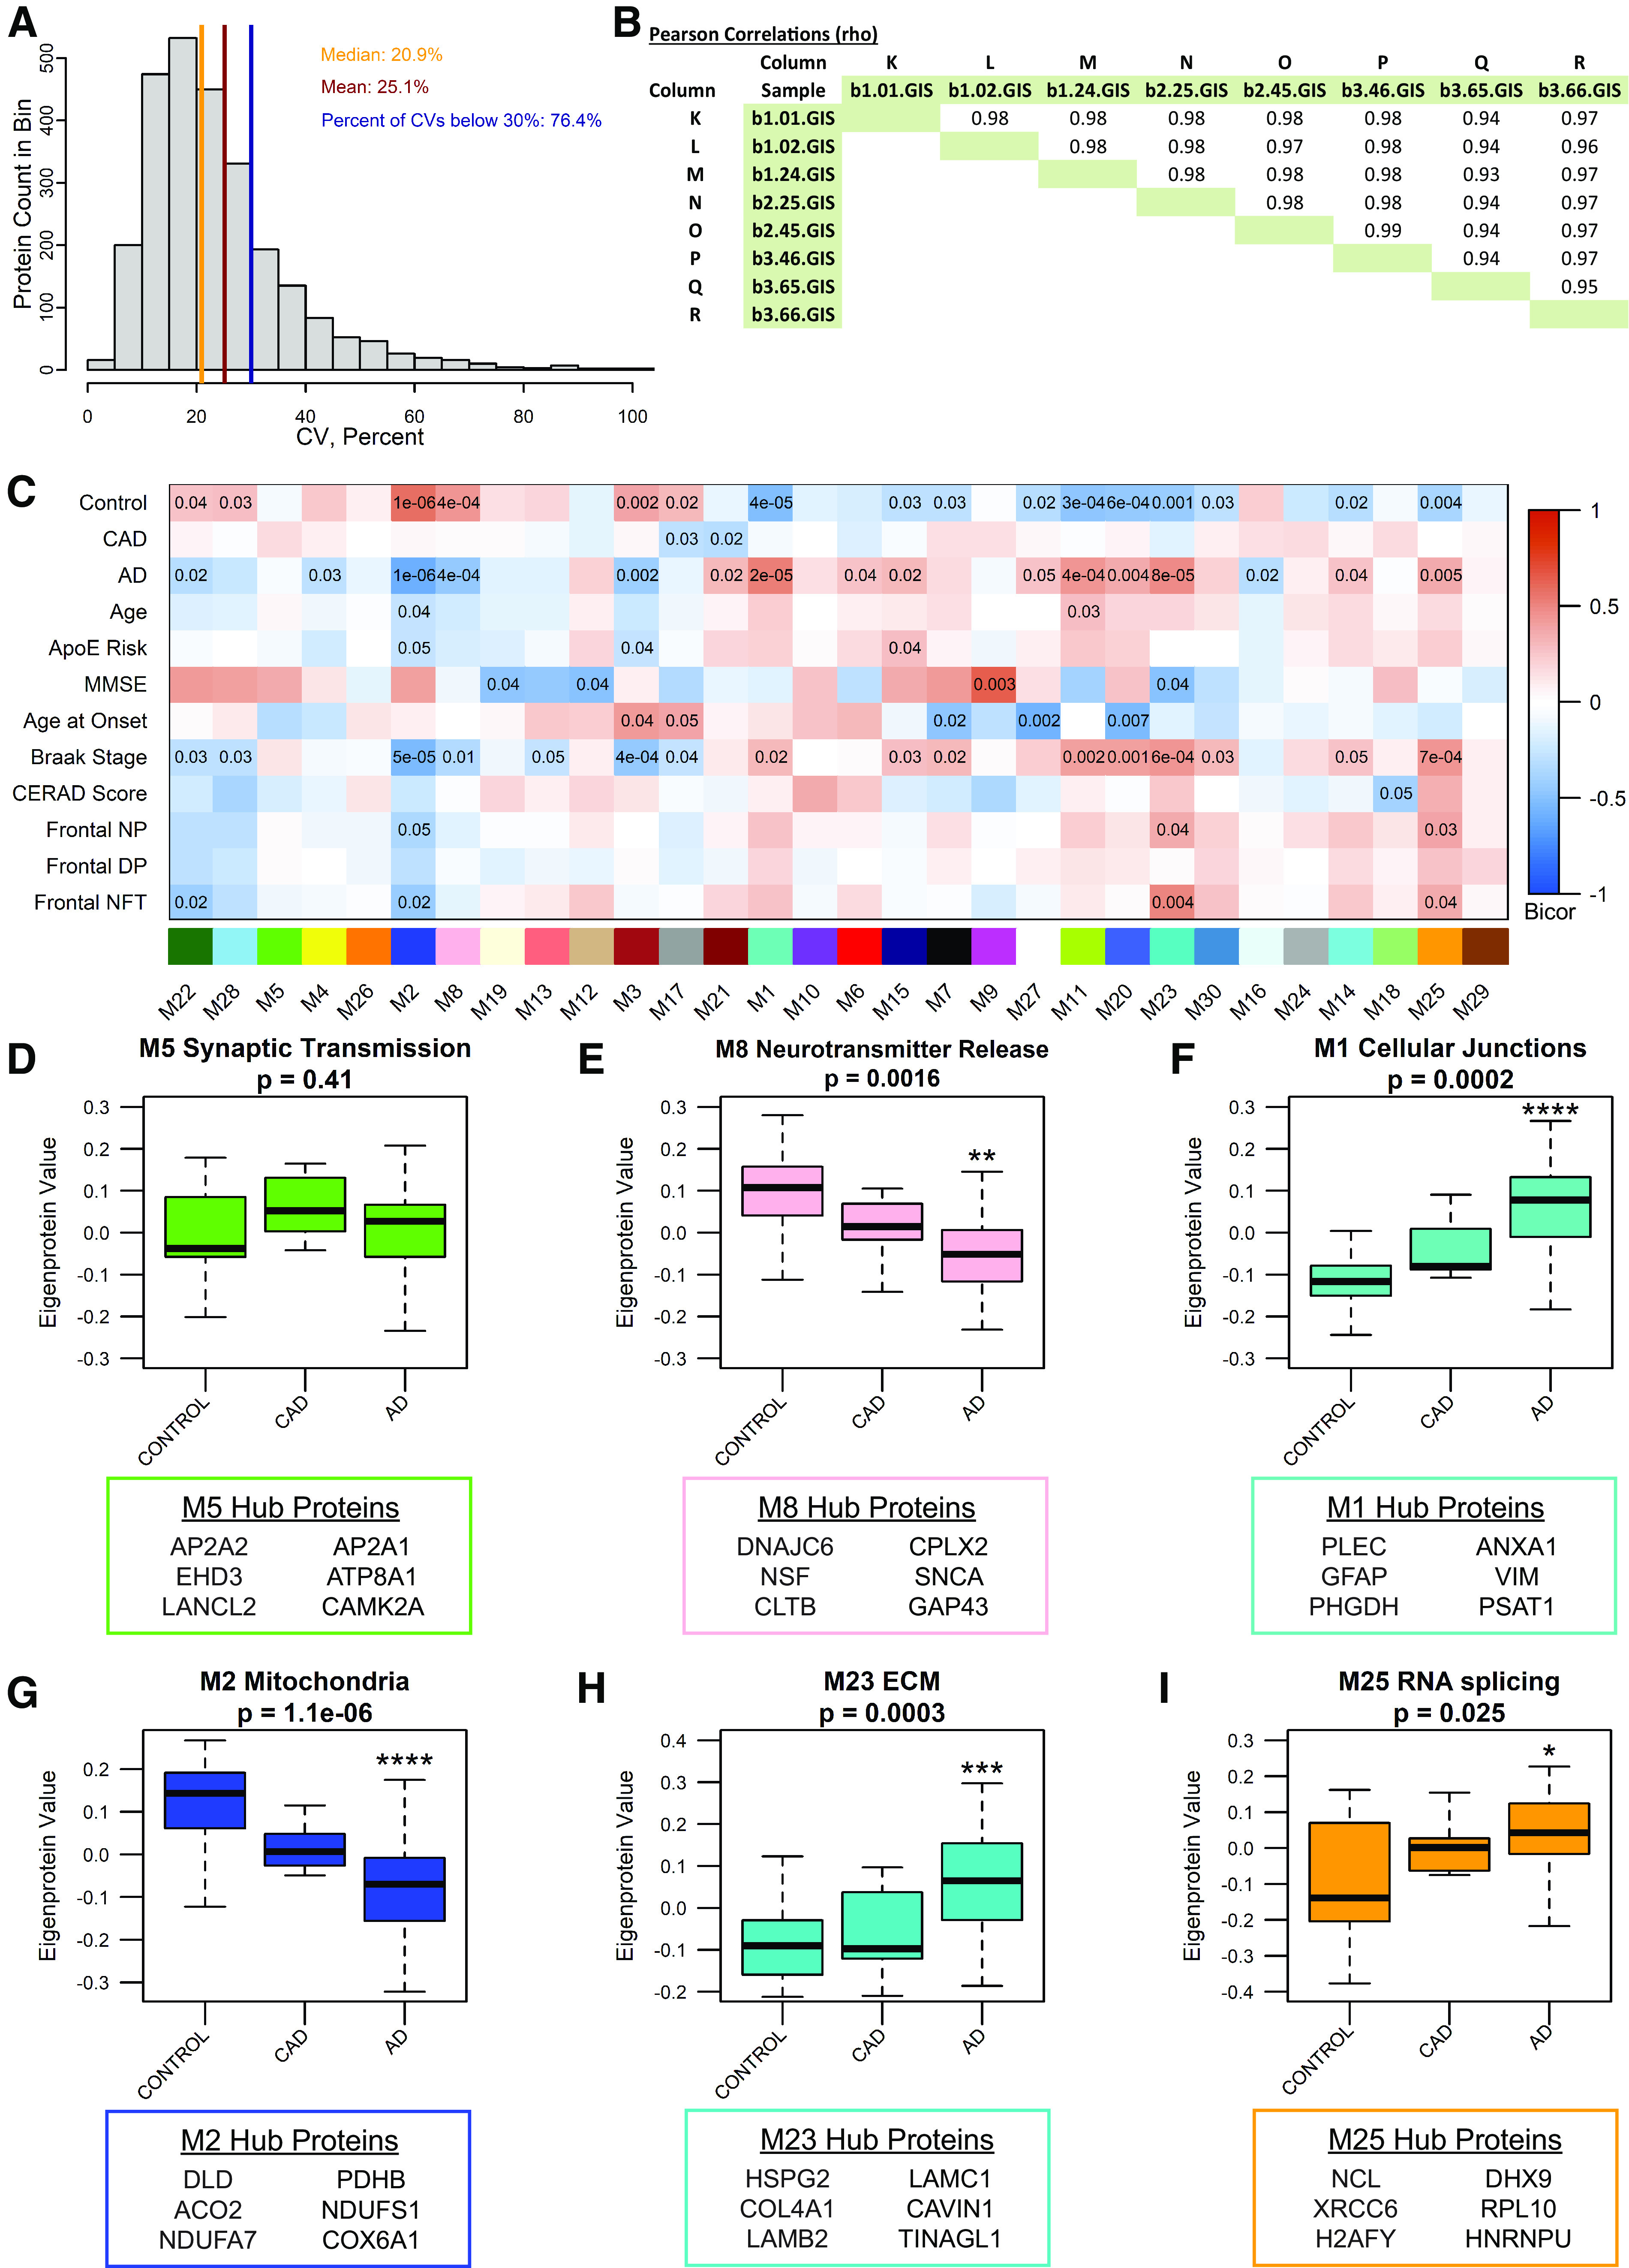
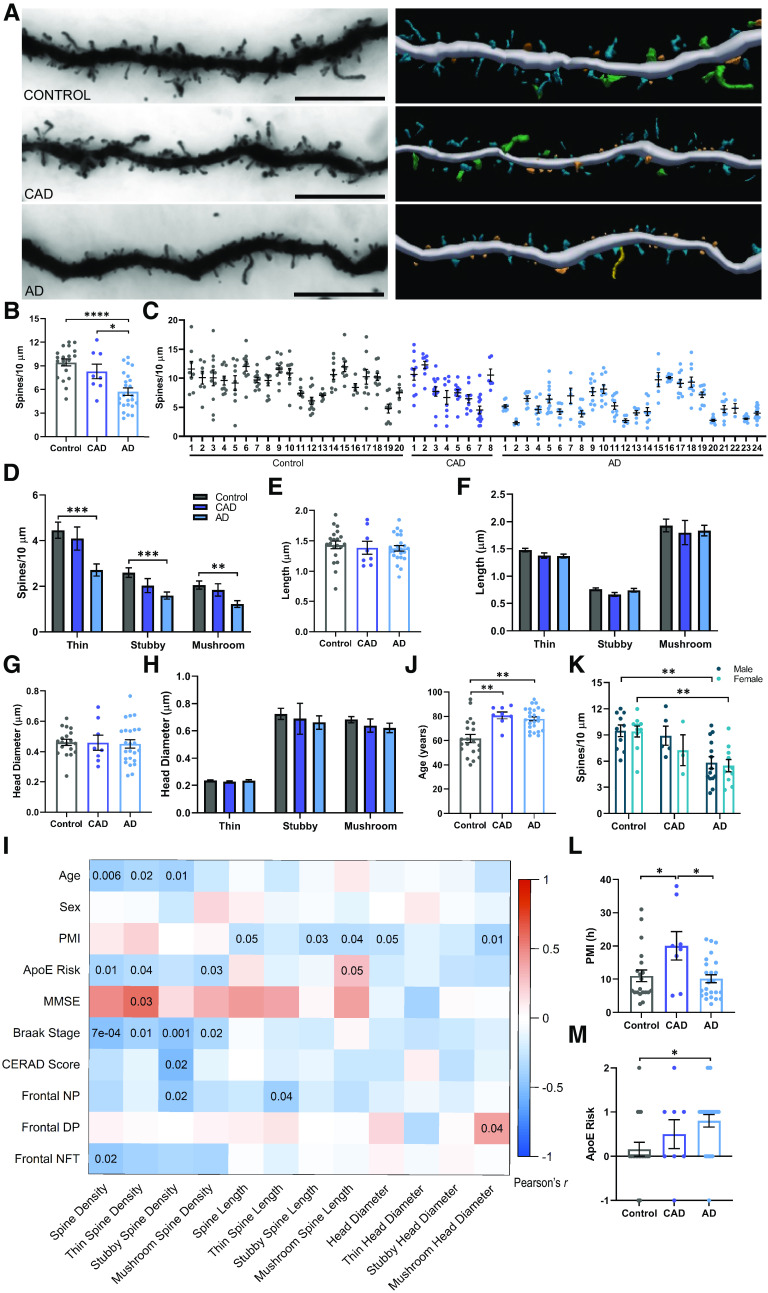
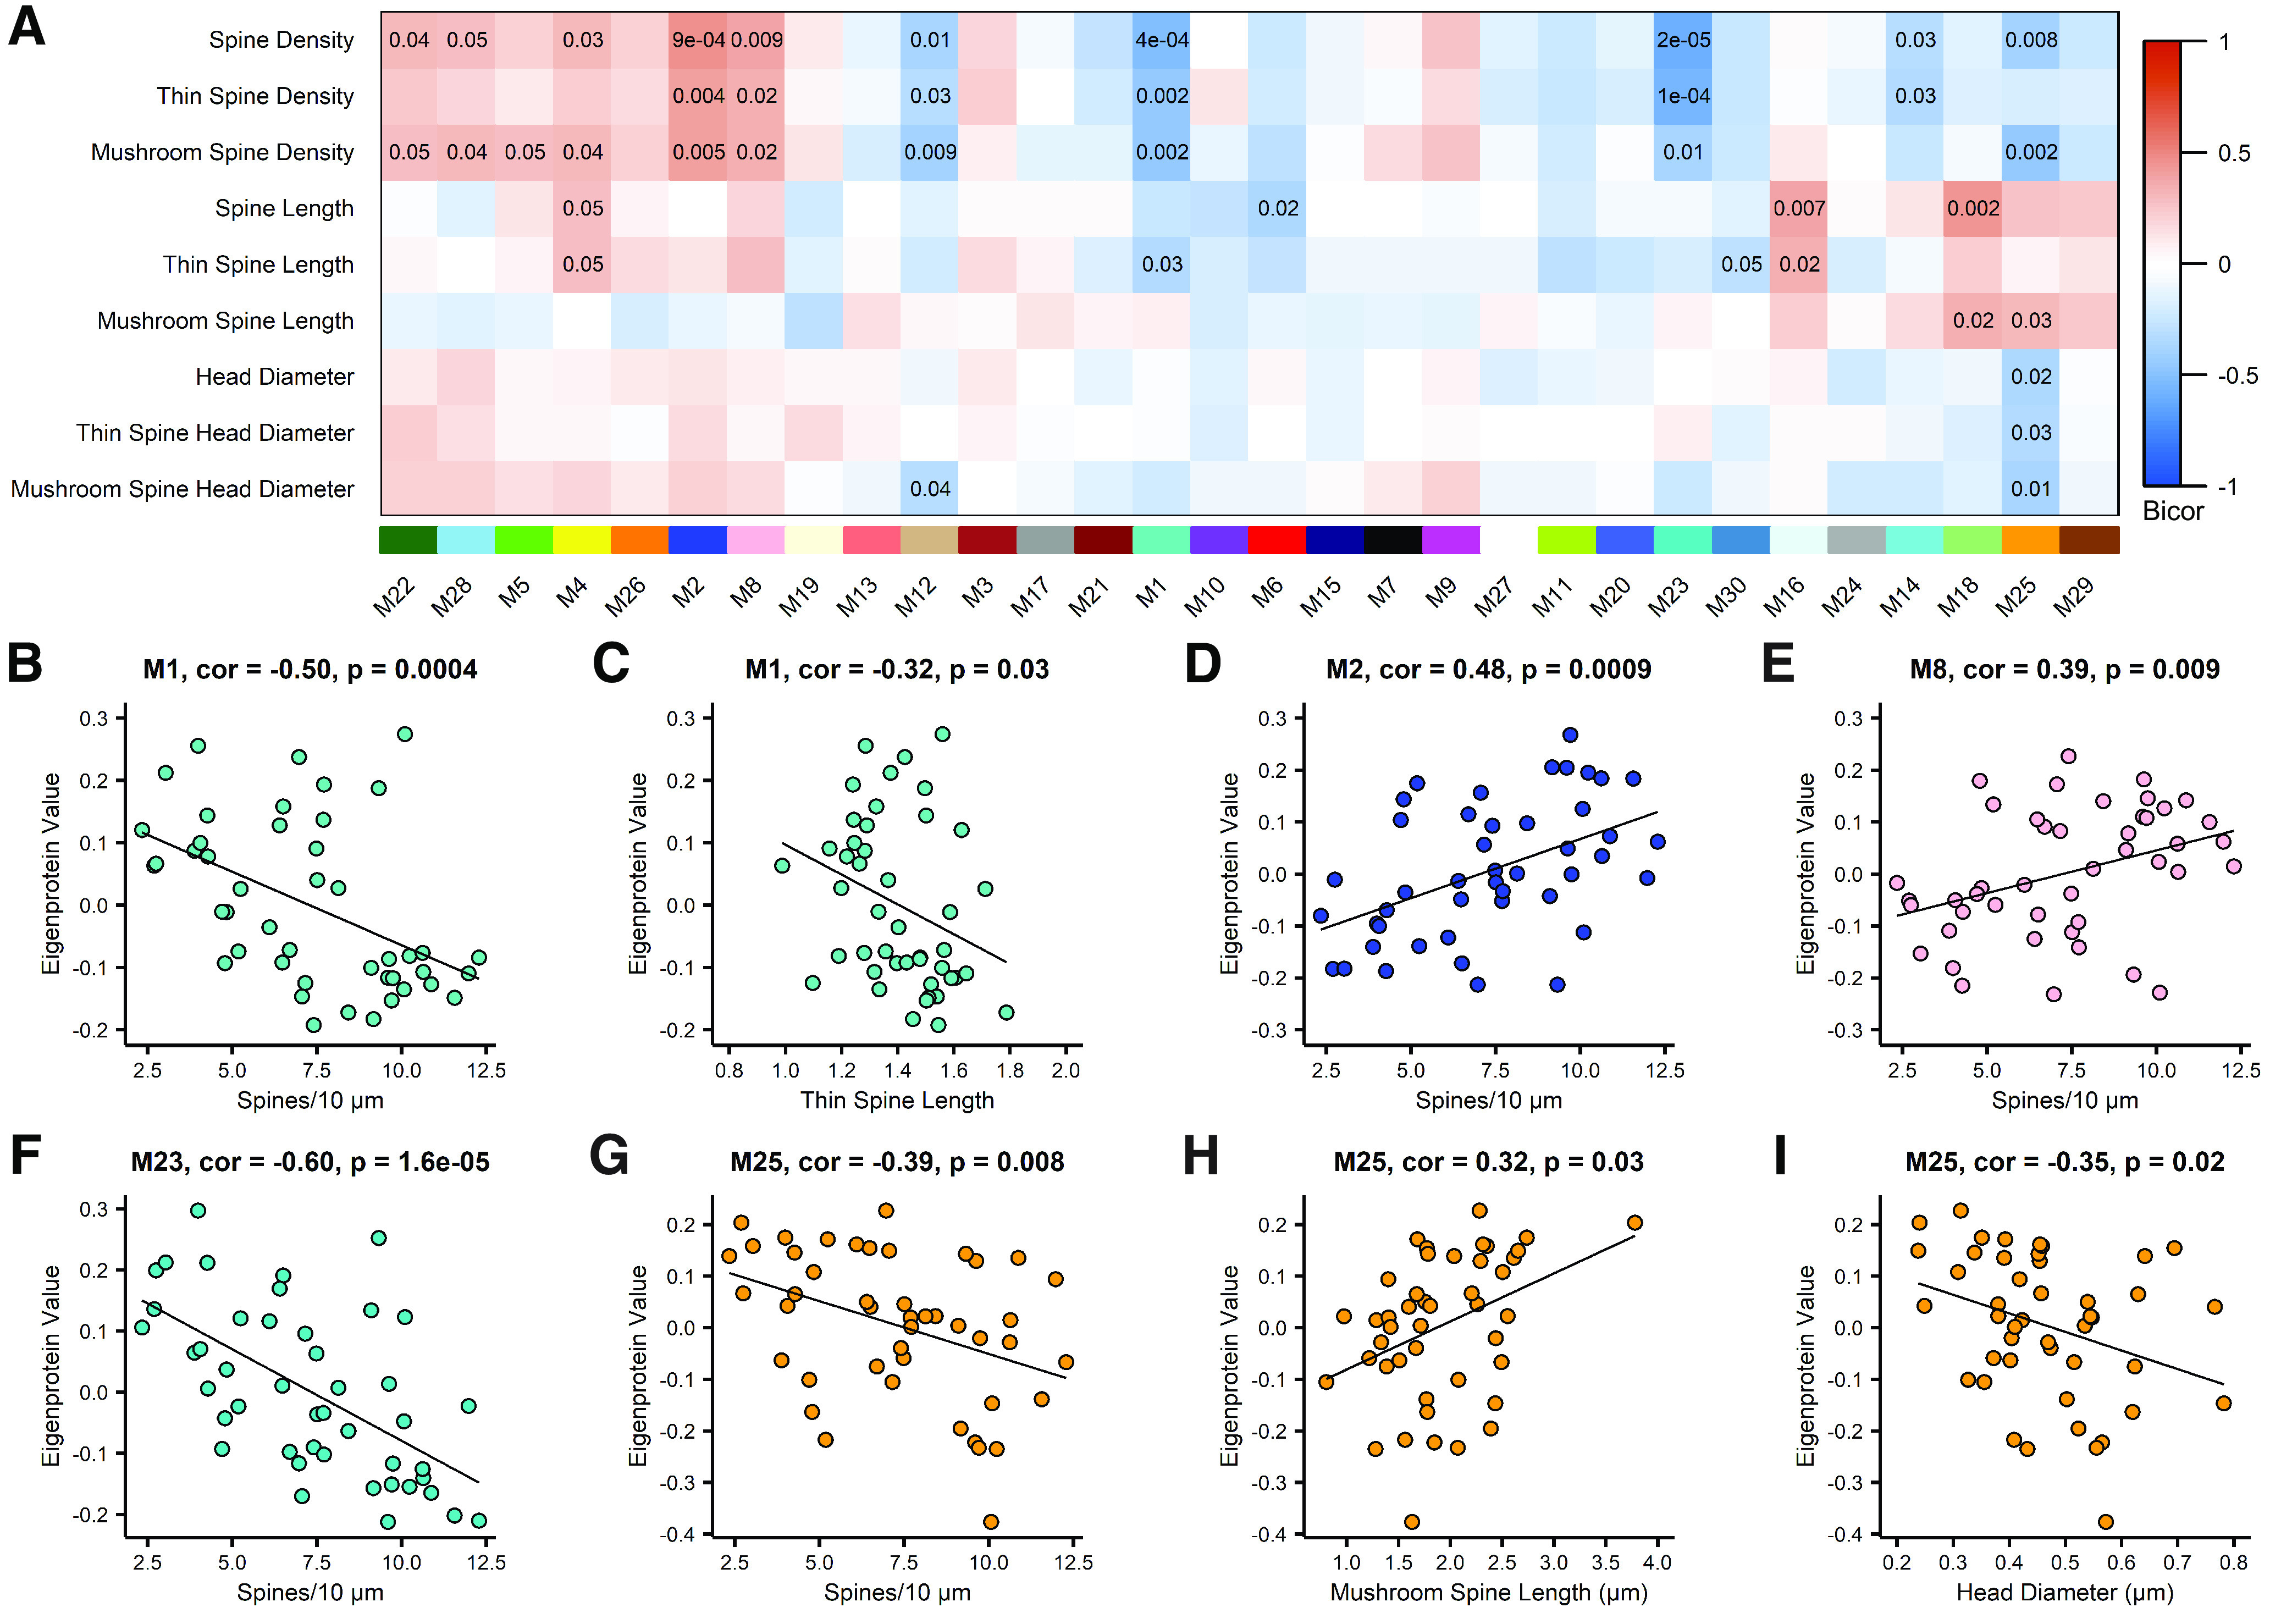
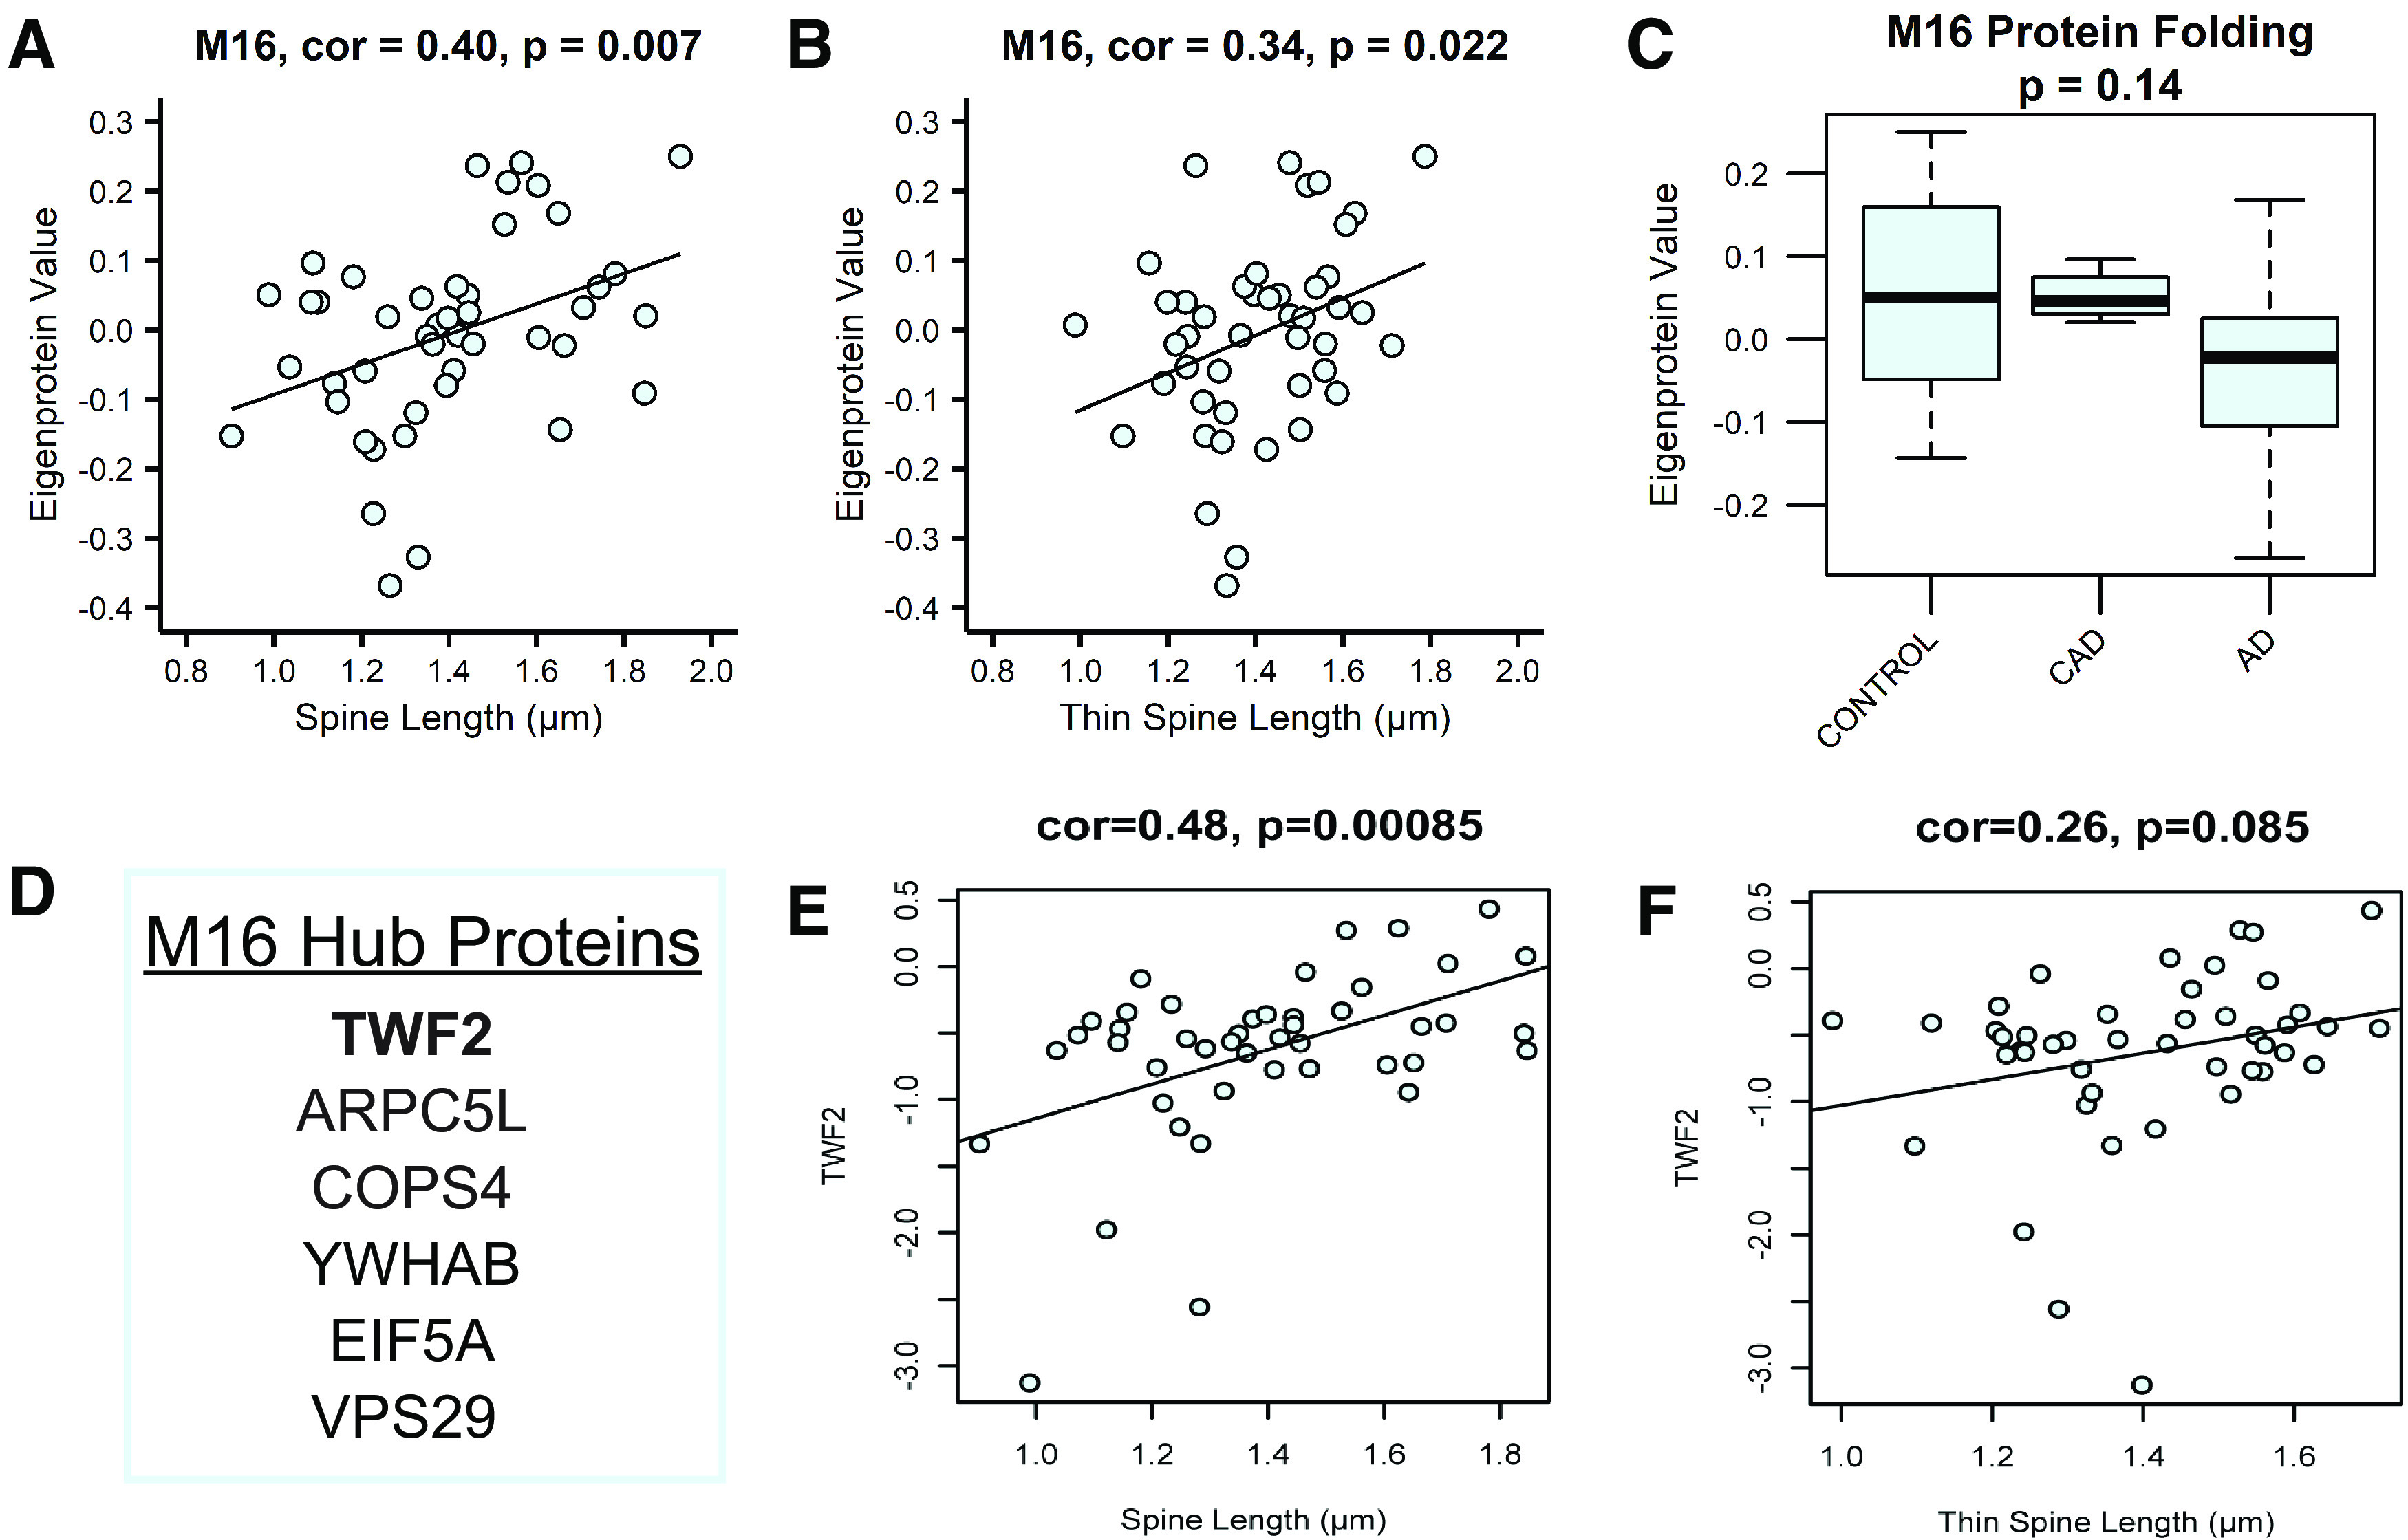
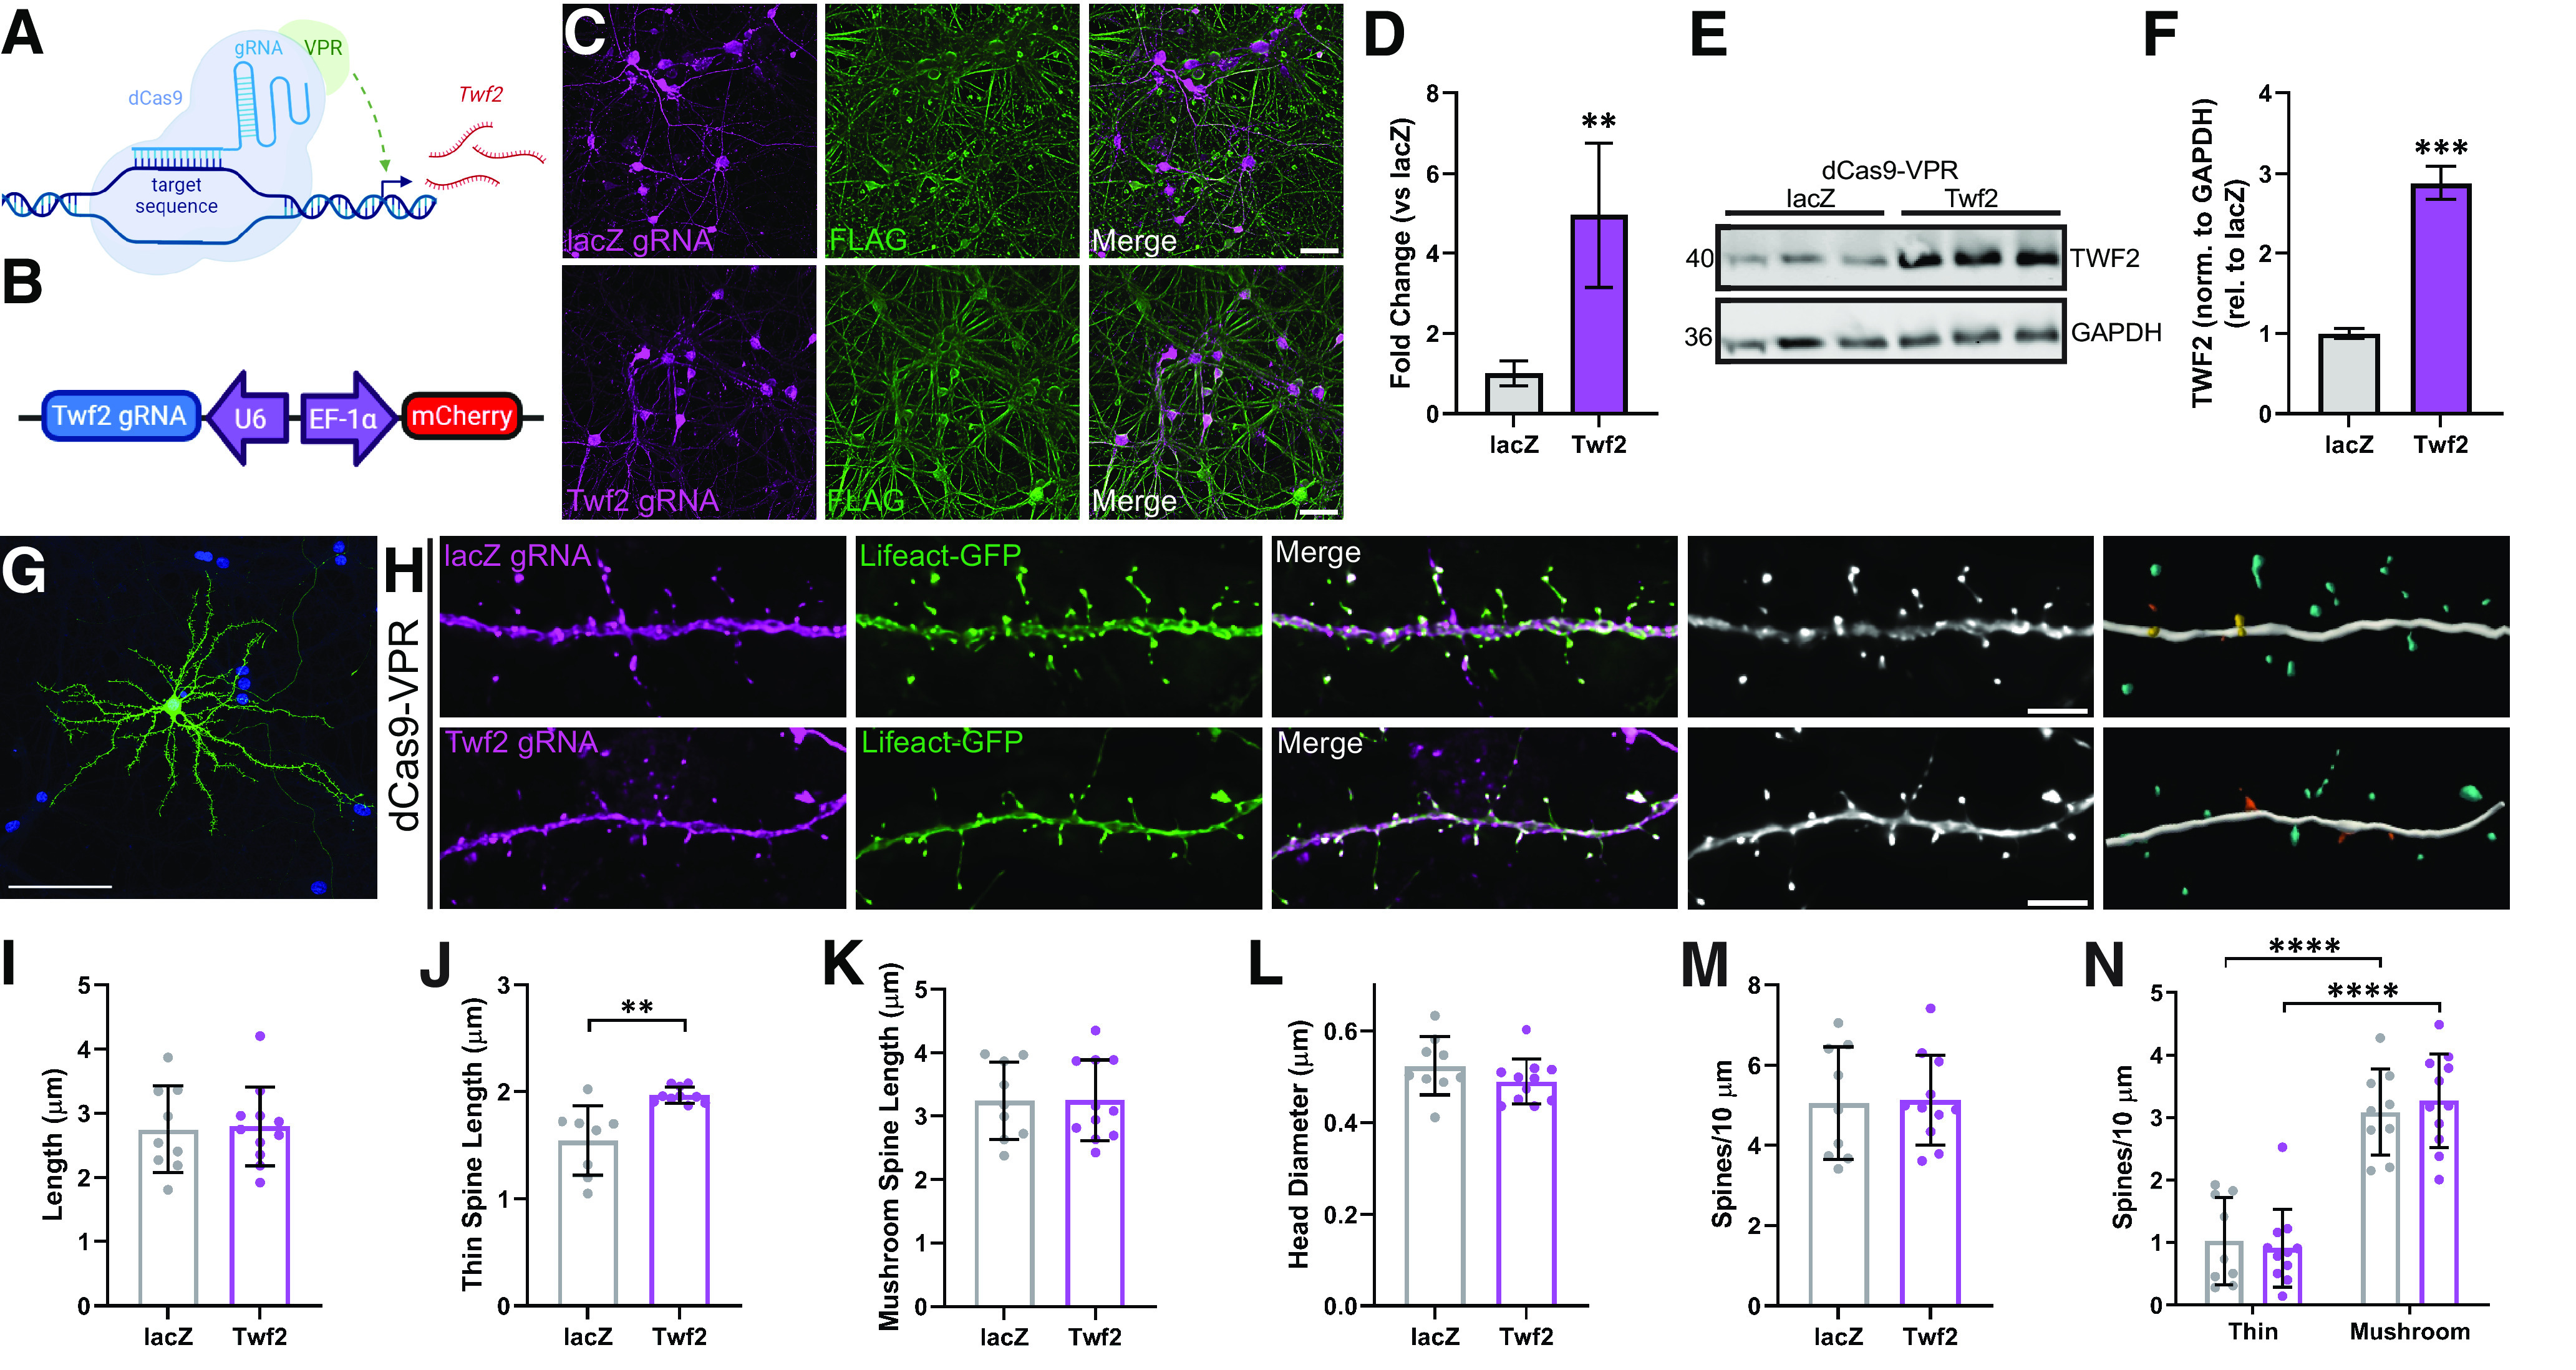
Proteomic studies using postmortem human brain tissue samples have yielded robust assessments of the aging and neurodegenerative disease(s) proteomes. While these analyses provide lists of molecular alterations in human conditions, like Alzheimer's disease (AD), identifying individual proteins that affect biological processes remains a challenge. To complicate matters, protein targets may be highly understudied and have limited information on their function. To address these hurdles, we sought to establish a blueprint to aid selection and functional validation of targets from proteomic datasets. A cross-platform pipeline was engineered to focus on synaptic processes in the entorhinal cortex (EC) of human patients, including controls, preclinical AD, and AD cases. Label-free quantification mass spectrometry (MS) data (n = 2260 proteins) was generated on synaptosome fractionated tissue from Brodmann area 28 (BA28; n = 58 samples). In parallel, dendritic spine density and morphology was measured in the same individuals. Weighted gene co-expression network analysis was used to construct a network of protein co-expression modules that were correlated with dendritic spine metrics. Module-trait correlations were used to guide unbiased selection of Twinfilin-2 (TWF2), which was the top hub protein of a module that positively correlated with thin spine length. Using CRISPR-dCas9 activation strategies, we demonstrated that boosting endogenous TWF2 protein levels in primary hippocampal neurons increased thin spine length, thus providing experimental validation for the human network analysis. Collectively, this study describes alterations in dendritic spine density and morphology as well as synaptic proteins and phosphorylated tau from the entorhinal cortex of preclinical and advanced stage AD patients.SIGNIFICANCE STATEMENT Proteomic studies can yield vast lists of molecules that are altered under various experimental or disease conditions. Here, we provide a blueprint to facilitate mechanistic validation of protein targets from human brain proteomic datasets. We conducted a proteomic analysis of human entorhinal cortex (EC) samples spanning cognitively normal and Alzheimer's disease (AD) cases with a comparison of dendritic spine morphology in the same samples. Network integration of proteomics with dendritic spine measurements allowed for unbiased discovery of Twinfilin-2 (TWF2) as a regulator of dendritic spine length. A proof-of-concept experiment in cultured neurons demonstrated that altering Twinfilin-2 protein level induced corresponding changes in dendritic spine length, thus providing experimental validation for the computational framework.

Keywords: Alzheimer's disease; dendritic spines; entorhinal cortex; proteomics; synapse; systems biology.


Figures

Figure 1.
Figure 1.
Overview of workflow. Synaptosomes were isolated from postmortem human BA28 entorhinal cortex (EC) and subjected to liquid chromatography tandem mass spectrometry-based proteomics. Weighted Gene Co-Expression Network Analysis (WGCNA) was used to generate a network of protein co-expression modules. BA28 EC samples were also Golgi stained and z-stacks of dendritic segments were imaged and digitally reconstructed to obtain measurements of dendritic spine density and morphology. Module eigenprotein values were correlated with dendritic spine metrics. The hub protein of a module significantly correlated with a dendritic spine metric would be selected for functional validation by CRISPR activation in rat primary hippocampal neurons.
Figure 2.
Figure 2.
Isolation of synaptosomes from postmortem human entorhinal cortex. A, Synaptosome fractions are enriched for PSD95 (postsynaptic marker) and synaptophysin (presynaptic marker), but have very low levels of GAPDH (nonsynaptic protein). N = 6 cases (2 control, 2 CAD, and 2 AD). B, Quantification of PSD95 band in A showing that PSD95 is significantly enriched in synaptosome fractions compared with whole homogenates. Mann–Whitney U test (U = 0.0, p = 0.0022). C, Quantification of synaptophysin band in A showing that synaptophysin is significantly enriched in synaptosome fractions compared with whole homogenates. Mann–Whitney U test (U = 0.0, p = 0.0022). D, Quantification of GAPDH band in A showing that GAPDH is present at significantly lower levels in synaptosome fractions, as compared with whole homogenates. Mann–Whitney U test (U = 0.0, p = 0.0022). For B–D, WH = whole homogenate, SYN = synaptosomes, a.u. = arbitrary units. Each point represents one case. Error bars represent the SD. E, F, Transmission electron micrographs (15000×) of the synaptosome fractions showing that these fractions contain synapses, as well as other cellular components, including mitochondria. Arrows indicate synapses, m = mitochondria. Scale bars = 400 nm.
Figure 3.
Figure 3.
Tau accumulates in synaptosomes in AD entorhinal cortex samples. A–E, Representative Western blottings for tau in human EC insoluble fractions. C indicates a control sample loaded on each Western blotting. F, Quantification of Western blottings of insoluble fractions probed for tau. AD cases harbor significantly greater amounts of tau in the insoluble fraction in the EC compared with controls. Kruskal–Wallis test (H(2) = 7.278, p = 0.0263) with Dunn's multiple comparisons test. *p = 0.021. G, AD insoluble fractions contained significantly more tau phosphorylated at S199 compared with insoluble fractions from both control and CAD cases. One-way ANOVA (F(2,54) = 14.68, p = 8.1 × 10⁻⁶) with Tukey's multiple comparisons test. *p = 0.011, ****p = 1.2 × 10⁻⁵. H, Insoluble tau phosphorylated at T231 was significantly increased in AD cases compared with control and CAD cases. Kruskal–Wallis test (H(2) = 27.62, p = 1.0 × 10⁻⁶) followed by Dunn's multiple comparisons test. *p = 0.037, ****p = 9.2 × 10⁻⁷. I, AD insoluble fractions contained significantly more tau phosphorylated at S396 compared with controls. Kruskal–Wallis test (H(2) = 29.49, p = 4.0 × 10⁻⁷) with Dunn's multiple comparisons test. ****p = 1.9 × 10⁻⁷. J–N, Representative western blot of tau in human EC synaptosomes. C indicates a control sample loaded on each Western blotting. O, Quantification of Western blottings of synaptosome fractions probed for tau. AD cases harbor significantly more tau in EC synaptosomes compared with controls. Kruskal–Wallis test (H(2) = 17.23, p = 0.0002) with Dunn's multiple comparisons test. ***p = 0.0001. P, Synaptosomal tau phosphorylated at S199 is not significantly different among control, CAD, and AD cases. Q, AD synaptosomes contain significantly more synaptosomal tau phosphorylated at T231 compared with controls. Kruskal–Wallis test (H(2) = 7.436, p = 0.0243) with Dunn's multiple comparisons test. *p = 0.02. R, AD synaptosomes contain significantly more synaptosomal tau phosphorylated at S396 compared with CAD cases. Kruskal–Wallis test (H(2) = 6.782, p = 0.0337) with Dunn's multiple comparisons test. *p < 0.028. N = 57 (19 control, 7 CAD, and 31 AD cases). Each point represents one case. Error bars represent SEM.
Figure 4.
Figure 4.
Biochemical measurements of phospho-tau strongly correlate with Braak stage. Pearson correlations between Braak stage and insoluble tau phosphorylated at (A) S199, (B) T231, and (C) S396, and synaptosomal tau phosphorylated at (D) S199, (E) T231, and (F) S396. N = 56 (19 control, 7 CAD, and 30 AD cases). Each point represents one case.
Figure 5.
Figure 5.
The entorhinal cortex synaptosomal proteome is altered in AD. A, The coefficient of variance (CV) for proteins having at least 50% nonmissing values in measurements of the global internal standards (GIS). The GIS are a pooled peptide mixture reference sample that serves as technical replicates. B, The Pearson correlation ρ values from least squares fit line calculations for all pairwise nonmissing proteins measured in GIS replicates. C, Biweight midcorrelation (bicor) for each module's eigenprotein abundance with case demographic and pathology data. Uncorrected p-values are shown for correlations with p < 0.05. D, Module 5, enriched for synaptic transmission-related gene ontology (GO) terms, is not differentially expressed between groups. E, Module 8 is described by GO terms related to synaptic transmission and neurotransmitter release. Module 8 is differentially expressed among groups, with reduced eigenprotein abundance in AD compared with control. One-way ANOVA (F(2,54) = 7.27, p = 0.0016) with Tukey's multiple comparisons test. **p = 0.0011. F, Module 1, containing cellular junction-related proteins, is differentially expressed among groups, with significantly higher expression in AD compared with control. Kruskal–Wallis test (H(2) = 17.60, p = 0.0002), followed by pairwise Wilcoxon rank sum exact test with Benjamini-Hochberg adjustment. ****p = 6.1 × 10⁻⁵. G, The mitochondrial module, Module 2, eigenprotein expression differs among groups, with significantly reduced expression in AD compared with control. One-way ANOVA (F(2,54) = 17.94, p = 1.06 × 10⁻⁶) with Tukey's multiple comparisons test. ****p = 6.0 × 10⁻⁷. H, Module 23 is described by GO terms related to the extracellular matrix, and is differentially expressed among groups, with significantly higher expression in AD compared with control. One-way ANOVA (F(2,54) = 9.413, p = 0.0003) with Tukey's multiple comparisons test. ***p = 0.00,036. I, Module 25 is enriched for GO terms related to RNA splicing. Module 25 eigenprotein expression differs among groups, with significantly higher expression in AD compared with control. Kruskal–Wallis test (H(2) = 7. 353, p = 0.025), followed by pairwise Wilcoxon rank sum exact test with Benjamini-Hochberg adjustment. *p = 0.032. For D–I, N = 57 (19 Control, 7 CAD, 31 AD). Error bars represent the 25th and 75th percentiles. * indicates significant difference compared with control group. The top 6 hub proteins for each module are listed below the corresponding boxplot. See Extended Data Tables 5-1 and 5-2 for lists of module members and connectivity values (kME), and gene ontologies for each module.
Figure 6.
Figure 6.
Entorhinal cortex spine density is reduced in AD. A, Representative brightfield images (left) and three-dimensional reconstructions (right) of Golgi-stained dendrites from control (top), CAD (middle), and AD (bottom) cases. Scale bar = 10 µm. In the reconstructions, blue = thin, orange = stubby, green = mushroom, and yellow = filopodia. B, Dendritic spine density is reduced in AD, but maintained in CAD cases. One-way ANOVA (F(2,49) = 15.36, p < 7.0 × 10⁻⁶) followed by Tukey's multiple comparisons test. *p = 0.019, ****p = 5.0 × 10⁻⁶. C, Dendritic spine density per dendrite for each case. Case numbering corresponds to Tables 1 and 2. Each point represents one dendrite. N = 3–17 dendrites per case. D, Thin, stubby, and mushroom spine densities are reduced in AD compared with controls. One-way ANOVA (Thin: F(2,49) = 8.422, p = 0.0007; Stubby: F(2,49) = 7.680, p = 0.0013; Mushroom: F(2,49) = 7.115, p = 0.0019) with Tukey's multiple comparisons test. Thin ***p = 0.0007, Stubby ***p = 0.0008, Mushroom **p = 0.0017. E, No differences in dendritic spine length were observed between groups. F, Dendritic spine length of thin, stubby, and mushroom spines did not differ between groups. G, No differences in dendritic spine head diameter were observed between groups. H, Head diameter on thin, stubby, and mushroom spines was similar between groups. I, Pearson correlations between dendritic spine measurements and case demographic and pathology data. Uncorrected p-values are shown for correlations with p < 0.05. PMI = postmortem interval, MMSE = Mini-Mental State Examination, NP = neuritic plaques, DP = diffuse plaques, NFT = neurofibrillary tangles. J, CAD and AD cases were significantly older than controls. Kruskal–Wallis test (H(2) = 16.18, p = 0.0003) with Dunn's multiple comparisons test. Control versus CAD **p = 0.004, Control versus AD **p = 0.0014. K, There were no sex differences in dendritic spine density – males and females exhibited a similar reduction in dendritic spine density in the EC in AD. Two-way ANOVA (main effect of diagnosis: F(2,46) = 14.56, p = 1.3 × 10⁻⁵) with Šídák's multiple comparisons test. Male **p = 0.0062, Female **p = 0.0071. L, The PMI before brain collection was longer for CAD cases compared with controls and AD cases. One-way ANOVA (F(2,49) = 4.913, p = 0.0114) with Tukey's multiple comparisons test. CAD versus Control *p = 0.024, versus AD *p = 0.01. M, ApoE risk is higher in AD cases, compared with controls. Calculation of ApoE risk is described in Materials and Methods. One-way ANOVA (F(2,49) = 4.114, p = 0.0223) with Tukey's multiple comparisons test. *p = 0.017. N = 20 Control, 8 CAD, and 24 AD cases. N = 52 (20 control, 8 CAD, and 24 AD), unless specified otherwise. Each point represents one case. Error bars indicate SEM.
Figure 7.
Figure 7.
Protein co-expression modules correlate with dendritic spine density and morphology. A, Biweight midcorrelations (bicor) between module eigenprotein expression and dendritic spine measurements. Uncorrected p-values are shown for correlations with p < 0.05. B, There is a significant inverse correlation between Module 1 eigenprotein abundance and spine density. C, Module 1 eigenprotein abundance is significantly inversely correlated with thin spine length. D, Eigenprotein expression of Module 2 is significantly positively correlated with spine density. E, Module 8 eigenprotein abundance exhibits a significant positive correlation with spine density. F, Module 23 eigenprotein abundance exhibits a significant inverse correlation with spine density. G, Module 25 is significantly inversely correlated with spine density. H, Eigenprotein expression of Module 25 is positively correlated with mushroom spine length. I, There is a significant inverse correlation between Module 25 eigenprotein expression and dendritic spine head diameter. Correlations were assessed by bicor. Each point represents one case. N = 45 (17 Control, 6 CAD, 22 AD).
Figure 8.
Figure 8.
Relative protein abundance of TWF2 positively correlates with spine length. A, Module 16 eigenprotein abundance exhibits a significant positive correlation with dendritic spine length. B, Module 16 eigenprotein abundance is significantly positively correlated with thin spine length. Each point represents one case. N = 45 (17 Control, 6 CAD, 22 AD). C, Gene ontology (GO) for Module 16 indicates involvement in protein folding. Module 16 eigenprotein abundance does not differ among control, CAD, and AD synaptosomes. N = 57 (19 Control, 7 CAD, 31 AD). Error bars indicate the 25th and 75th percentiles. D, The top 6 hub proteins for Module 16 are shown. TWF2 is the top hub protein. E, Log2-transformed relative protein abundance of TWF2 positively correlates with spine length. F, Log2-transformed relative protein abundance of TWF2 was plotted against thin spine length. For E, F, points represent individual cases and the best fit line was determined via linear model. For A, B, E, F, correlations were assessed by biweight midcorrelation (bicor).
Figure 9.
Figure 9.
CRISPRa targeting Twf2 increases thin spine length. A, Schematic of CRISPR activation (CRISPRa) targeting Twf2. CRISPR guide RNAs (gRNAs) target the transcriptional activator, dCas9-VPR, to the target sequence to upregulate transcription of the gene of interest, Twf2. B, Schematic of the CRISPRa guide RNA used to target Twf2. The gRNA is expressed under the control of a U6 promoter. The construct co-expresses mCherry under an EF-1α promoter. C, Representative images showing colocalization of dCas9-VPR (FLAG) and CRISPR gRNAs (mCherry) in DIV14 rat primary hippocampal neurons. Scale bar = 50 µm. D, CRISPRa targeting Twf2 increases Twf2 mRNA 5-fold compared with lacZ. Unpaired t test (t(6) = 4.320, p = 0.005). N = 4 lacZ and 4 Twf2. E, Western blotting for TWF2 on rat primary hippocampal neuron lysates demonstrates increased TWF2 levels following CRISPRa targeting Twf2. J, Quantification in F reveals that CRISPRa targeting Twf2 increases TWF2 protein 3-fold in rat primary hippocampal neurons, compared with lacZ nontargeting control. Unpaired t test (t(4) = 14.57, p = 0.0001). N = 3 lacZ and 3 Twf2. G, Representative image showing single hippocampal pyramidal neuron transfected with Lifeact-GFP. Nuclei in blue. Scale bar = 100 µm. H, Representative images showing colocalization of lacZ or Twf2 gRNAs with Lifeact-GFP (images 1–3), as well as the deconvolved image (image 4) and 3D reconstruction (image 5). Scale bar = 5 µm. I, Overall dendritic spine length was not altered by CRISPRa targeting Twf2 in rat primary hippocampal neurons, compared with lacZ control. J, Elevating TWF2 abundance increased thin spine length in rat primary hippocampal neurons compared with CRISPRa targeting lacZ. Mann–Whitney U test (U = 7.0, p = 0.0019). N = 8 lacZ and 10 Twf2. K, CRISPRa targeting Twf2 had no effect on mushroom spine length, in comparison to the lacZ nontargeting control. L, Dendritic spine head diameter was comparable following CRISPRa targeting of lacZ and Twf2. M, Dendritic spine density did not differ following CRISPRa targeting of Twf2 or lacZ. N, Mushroom spine density is greater than thin spine density in rat primary hippocampal neuron cultures, with no effect of CRISPR manipulation on the density of each spine subclass. Two-way ANOVA (main effect of spine subclass: F(1,36) = 101.4, p = 5.1 × 10⁻¹²) with Šídák's multiple comparisons test. lacZ ****p = 5.0 × 10⁻⁶, Twf2 ****p = 3.2 × 10⁻⁹. For I–N, N = 9 lacZ and 11 Twf2. Each point represents one dendrite. Error bars represent the SD.

Similar articles

Cited by

References

    1. Bai B, et al. . (2020) Deep multilayer brain proteomics identifies molecular networks in Alzheimer's disease progression. Neuron 105:975–991.e7. 10.1016/j.neuron.2019.12.015 - DOI - PMC - PubMed
    1. Barabási AL, Gulbahce N, Loscalzo J (2011) Network medicine: a network-based approach to human disease. Nat Rev Genet 12:56–68. 10.1038/nrg2918 - DOI - PMC - PubMed
    1. Barria A, Malinow R (2005) NMDA receptor subunit composition controls synaptic plasticity by regulating binding to CaMKII. Neuron 48:289–301. 10.1016/j.neuron.2005.08.034 - DOI - PubMed
    1. Bennett DA, Schneider JA, Arvanitakis Z, Kelly JF, Aggarwal NT, Shah RC, Wilson RS (2006) Neuropathology of older persons without cognitive impairment from two community-based studies. Neurology 66:1837–1844. 10.1212/01.wnl.0000219668.47116.e6 - DOI - PubMed
    1. Bilousova T, Miller CA, Poon WW, Vinters HV, Corrada M, Kawas C, Hayden EY, Teplow DB, Glabe C, Albay R 3rd, Cole GM, Teng E, Gylys KH (2016) Synaptic amyloid-β oligomers precede p-Tau and differentiate high pathology control cases. Am J Pathol 186:185–198. 10.1016/j.ajpath.2015.09.018 - DOI - PMC - PubMed

Publication types