. 2023 Apr;33(4):632-643.
doi: 10.1101/gr.276386.121. Epub 2023 Apr 13.

Inferring the mode and strength of ongoing selection

Affiliations

Inferring the mode and strength of ongoing selection

Gustavo V Barroso et al. Genome Res. 2023 Apr.

Abstract

Genome sequence data are no longer scarce. The UK Biobank alone comprises 200,000 individual genomes, with more on the way, leading the field of human genetics toward sequencing entire populations. Within the next decades, other model organisms will follow suit, especially domesticated species such as crops and livestock. Having sequences from most individuals in a population will present new challenges for using these data to improve health and agriculture in the pursuit of a sustainable future. Existing population genetic methods are designed to model hundreds of randomly sampled sequences but are not optimized for extracting the information contained in the larger and richer data sets that are beginning to emerge, with thousands of closely related individuals. Here we develop a new method called trio-based inference of dominance and selection (TIDES) that uses data from tens of thousands of family trios to make inferences about natural selection acting in a single generation. TIDES further improves on the state of the art by making no assumptions regarding demography, linkage, or dominance. We discuss how our method paves the way for studying natural selection from new angles.


Figures

Figure 1.
Figure 1.
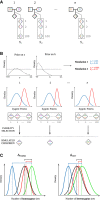
Schematic representation of TIDES. (A) Observed family trios (black outline) together with the zygotes generated from parental haplotypes (gray outline). (B) Illustration of the TIDES simulation engine for two draws from the prior distribution of s and h, representing strong (blue) and weak (red) values of selection. The middle row shows the computation of zygotic fitness and natural selection. (C) Comparison between the observed summary statistics (black offspring/green parents) and the summary statistics from the simulations using the selection parameters from the prior distribution (red and blue). The left panel shows the comparison of the number of homozygous genotypes (ΔHOMO), and the right panel shows the comparison for the number of heterozygous genotypes (ΔHET). In this example, the values of s and h from the red parameter combination better fit the observed data than do the parameters shown in blue.
Figure 2.
Figure 2.
Inference of s from a genome-wide set of deleterious SNPs for different strengths of selection (weak: s = −0.0001; moderate: s = −0.001; strong: s = −0.01) and dominance effects (recessive: h = 0; additive: h = 0.5). Each scenario includes the estimates from 10 simulated data sets. True values are shown as black horizontal segments, with medians of the inferred posterior distributions denoted by gray circles and their 95% credible intervals by gray vertical lines. The y-axis is in log10 scale; all values are in absolute numbers. Here, 50,000 trios are used.
Figure 3.
Figure 3.
Inference of s from a genome-wide set of deleterious SNPs under complex models of selection. Each scenario includes the estimates from 10 simulated data sets. Left panel shows the results when the true DFE follows a gamma-distribution (mean value of s shown by black horizontal line). The right panel shows the case in which there was a 10-fold reduction in the selection coefficient. Ancient and current values of s shown by dashed and solid horizontal lines, respectively. Medians of the inferred posterior distributions denoted by gray circles and their 95% credible intervals by gray vertical lines. The y-axis is in log10 scale; all values are in absolute numbers. Here, 50,000 trios are used.
Figure 4.
Figure 4.
Inference of s for a single deleterious SNP with different dominance effects. Each scenario includes the estimates from 10 simulated data sets. Columns show different values of the true selection coefficient, and rows show different sample sizes, in terms of the number of trios used. True values are shown as black horizontal segments, with medians of the inferred posterior distributions denoted by gray shapes and their 95% credible intervals by gray vertical lines. The y-axis is in log10 scale; all values are in absolute numbers.
Figure 5.
Figure 5.
Inference of s from a single beneficial SNP with different dominance effects. Each scenario includes the estimates from 10 simulated data sets. Columns show different values of the true selection coefficient, and rows show different sample sizes, in terms of the number of trios used. True values are shown as black horizontal segments, with medians of the inferred posterior distributions denoted by gray shapes and their 95% credible intervals by gray vertical lines. The y-axis is in log10 scale.
Figure 6.
Figure 6.
Inference of h from a genome-wide set of deleterious SNPs for different strengths of selection (weak: s = −0.0001; moderate: s = −0.001; strong: s = −0.01) and dominance effects (recessive: h = 0; additive: h = 0.5). Each scenario includes the estimates from 10 simulated data sets. True values are shown as black horizontal segments, with medians of the inferred posterior distributions denoted by gray circles and their 95% credible intervals by gray vertical lines. Each scenario includes 50,000 trios.
Figure 7.
Figure 7.
TIDES can accurately distinguish among neutral, recessive, and additive models of selection. True models are shown above each simplex (weak: s = −0.0001; moderate: s = −0.001; strong: s = −0.01; recessive: h = 0; additive: h = 0.5). The coordinates along each axis denote posterior probabilities assigned to the respective model. The color of each tile represents the proportion of simulations that fall within that probability bin (scale shown at far right).

Similar articles

Cited by

References

    1. Agrawal AF, Whitlock MC. 2011. Inferences about the distribution of dominance drawn from yeast gene knockout data. Genetics 187: 553–566. 10.1534/genetics.110.124560 - DOI - PMC - PubMed
    1. Alonge M, Wang X, Benoit M, Soyk S, Pereira L, Zhang L, Suresh H, Ramakrishnan S, Maumus F, Ciren D, et al. 2020. Major impacts of widespread structural variation on gene expression and crop improvement in tomato. Cell 182: 145–161.e23. 10.1016/j.cell.2020.05.021 - DOI - PMC - PubMed
    1. Barroso GV, Dutheil JY. 2021. Mutation rate variation shapes genome-wide diversity in Drosophila melanogaster. bioRxiv 10.1101/2021.09.16.460667 - DOI
    1. Barton N, Hermisson J, Nordborg M. 2019. Population genetics: why structure matters. eLife 8: e45380. 10.7554/eLife.45380 - DOI - PMC - PubMed
    1. Bates S, Sesia M, Sabatti C, Candès E. 2020. Causal inference in genetic trio studies. Proc Natl Acad Sci 117: 24117–24126. 10.1073/pnas.2007743117 - DOI - PMC - PubMed

Publication types