. 2023 Apr 13;14(1):2093.
doi: 10.1038/s41467-023-37699-z.

Excessive serine from the bone marrow microenvironment impairs megakaryopoiesis and thrombopoiesis in Multiple Myeloma

Affiliations

Excessive serine from the bone marrow microenvironment impairs megakaryopoiesis and thrombopoiesis in Multiple Myeloma

Chunmei Kuang et al. Nat Commun. .

Abstract

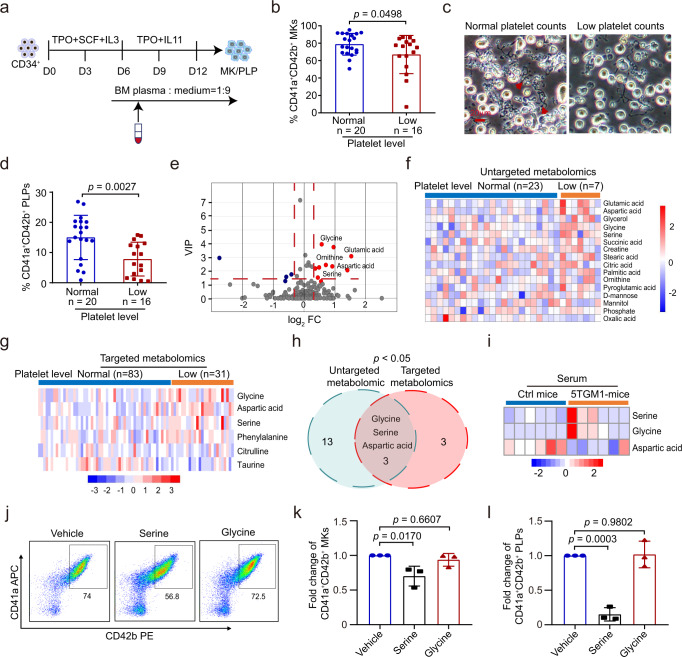
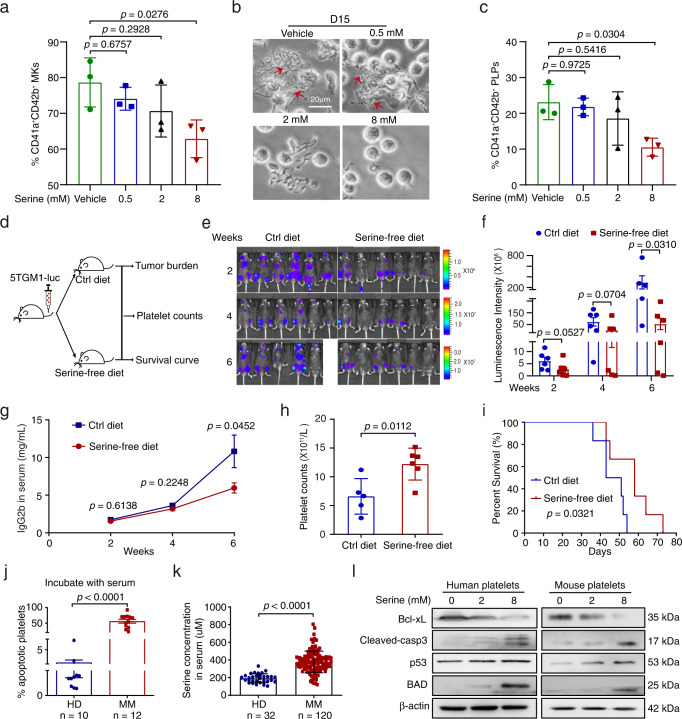
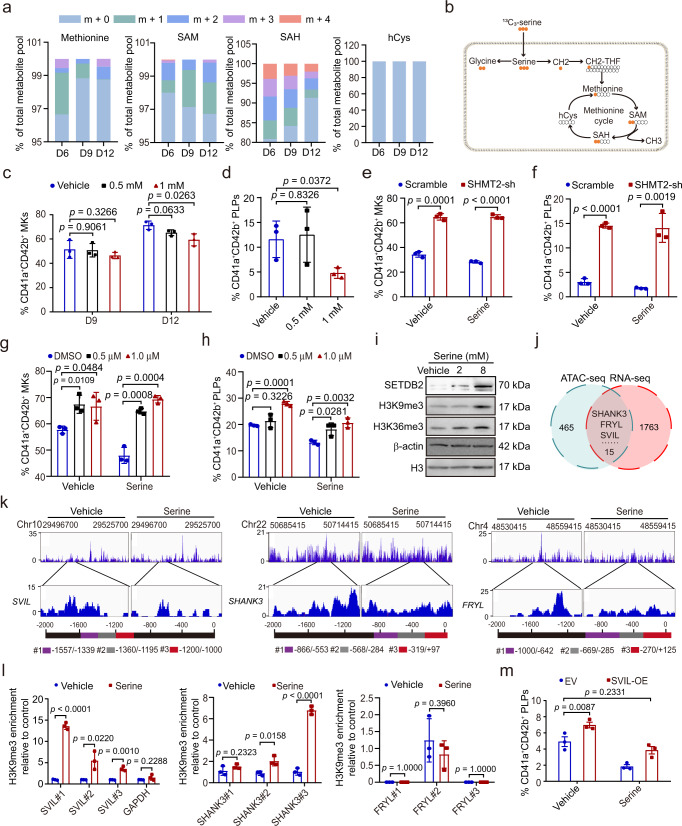
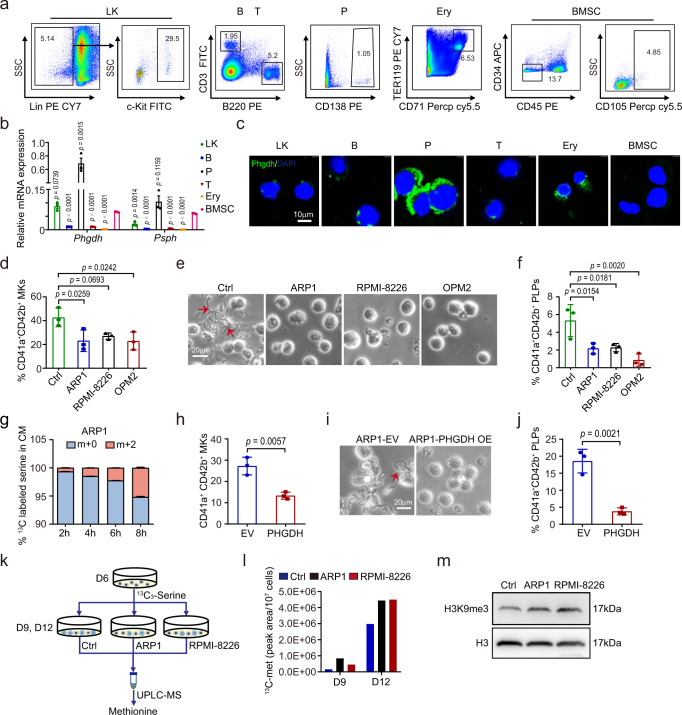
Thrombocytopenia is a major complication in a subset of patients with multiple myeloma (MM). However, little is known about its development and significance during MM. Here, we show thrombocytopenia is linked to poor prognosis in MM. In addition, we identify serine, which is released from MM cells into the bone marrow microenvironment, as a key metabolic factor that suppresses megakaryopoiesis and thrombopoiesis. The impact of excessive serine on thrombocytopenia is mainly mediated through the suppression of megakaryocyte (MK) differentiation. Extrinsic serine is transported into MKs through SLC38A1 and downregulates SVIL via SAM-mediated tri-methylation of H3K9, ultimately leading to the impairment of megakaryopoiesis. Inhibition of serine utilization or treatment with TPO enhances megakaryopoiesis and thrombopoiesis and suppresses MM progression. Together, we identify serine as a key metabolic regulator of thrombocytopenia, unveil molecular mechanisms governing MM progression, and provide potential therapeutic strategies for treating MM patients by targeting thrombocytopenia.


Conflict of interest statement

The authors declare no competing interests.

Figures

Fig. 1
Fig. 1. Thrombocytopenia is linked to poor prognosis in MM patients.
a Assessment of platelet counts in newly diagnosed MM (NDMM) patients (n = 1,468). Three groups were defined as follows: patients with normal-platelet counts (120–300 × 109/L, n = 906), high-platelet counts (> 300 × 109/L, n = 116), and low-platelet counts (≤120 × 109/L, n = 446). b Platelet counts in PB (peripheral blood) of NDMM patients with different ISS stage (mean ± SD, nMM (ISS I) = 229, nMM (ISS II) = 372; nMM (ISS III) = 532). c, d Kaplan-Meier analyses of overall survival (OS) and progression free survival (PFS) in NDMM patients with normal-platelet counts (120–300 × 109/L, nMM (ISS I- II) = 264, nMM (ISS III) = 180), low-platelet counts (50–120 × 109/L, nMM (ISS I- II) = 87, nMM (ISS III) = 104) and low-platelet counts (<50 × 109/L, nMM (ISS I- II) = 14, nMM (ISS III) = 20). e Representative images of CD41+ MKs in BM biopsies of MM patients with normal platelet counts or low platelet counts by using immunohistochemical staining (scale bar, 100μm). f Statistical analysis of the number of CD41+ MKs per 100 mm2 in the BM biopsies of MM patients with normal platelet counts (n = 25) or low platelet counts (n = 19). Results represent means ± SD. g Assessment of the correlation between platelet counts and numbers of CD41+ MKs in BM (n = 44). h Schematic diagram of the experimental design to detect platelet counts, tumor burden, and the proportion of LSKs, CMPs, and MEP in 5TMG1 mice. i Dynamic changes of IgG2b levels during MM progression in 5TGM1 mice as detected with ELISA. Peripheral platelet counts of 5TGM1 mice were measured with haematology analyser (n = 6). j Assessment of the correlation between IgG2b levels and platelet counts in 5TGM1 mice (n = 37). k Representative images of immunofluorescence analysis for MKs staining using CD41-FITC antibody (Green) and Hoechst 33342 (Blue) in the BM of control mice (Ctrl mice) and 5TGM1 mice. Top, normal numbers of MKs in ctrl mice; bottom, decreased numbers of MKs in 5TGM1 mice. The scale bars are 1 mm and 100 µm for the left image and right image, respectively. Results represent means ± SD. An unpaired two-sided Student’s t-test was used to assess the difference in b, f; Two-sided log-rank (Mantel-Cox) test were used in c, d; Two-sided Pearson test were used in g, j. Source data are provided as a Source Data file.
Fig. 2
Fig. 2. Serine is upregulated in BM and linked to thrombocytopenia in MM.
a Schematic diagram showing megakaryocytic differentiation of CD34+ cells treated with BM plasma derived from MM patients with or without thrombocytopenia. b Flow cytometry analysis of the percentage of CD41a+CD42b+ cells at day 12 of megakaryocytic differentiation with BM plasma treatment (mean ± SD, nMMnormal = 20, nMMlow = 16). c Phase-contrast images of proplatelet formation at day 12 from CD34+ cells with BM plasma treatment (scale bar, 20μm). d Generation of CD41a+CD42b+ PLPs at day 12 of CD34+ cells with BM plasma treatment (mean ± SD). e Volcano plot of differential metabolites in BM plasma between MM patients with normal-platelet counts (n = 23) and patients with low-platelet counts (n = 7) by using with un-targeted metabolomics. Significantly upregulated metabolites are represented as ‘red’ dots, and downregulated metabolites are represented as ‘blue’ dots. f Heatmaps of the 16 differential metabolites in BM plasma between MM patients with normal platelet counts and with low platelet counts. g Heatmaps of the 6 differential amino acids in BM plasma between MM patients with normal platelet counts (n = 83) and patients with low platelet counts (n = 31) revealed with targeted metabolomics. h Venn diagram of un-targeted metabolomics and targeted metabolomics. i Heatmap of serine, glycine, and aspartic acid in serum between control (ctrl) mice and 5TGM1 mice (n = 6). j Representative plots for flow cytometry detection of the proportion of CD41a+CD42b+ cells differentiated from CD34+ cells treated with vehicle, serine, and glycine. k Statistical analysis of the fold change of CD41a+CD42b+ cells in differentiated cells treated with vehicle, serine and glycine (mean ± SD, n = 3 independent experiments). l Statistical analysis of the fold change of CD41a+CD42b+ PLPs in differentiated cells treated with vehicle, serine, and glycine (mean ± SD, n = 3 independent experiments). Results represent means ± SD. Unpaired two-sided t-test were used in b, d. One-way ANOVA followed by Dunnett’s multiple comparison test was used in k, l. Source data are provided as a Source Data file.
Fig. 3
Fig. 3. Serine inhibits megakaryopoiesis and thrombopoiesis both in vitro and in vivo.
a The production of CD41a+CD42b+ MKs of CD34+ cells treated with indicated concentration of serine (mean ± SD, n = 3 independent experiments). b, c Phase-contrast images of proplatelet formation and the production of CD41a+CD42b+ PLPs at day 15 from CD34+ cells treated with indicated concentrations of serine (mean ± SD, n = 3 independent experiments). The scale bar is 20 µm. d Schematic diagram of the experimental design to detect tumor burden, platelet counts and the survival in 5TMG1 mice fed with the control diet (ctrl diet) or serine-free diet (n = 6 per group). e, f Tumor-associated luminescence intensity and quantification of luminescence intensity in 5TGM1 mice fed with the ctrl diet or serine-free diet at 2, 4, and 6 weeks (Week 2 and 4: n = 6 in each group, Week 6: n = 5 in ctrl diet group, n = 6 in serine-free diet group). Results represent means ± SEM. An unpaired one-sided Student’s t-test was used in f. g The concentrations of IgG2b in mouse serum as detected with ELISA (Week 2 and 4: n = 6 in each group, Week 6: n = 5 in ctrl diet group, n = 6 in serine-free diet group). h The number of platelet counts in PB in 5TGM1 mice at week 6 (n = 5 in ctrl diet group, n = 6 in serine-free diet group, mean ± SD). i The survival curves of 5TGM1 mice fed with the ctrl diet or serine-free diet. A two-sided log-rank (Mantel-Cox) test was used to assess the difference. j The apoptosis rate of platelets derived from HD incubated with serum from HD or MM patients (nHD = 10, nMM = 12, mean ± SEM). k The level of serine in serum from HD or MM patients as revealed with targeted metabolomics (nHD = 32, nMM = 120, mean ± SD). l Western blot analysis of Bcl-xL, C-caspase3, p53, BAD and β-actin expression in platelets derived from HD or control mice treated with indicated concentration of serine. Experiment was repeated independently for 3 times. An unpaired two-sided Student’s t-test was used in g, h, j, k; One-way ANOVA followed by Dunnett’s multiple comparison test in a, c. Source data are provided as a Source Data file.
Fig. 4
Fig. 4. Serine uptake is mediated by SLC38A1.
a The expression profile of serine metabolism-related genes in MKs cultured with vehicle or excessive serine. b Schematics of serine metabolism. c Assessment of mRNA expression of serine transporters in differentiated cells treated with vehicle or excessive serine at day 12 (mean ± SD, n = 3 independent experiments). Significance was analyzed with an One-way ANOVA followed by Dunnett’s multiple comparison test. d Protein levels of SLC1A4, SLC1A5 and SLC38A1 were detected with immunoblotting in differentiated cells treated with vehicle or serine at day 12. n = 3 independent experiments. e The mRNA levels of SLC38A1 in CD34+ cells containing control and SLC38A1 shRNAs as detected with qPCR analysis (mean ± SD, n = 3 independent experiments). f Protein levels of SLC38A1 were detected with immunoblotting in CD34+ cells infected with lentivirus-containing scramble or SLC38A1-shRNA. n = 3 independent experiments. g The concentration of extracellular serine in CD34+ cells containing control and SLC38A1 shRNAs (mean ± SD, n = 3 independent experiments). h Flow cytometry analysis of the percentage of CD41a+CD42b+ MKs from CD34+ cells with SLC38A1 knockdown exposed to serine (mean ± SD, n = 3 independent experiments). i Representative images of proplatelet formation from MKs from CD34+ cells with SLC38A1 knockdown exposed to vehicle or serine. The scale bar is 20 µm. j Generation of CD41a+CD42b+ PLPs at day 12 from CD34+ cells with SLC38A1 knockdown exposed to vehicle or serine (mean ± SD, n = 3 independent experiments). Results represent means ± SD. An unpaired two-sided Student’s t-test was used in e, g, h, j. Source data are provided as a Source Data file.
Fig. 5
Fig. 5. Serine downregulates Supervillin via S-adenosyl-methionine-mediated tri-methylation of H3K9.
a The metabolic flux of 13C3-serine in CD34+ cells undergoing MK differentiation, m+0 denotes metabolites without labeled carbon atom, while m+1, m+2, m+3, and m+4 denotes metabolites with 1, 2, 3, and 4 labeled carbon atom. b Schematics of serine metabolism in MKs. c Generation of CD41a+CD42b+ MKs of CD34+ cells with indicated concentrations of methionine (mean ± SD, n = 3 independent experiments). d Generation of CD41a+CD42b+ PLPs from CD34+ cells with indicated concentrations of methionine (mean ± SD, n = 3 independent experiments). e Generation of CD41a+CD42b+ MKs from CD34+ cells infected with scramble or SHMT2-shRNA virus with or without serine treatment (mean ± SD, n = 3 independent experiments). f Generation of CD41a+CD42b+ PLPs from CD34+ cells infected with scramble or SHMT2-shRNA virus with or without serine treatment (mean ± SD, n = 3 independent experiments). g Generation of CD41a+CD42b+ MKs from CD34+ cells treated with DMSO or the SAHH inhibitor 3DZA with or without serine treatment (mean ± SD, n = 3 independent experiments). h Generation of CD41a+CD42b+ PLPs from CD34+ cells treated with DMSO or the SAHH inhibitor 3DZA with or without serine treatment (mean ± SD, n = 3 independent experiments). i Western blot analysis of H3K9me3, H3K36me3, SETDB2 in cells at day 12 treated with vehicle or serine. Experiment was repeated independently for 3 times. j Venn diagram of downregulated genes and peaks in both ATAC-seq and RNA-seq analyses. k Peaks of the promoter of SVIL, FRYL, and SHANK3 in differentiated cells cultured with vehicle or serine at day 12 as revealed with ATAC-seq. Different regions of primers used for ChIP-qPCR in the promoters are in different colors (purple, gray, and red). l The binding of H3K9me3 to the promoters of SVIL, SHANK3, and FRYL in 293T cells cultured with vehicle or serine by using ChIP-qPCR (means ± SD, n = 3 independent experiments). m Generation of CD41a+CD42b+ PLPs from CD34+ cells with overexpression of SVIL exposed to serine (mean ± SD, n = 3 independent experiments). An unpaired two-sided Student’s t-test was used in c, d, e, f, g, h, l, m. Source data are provided as a Source Data file.
Fig. 6
Fig. 6. Serine accumulated in the BM microenvironment is released from myeloma cells.
a, b Representative plots for the isolation of and relative mRNA levels of Phgdh and Psph were detected in LK, B cell, plasma cells, T cell, erythrocytes, and BMSCs from the BMME of 5TGM1 mice (mean ± SD, n = 3 independent experiments). c Representative images of immunofluorescence stained with Phgdh in different cells. The scale bar is 10 µm. d Flow cytometry analysis of the percentage of CD41a+CD42b+ cells at day 12 of megakaryocytic differentiation treated with or without the CM from MM cells (mean ± SD, n = 3 independent experiments). e, f Phase-contrast images of proplatelet formation and generation of CD41a+CD42b+ PLPs at day 12 from CD34+ cells treated with or without the CM from MM cells (mean ± SD, n = 3 independent experiments). The scale bar is 20 µm. g 13C-labeled serine in the CM from ARP1 cells treated with 13C2 glycine (mean ± SD, n = 3 independent experiments). h Flow cytometry analysis of the percentage of CD41a+CD42b+ MKs from CD34+ cells treated with CM of ARP1-EV and ARP1-PHGDH cells (mean ± SD, n = 3 independent experiments). i, j Representative images of proplatelet formation and generation of CD41a+CD42b+ PLPs at day 12 from CD34+ cells treated with CM derived from ARP1-EV and ARP1-PHGDH cells (mean ± SD, n = 3 independent experiments). The scale bar is 20 µm. k Schematics of the serine metabolic flux experiments treated with CM from MM cells. l Levels of 13C-methionine in differentiated cells after incubated with the CM of ARP1 cells and RPMI-8226 cells with 13C3-serine for 4 h. m Western blot analysis of H3K9me3 in differentiated cells at day 12 treated with control medium or CM from ARP1 cells and RPMI-8226 cells. Experiment was repeated independently for 3 times. An unpaired two-sided Student’s t-test was used in bh, j; One-way ANOVA followed by Dunnett’s multiple comparison test in d, f. Source data are provided as a Source Data file.
Fig. 7
Fig. 7. TPO administration lessens thrombocytopenia and suppresses MM progression.
a A schematic diagram of 5TGM1 mice fed with the control diet (ctrl diet), ctrl diet plus TPO intervention (1ug/mouse/day), high-serine diet or high-serine diet plus TPO intervention (1ug/mouse/day) (n = 6 mice per group). b Serum serine concentrations in 5TGM1 mice (n = 5 in ctrl diet group, n = 4 in high-serine diet group, n = 6 in ctrl diet plus TPO intervention, n = 6 in high-serine diet plus TPO intervention) at week 6. Results represent means ± SD. c Platelet counts in PB of 5TGM1 mice (n = 5 in ctrl diet group, n = 4 in high-serine diet group, n = 6 in ctrl diet plus TPO intervention, n = 6 in high-serine diet plus TPO intervention) at week 6. Results represent means ± SD. d The percentage of MKs in BM cells of 5TGM1 mice (n = 5 in ctrl diet group, n = 4 in high-serine diet group, n = 6 in ctrl diet plus TPO intervention, n = 6 in high-serine diet plus TPO intervention) as revealed with flow cytometry analysis. Results represent means ± SD. e, f Live imaging and quantification of the tumor-associated luminescence intensity of the four groups of 5TGM1 mice (n = 5 in ctrl diet group, n = 4 in high-serine diet group, n=6 in ctrl diet plus TPO intervention, n = 6 in high-serine diet plus TPO intervention) at week 6. Results represent means ± SD; Significance was analyzed with an unpaired one-sided Student’s t-test. g Serum IgG2b concentrations in 5TGM1 mice (n = 5 in ctrl diet group, n = 4 in high-serine diet group, n = 6 in ctrl diet plus TPO intervention, n = 6 in high-serine diet plus TPO intervention) at week 6. Results represent means ± SD. Unpaired two-sided Student’s t-test was used in b, c, d, g. h The working model of the study. Source data are provided as a Source Data file.

References

    1. Liu J, et al. Incidence and mortality of multiple myeloma in China, 2006-2016: an analysis of the Global Burden of Disease Study 2016. J. Hematol. Oncol. 2019;12:136. doi: 10.1186/s13045-019-0807-5. - DOI - PMC - PubMed
    1. Cowan AJ, et al. Diagnosis and management of multiple myeloma: a review. JAMA. 2022;327:464–477. doi: 10.1001/jama.2022.0003. - DOI - PubMed
    1. Kyle RA, et al. Review of 1027 patients with newly diagnosed multiple myeloma. Mayo Clin. Proc. 2003;78:21–33. doi: 10.4065/78.1.21. - DOI - PubMed
    1. Al Saleh AS, et al. Hematopoietic score predicts outcomes in newly diagnosed multiple myeloma patients. Am. J. Hematol. 2020;95:4–9. doi: 10.1002/ajh.25657. - DOI - PMC - PubMed
    1. Kaneko M, et al. Simple prognostic model for patients with multiple myeloma: a single-center study in Japan. Ann. Hematol. 2002;81:33–36. doi: 10.1007/s00277-001-0388-5. - DOI - PubMed

Publication types