. 2023 Apr 13;14(1):2102.
doi: 10.1038/s41467-023-37179-4.

Histopathology images predict multi-omics aberrations and prognoses in colorectal cancer patients

Affiliations

Histopathology images predict multi-omics aberrations and prognoses in colorectal cancer patients

Pei-Chen Tsai et al. Nat Commun. .

Abstract

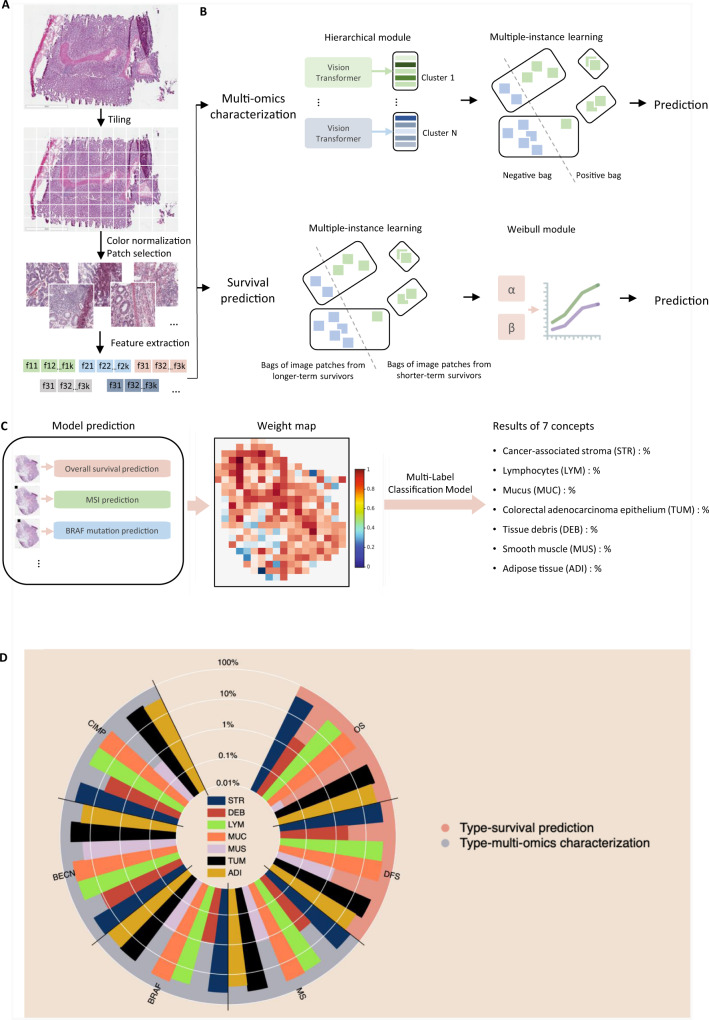
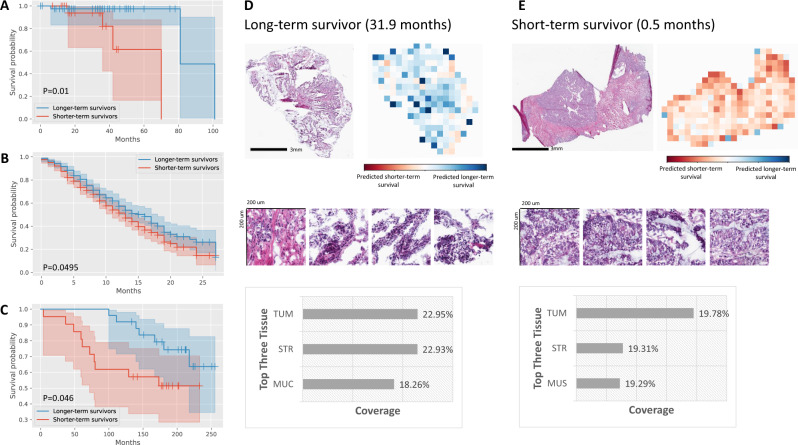
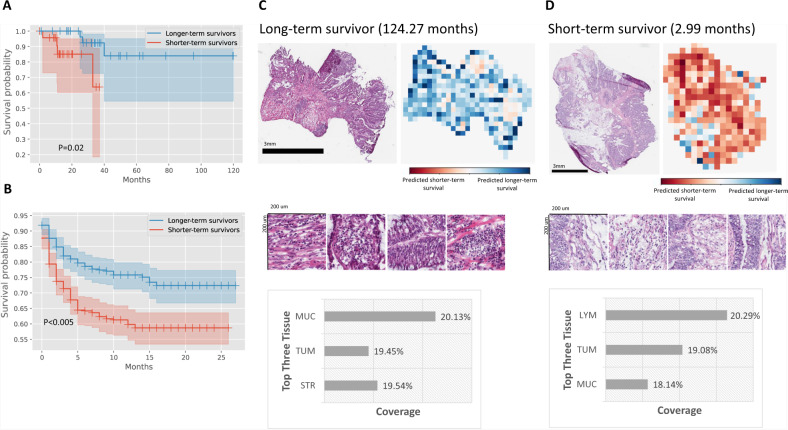
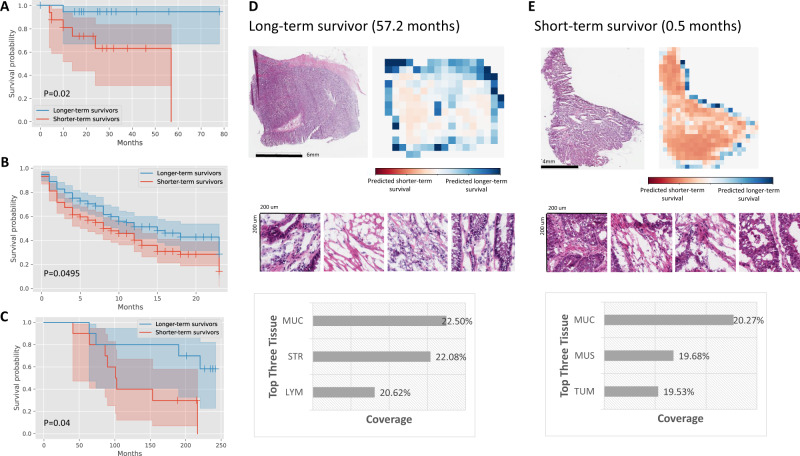
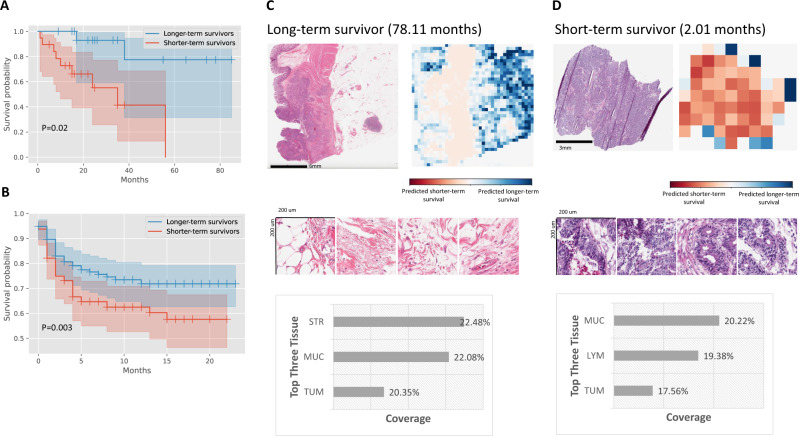
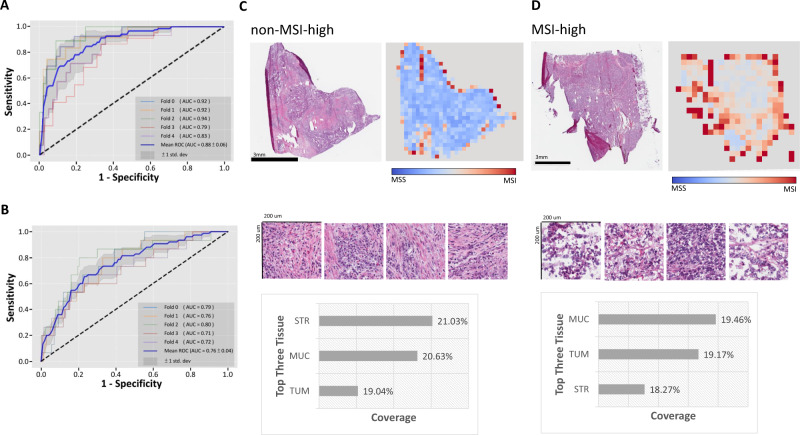
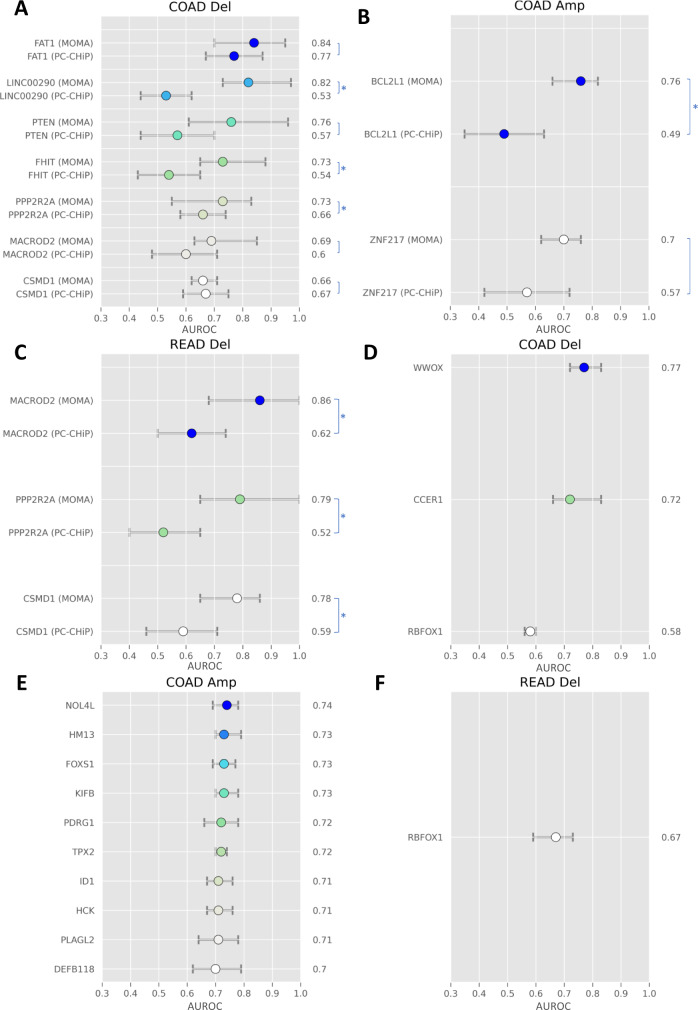
Histopathologic assessment is indispensable for diagnosing colorectal cancer (CRC). However, manual evaluation of the diseased tissues under the microscope cannot reliably inform patient prognosis or genomic variations crucial for treatment selections. To address these challenges, we develop the Multi-omics Multi-cohort Assessment (MOMA) platform, an explainable machine learning approach, to systematically identify and interpret the relationship between patients' histologic patterns, multi-omics, and clinical profiles in three large patient cohorts (n = 1888). MOMA successfully predicts the overall survival, disease-free survival (log-rank test P-value<0.05), and copy number alterations of CRC patients. In addition, our approaches identify interpretable pathology patterns predictive of gene expression profiles, microsatellite instability status, and clinically actionable genetic alterations. We show that MOMA models are generalizable to multiple patient populations with different demographic compositions and pathology images collected from distinctive digitization methods. Our machine learning approaches provide clinically actionable predictions that could inform treatments for colorectal cancer patients.


Conflict of interest statement

K-H.Y. is an inventor of US 16/179,101, entitled “Quantitative Pathology Analysis and Diagnosis using Neural Networks.” This patent is assigned to Harvard University. K-H.Y. was a consultant of Curatio. DL. K.W. is currently a stakeholder and employee of Vertex Pharmaceuticals. This study was not funded by this entity. All other authors have nothing to disclose.

Figures

Fig. 1
Fig. 1. An overview of the Multi-omics Multi-cohort Assessment (MOMA) machine learning framework.
A Machine learning workflow for connecting whole-slide digital histopathology images with multi-omics biomarkers and survival outcomes. The MOMA platform processes the image patches from whole-slide pathology images, normalizes them, and leverages vision transformers to extract image features. B We develop multi-omics characterization and survival prediction frameworks using the extracted image features. C Model visualization and interpretation. To enhance the interpretability of our machine learning approaches, we compute the importance of each image region to the prediction target by quantifying the performance decay due to occlusion of the region, and we develop a multi-task classification model to quantify the concept (e.g., lymphocyte, stroma, tumor, adipose tissue, mucin, etc.) score using patches whose importance weight is greater than 0.7. This method connects prior histopathology knowledge with quantitative importance metrics independently learned by the models. D A summary of the pathology concepts associated with survival and multi-omics predictions. The concept scores are plotted on the log scale. OS: overall survival prediction in early-stage CRC; DFS: disease-free survival prediction in early-stage CRC; MSI: microsatellite instability prediction; BRAF: BRAF mutation status prediction; BECN: BECN-1 overexpression prediction; CIMP: CpG island methylator phenotype prediction. The major concepts visualized here include lymphocytes (LYM), cancer-associated stroma (STR), tissue debris (DEB), mucus (MUC), smooth muscle (MUS), colorectal adenocarcinoma epithelium (TUM), and adipose tissue (ADI). The score for each concept indicates the relative importance of each type of microenvironment in predicting patient prognoses or the selected multi-omics variations with clinical implications.
Fig. 2
Fig. 2. MOMA predicts overall survival outcomes of stage I and II colorectal cancer patients using digital histopathology images, with validation in multiple independent cohorts.
A MOMA successfully distinguishes the shorter-term survivors from longer-term survivors using histopathology images (two-sided log-rank test P-value= 0.01). Results from the TCGA held-out test set are shown. B The machine learning model derived from MOMA is successfully validated in an independent external validation set from the Nurses’ Health Study and Health Professionals Follow-up Study cohorts (two-sided log-rank test P-value<0.05). C We further validate our overall survival prediction model in PLCO, a nationwide multi-center study cohort (two-sided log-rank test P-value <0.05). D Model prediction of a patient with longer-term overall survival. The model focuses on regions of cancerous tissue and cancer-associated stroma when making the prediction in this example. E Interpretation of the overall survival prediction model. The prediction of a patient with shorter-term survival is shown in this figure panel. Cancerous tissue, cancer-associated stroma, and smooth muscle receive high attention weights in the overall survival prediction task. TUM: colorectal adenocarcinoma epithelium; STR: cancer-associated stroma; MUC: mucus; MUS: smooth muscle.
Fig. 3
Fig. 3. Quantitative histopathology imaging predicts stage I and II colorectal cancer patients’ progression-free survival outcomes.
A MOMA-trained models differentiate patients with early relapse or death from those with longer progression-free survival using histopathology images (two-sided log-rank test P-value=0.02). B We successfully validate our models using the independent external validation set from the Nurses’ Health Study and Health Professionals Follow-up Study cohorts (two-sided log-rank test P-value<0.005). C Interpretation of the progression-free survival prediction model. The prediction of a patient with longer-term survival is shown in this figure panel. Mucosal regions and regions occupied by cancer cells both receive high attention weights in the overall survival prediction task. D Model prediction of a patient with shorter-term overall survival. In samples collected from shorter-term survivors, our model also focuses on regions of lymphocytes when making predictions. MUC: mucus; TUM: colorectal adenocarcinoma epithelium; STR: cancer-associated stroma; LYM: lymphocytes.
Fig. 4
Fig. 4. MOMA predicts overall survival outcomes of stage III colorectal cancer patients using digital histopathology images, with validation in multiple independent cohorts.
A MOMA successfully distinguishes the shorter-term survivors from longer-term survivors using histopathology images (two-sided log-rank test P-value=0.02). Results from the TCGA held-out test set are shown. B The machine learning model derived from MOMA is successfully validated in an independent external validation set from the Nurses’ Health Study and Health Professionals Follow-up Study cohorts (two-sided log-rank test P-value<0.05). C We further validate our overall survival prediction model in PLCO, a nationwide multi-center study cohort (two-sided log-rank test P-value = 0.04). D Model prediction of a patient with longer-term overall survival. The model focuses on regions of cancerous tissue and cancer-associated stroma when making the prediction in this example. E Interpretation of the overall survival prediction model. The prediction of a patient with shorter-term survival is shown in this figure panel. Cancerous tissue, cancer-associated stroma, and smooth muscle receive high attention weights in the overall survival prediction task. TUM: colorectal adenocarcinoma epithelium; STR: cancer-associated stroma; MUC: mucus; MUS: smooth muscle; LYM: lymphocytes.
Fig. 5
Fig. 5. MOMA predicts progression-free survival outcomes of stage III colorectal cancer patients using digital histopathology images, with validation in independent patient cohorts.
A MOMA successfully distinguishes the shorter-term survivors from longer-term survivors using histopathology images (two-sided log-rank test P-value=0.02). Results from the TCGA held-out test set are shown. B The machine learning model derived from MOMA is successfully validated in an independent external validation set from the Nurses’ Health Study and Health Professionals Follow-up Study cohorts (two-sided log-rank test P-value=0.003). C Model prediction of a patient with longer-term progression-free survival. The model focuses on regions of cancerous tissue and cancer-associated stroma when making the prediction in this example. D Interpretation of the progression-free survival prediction model. The prediction of a patient with shorter-term survival is shown in this figure panel. Cancerous tissue, cancer-associated stroma, lymphocytes, and smooth muscle receive high attention weights in the overall survival prediction task. STR: cancer-associated stroma; MUC: mucus; TUM: colorectal adenocarcinoma epithelium; LYM: lymphocytes.
Fig. 6
Fig. 6. MOMA predicts MSI status in colorectal cancer patients.
A Our MSI prediction model achieves an area under the receiver operating characteristic curve (AUC) of 0.88 in the TCGA held-out test set. B Our MSI prediction model is further validated in the Nurses’ Health Study and Health Professionals Follow-up Study cohorts (AUC = 0.76). C Attention visualization of a pathology image with non-MSI-high cancer. Informative regions of cancer-associated stroma, cancer cells, and mucus in this prediction task are automatically highlighted by our trained machine learning model. D Attention visualization of a pathology image with MSI-high cancer. Regions with adenocarcinoma cells and their adjacent stroma receive high attention. STR cancer-associated stroma, MUC mucus, TUM colorectal adenocarcinoma epithelium.
Fig. 7
Fig. 7. MOMA provides improved copy number alteration prediction compared with the current state-of-the-art methods and predicts additional copy number alterations not achieved in previous studies.
We systematically predict common copy number alterations of colorectal cancer tissues and compare the prediction performance with that of PC-CHiP. The mean and range of AUROC are shown. A Prediction of common genetic deletions in patients with colon adenocarcinoma. B Prediction of common genetic amplification in patients with colon adenocarcinoma. C Prediction of common genetic deletions in patients with rectal adenocarcinoma. D Prediction of additional genetic deletions in colon adenocarcinoma. E Prediction of additional genetic amplifications in colon adenocarcinoma. F Prediction of additional genetic deletions in rectal adenocarcinoma. The error bars show the 95% confidence interval of the mean. In this analysis, 463 patients are in the COAD group, and 164 patients are in the READ group. Asterisks denote two-sided Wilcoxon signed-rank test P-value<0.05 when comparing the two groups.

Similar articles

Cited by

References

    1. Siegel RL, Miller KD, Fuchs HE, Jemal A. Cancer Statistics, 2021. CA Cancer J. Clin. 2021;71:7–33. doi: 10.3322/caac.21654. - DOI - PubMed
    1. Benson AB, et al. Colon Cancer, Version 2.2021, NCCN Clinical Practice Guidelines in Oncology. J. Natl Compr. Canc. Netw. 2021;19:329–359. doi: 10.6004/jnccn.2021.0012. - DOI - PubMed
    1. Otálora S, Atzori M, Andrearczyk V, Khan A, Müller H. Staining Invariant Features for Improving Generalization of Deep Convolutional Neural Networks in Computational Pathology. Front Bioeng. Biotechnol. 2019;7:198. doi: 10.3389/fbioe.2019.00198. - DOI - PMC - PubMed
    1. Litjens G, et al. Deep learning as a tool for increased accuracy and efficiency of histopathological diagnosis. Sci. Rep. 2016;6:26286. doi: 10.1038/srep26286. - DOI - PMC - PubMed
    1. Coudray N, et al. Classification and mutation prediction from non-small cell lung cancer histopathology images using deep learning. Nat. Med. 2018;24:1559–1567. doi: 10.1038/s41591-018-0177-5. - DOI - PMC - PubMed

Publication types