. 2023 Apr 13;14(1):2109.
doi: 10.1038/s41467-023-37727-y.

Targeting CXCL16 and STAT1 augments immune checkpoint blockade therapy in triple-negative breast cancer

Affiliations

Targeting CXCL16 and STAT1 augments immune checkpoint blockade therapy in triple-negative breast cancer

Bhavana Palakurthi et al. Nat Commun. .

Abstract

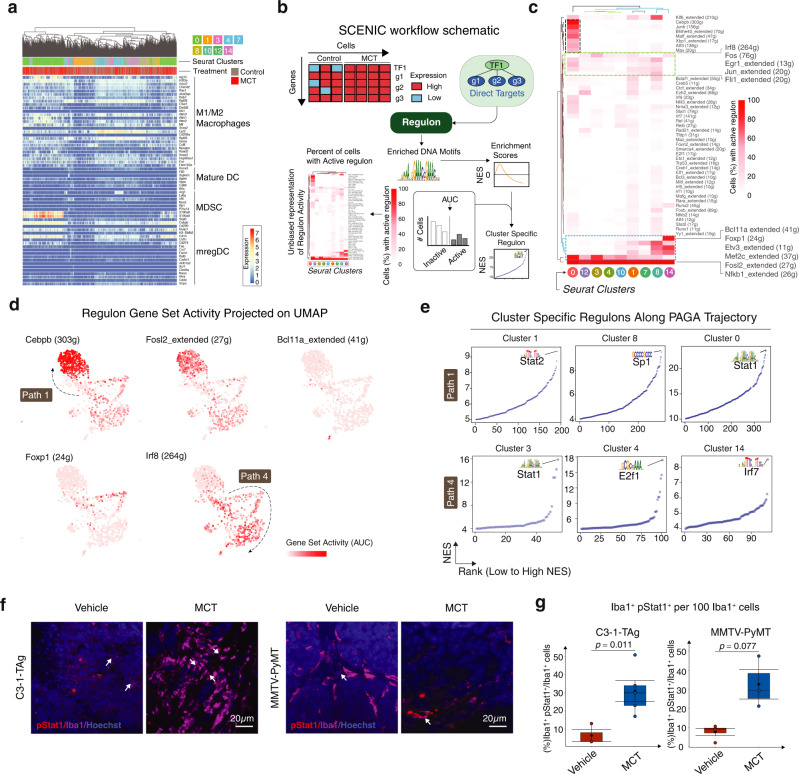
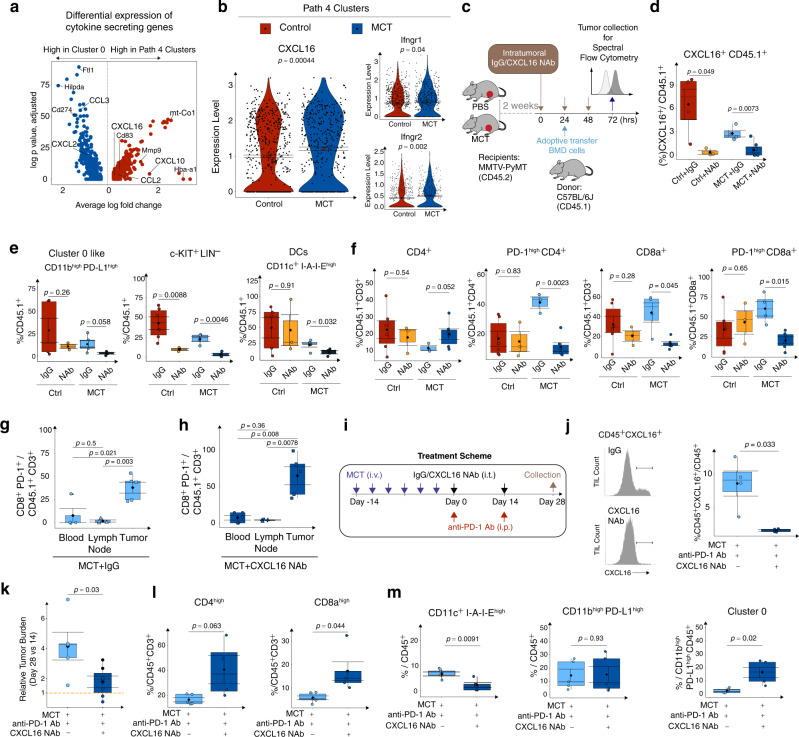
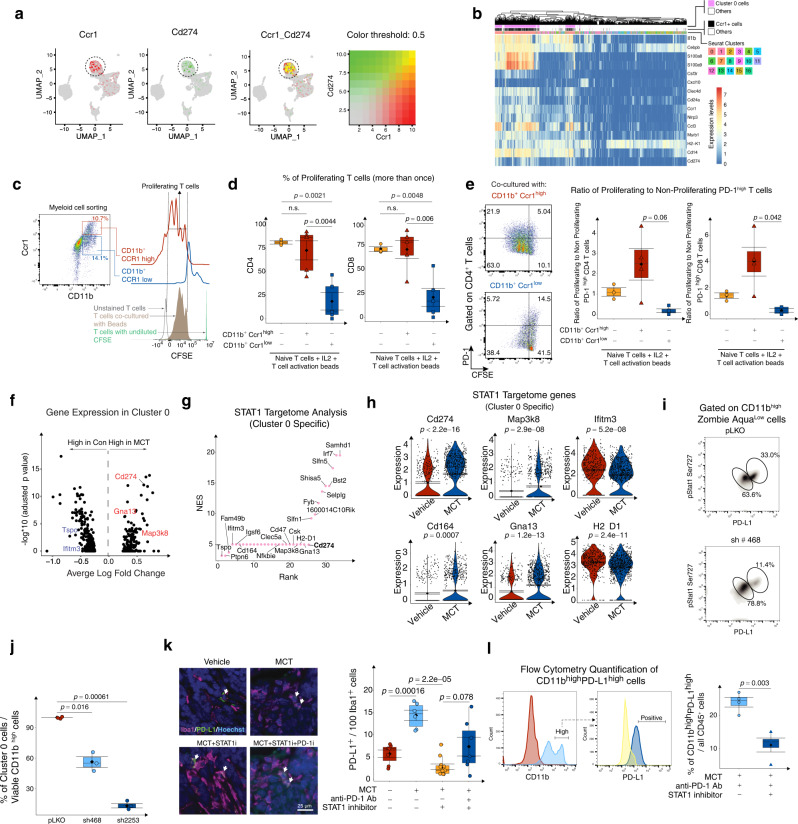
Chemotherapy prior to immune checkpoint blockade (ICB) treatment appears to improve ICB efficacy but resistance to ICB remains a clinical challenge and is attributed to highly plastic myeloid cells associating with the tumor immune microenvironment (TIME). Here we show by CITE-seq single-cell transcriptomic and trajectory analyses that neoadjuvant low-dose metronomic chemotherapy (MCT) leads to a characteristic co-evolution of divergent myeloid cell subsets in female triple-negative breast cancer (TNBC). Specifically, we identify that the proportion of CXCL16 + myeloid cells increase and a high STAT1 regulon activity distinguishes Programmed Death Ligand 1 (PD-L1) expressing immature myeloid cells. Chemical inhibition of STAT1 signaling in MCT-primed breast cancer sensitizes TNBC to ICB treatment, which underscores the STAT1's role in modulating TIME. In summary, we leverage single-cell analyses to dissect the cellular dynamics in the tumor microenvironment (TME) following neoadjuvant chemotherapy and provide a pre-clinical rationale for modulating STAT1 in combination with anti-PD-1 for TNBC patients.


Conflict of interest statement

The authors declare no competing interests.

Figures

Fig. 1
Fig. 1. MCT increases T - myeloid cell spatial proximity.
a MTD = Maximum tolerated Dose and MCT = Metronomic Dose. Box plots show tumor burden on Day 28 relative to Day 0 of treatment in MMTV-neu (left), C3-1-TAg (center), and MMTV-PyMT (right) mice. b PFS (%) indicates the tumor volume doubling time in MMTV-neu (left), C3-1-TAg (center), and MMTV-PyMT (right) (generated using the Survimer R package, log rank p-value). a, Immunofluorescence b 3–5 mice pooled over three cohorts (n = 10–13 per group). c Representative IF images of C3-1-TAg breast tumor tissues stained with Iba1, CD3, and DAPI. Box plots quantify spatial proximity (right) (n = 9 slides per group). d Representative IF images of MMTV-PyMT breast tumor tissues stained with Iba1, CD8, and DAPI. Box plots quantify Iba1+ and CD8+ cell spatial proximity (n = 5–8 slides per group). e CyTOF data t-SNE plots compare CD11c expression in MMTV-neu and C3-1-TAg tumors upon treatment with either Vehicle, MTD, or MCT. f Biaxial plots (left) compare and box plots (right) quantify the mean percentage of CD11c+ I-A-I-E+ cells among all the CD45+ cells identified using CyTOF. In e, f CYTOF data, n = 1 million events per mouse (2 mice per group). g Gating strategy of DC-OT-ǀ T cells co-culture assay. h Box plots show percentage of CD8+ T cells in division phases 0 to 3+ in different treatment strategies upon co-culture with tumor-infiltrating DCs. i Analysis of IFN-γ in OT-ǀ T cells after co-culture. h, i 3–5 mice pooled over two cohorts (n = 3 to 10 per group). ai In box plots, error bar = Mean ± SEM, center = Means (Diamonds) and Medians (Line), bottom and top boundaries of the box = 25 and 75th percentiles of the data, minima and maxima = lowest and highest data points, and two-sided T-test p-values.
Fig. 2
Fig. 2. CITE-seq reveals distinct myeloid subsets co-exist in MCT-treated TME.
a UMAP clusters of TNBC derived single cells: RNA defined clusters (left) and Cell-ID defined clusters of TADCs and TAMs (right) (in both the UMAPs: dots = cells, Cell-ID UMAP: colored dots = TADs and TAMs, and gray dots = non TADCs and non TAMs). b Heatmap shows expression of top differentially expressed genes (DEGs) among RNA Seurat Clusters. c UMAP clusters of transcriptionally defined myeloid cells split by treatment. d Bar plot shows (%) proportion of myeloid Seurat Clusters projected in c. e UMAP (left) split by treatment projects reclustered Seurat Clusters 0 and 4. Stacked bar plot (right) shows shifts in the proportion of different clusters identified after reclustering. f Volcano plot of differentially expressed gene pathways (DEGPs) between MCT and Vehicle-treated clusters in e. g Violin plots show expression of marker genes of clusters from e. h UMAP projects RNA velocity (length of arrow tail) of myeloid Seurat Clusters. i PAGA tree predicts trajectory paths of myeloid Seurat Clusters. j PAGA trajectory tree projects marker genes of trajectory clusters 7, 4, and 3 in Paths 2-4 and Clusters 0, 1 in Path 1. In aj, n = cells pooled from 3 biological repeats per treatment group. g In violin plots, error bar = Mean ± SEM, center = Means (Diamonds) and Medians (Line), and Kruskal-Wallis p-values. Also see associated Fig. S2 and Supplementary Table 2 and Data 1–4.
Fig. 3
Fig. 3. Mapping tumor-associated myeloid cell transcriptome regulatory networks using Single-cell Regulatory Network Inference and Clustering (SCENIC).
a Heatmap shows expression of indicated cell type marker genes by myeloid Seurat clusters. b Schematic shows SCENIC workflow. c Heatmap shows percent of cells in a cluster with active regulon. d UMAP projects the regulon gene set activity. e Scatter plots show regulons specific to (top row) Clusters 1, 8, and 0 (left to right), (bottom row) Clusters 3, 4, and 14 (left to right) and their NES. Each dot is a representative of one NES (see Methods). f Representative IF images of murine C3-1-TAg tissues stained with pStat1 (Ser 727), Iba1, and CD3 and MMTV-PyMT tissues with pStat1(Ser 727) and Iba1. g Box plot shows quantification of pStat1+ Iba1+ cells infiltrating the C3-1-TAg and MMTV-PyMT tumor (Vehicle and MCT-treated, n = 3–5). In box plots, error bar = Mean ± SEM, center = Means (Diamonds) and Medians (Line), bottom and top boundaries of the box = 25 and 75th percentiles of the data, (whiskers) minima and maxima = lowest and highest data points, and two-sided T-test p-values. Also see associated Fig. S3 and Supplementary Data 5 and 6.
Fig. 4
Fig. 4. MCT-induced CXCL16 mediates intratumoral immune dynamics and ICB efficacy.
a Volcano plot shows genes expressed differentially between Cluster 0 and DC clusters. b Violin plots show the expression of CXCL16, IFN-γr1, and IFN-γr2 by the DC clusters. c Schematic shows the intratumoral IgG or CXCL16 neutralizing antibody (NAb) injection into CD45.1+ cell adoptive transfer recipients treated with either PBS or MCT. d, e Box plots show the infiltration of CXCL16+ CD45.1+ cells, CD11bhighPD-L1high, c-KIT+LIN, and CD11chighI-A-I-Ehigh cells in PBS and MCT-treated tumors upon CXCL16 NAb injection. f Box plots show changes in CD4+, PD-1high CD4+, CD8a+, and PD-1high CD8a+ T cells in PBS and MCT-treated tumors upon CXCL16 NAb injection. Box plots quantify PD-1+CD8a+ cells among the CD3+ CD45.1+ cells in MCT + IgG treated blood, lymph node, and tumor (g), in MCT + CXCL16 NAb treated blood, lymph node, and tumor (h). i Schematic shows combinatorial treatment with anti-PD-1 antibody and CXCL16 NAb in C3-1-TAg mice. j Histograms (left) show CXCL16+ CD45+ cell frequency and box plot (right) quantify CXCL16+ CD45+ cells in different treatment conditions. Box plots quantify (k) the tumor burden on Day 28 relative to Day 14, l CD4 and CD8a T cells associated with tumors, and m CD11chigh I-A-I-Ehigh, CD11bhigh PD-L1high, and Cluster 0 cells in different treatment conditions. In (b) violin plot, error bar = Mean ± SEM, center = Means (Diamonds) (A-B, n = 3 biological replicates). dm In box plots, n = 3 to 5 biological replicates, error bar = Mean ± SEM, center = Means (Diamonds) and Medians (Line), bottom and top boundaries of the box = 25 and 75th percentiles of the data, (whiskers) minima and maxima =  lowest and highest data points, and two-sided T-test p-values. Also see associated Fig. S4.
Fig. 5
Fig. 5. STAT1 regulates PD-L1 expression in Cluster 0 cells and influences T-cell activation status.
a Dual plot shows expression of Ccr1 and Cd274 in immune cells. b Heatmap shows the marker genes of Cluster 0 and compares their expression between Ccr1+ cells, Cluster 0, and other myeloid cell subsets. c Gating strategy to identify FACS sorted CD11bhigh CCR1high, CD11bhigh CCR1low myeloid cells, and CFSE levels on CD8+ T cells in co-culture. d Box plots show percentage of proliferating CD4 and CD8 T cells in co-culture with T-cell activation beads with or without myeloid cells. e Biaxial plots (left) show the gating strategy to identify the PD-1 levels on CFSE diluted and proliferating T cells. Box plots (right) show the ratio of PD-1high proliferating and non-proliferating CD4 and CD8 T cells. f Volcano plot shows DGE on Cluster 0 cells when MCT-treated. g Scatter plot shows the potential gene targets (NES > 3 and p < 0.05 DEG between MCT and Vehicle treated) in Cluster 0 specific STAT1 targetome. h Violin plots show expression of Cd274, Map3k8, Ifitm3, Cd164, Gna13, and H2-D1 genes by Cluster 0 cells (each dot is a cell and cells are from n = 3 biological repeats pooled together). i Biaxial plots show the levels of pStat1 in CD11b+ cells in different transfection conditions. j Box plot shows the percentage of pStat1+ PD-L1+ CD11b+ viable cells after shRNA STAT1 transfection relative to pLKO transfection (n = 5 biological repeats). k Representative IF images of Iba1 and PD-L1 stained tumors treated with either Vehicle, MCT, MCT + STAT1 inhibitor, or MCT + STAT1 inhibitor + PD-1 inhibitor (left). Box plot (right) shows the quantified Iba1+ PD-L1 + cells of all the Iba1+ cells (n = 3 to 5 biological repeats). l Histograms show flow cytometry gating strategy and box plots show quantification of PD-L1+ CD11b+ cells of all the CD45+ immune cells in dual-therapy (MCT + PD-1 inhibitor) and tri-therapy (MCT + PD-1 inhibitor + STAT1 inhibitor) treated TNBC tumors (n = 4 biological repeats). a, b, f, g n = 3 biological replicates. cl In box and violin plots, error bar = Mean ± SEM, center = Means (Diamonds) and Medians (Line), bottom and top boundaries of the box = 25 and 75th percentiles of the data, (whiskers) minima and maxima = lowest and highest data points, and two-sided T-test p-values. Also see associated Fig. S5.
Fig. 6
Fig. 6. Modulating STAT1 signaling enhances anti-PD-1 antibody mediated anti-tumor responses.
a Treatment scheme for synergizing anti-PD-1 with MCT (Regimen 1). b Box plots show tumor volumes on Day 28 of treatment (Regimen 1) relative to Day 0 in C3-1-TAg (left) and MMTV-neu (right) mice. n = 3–5 mice pooled over three cohorts. c Treatment scheme for synergizing CXCL16 NAb with STAT1i response in MCT and anti-PD-1 treated mice (Regimen 2). d Box plots show tumor volumes on Day 14 of treatment (Regimen 2) relative to Day 0 in C3-1-TAg mice. n = 3–5 mice pooled over three cohorts. e Treatment scheme for synergizing STAT1i and anti-PD-1 antibody response (Regimen 3). f Box plots show tumor volumes on Day 14 of treatment (Regimen 3) relative to Day 0 in C3-1-TAg mice. n = 3–5 mice pooled over three cohorts. Box plots quantify flow cytometry identified g T cells in Dual and Tri-therapy and h dendritic cells and Cluster 0 cells in Seq-therapy and Tri-therapy. i Progression-free survival probability in different treatment regimens showing time taken for the tumor volume to increase from Day 0 of treatment to Day 14. j Representative IHC images of Ki-67 stained TNBC tissues treated with either Regimen 2 or 3 (left). Box plot (right) quantifies H-Score (n = 3–5 biological replicates per group). aj In box plots, n = 3–5 biological replicates, error bar = Mean ± SEM, center = Means (Diamonds) and Medians (Line), bottom and top boundaries of the box = 25 and 75th percentiles of the data, (whiskers) minima and maxima = lowest and highest data points, and two-sided T-test p-values. Survival plot was generated using the Survimer package in R. k Schematic shows the proposed-model of MCT-mediated immune modulation in TNBC. Also see associated Fig. S6.

References

    1. Hiam-Galvez KJ, Allen BM, Spitzer MH. Systemic immunity in cancer. Nat. Rev. Cancer. 2021;21:345–359. doi: 10.1038/s41568-021-00347-z. - DOI - PMC - PubMed
    1. Engblom C, Pfirschke C, Pittet MJ. The role of myeloid cells in cancer therapies. Nat. Rev. Cancer. 2016;16:447–462. doi: 10.1038/nrc.2016.54. - DOI - PubMed
    1. Galluzzi, L., Humeau, J., Buqué, A., Zitvogel, L. & Kroemer, G. Immunostimulation with chemotherapy in the era of immune checkpoint inhibitors. Nat. Rev. Clin. Oncol. 10.1038/s41571-020-0413-z (2020). - PubMed
    1. Garris CS, et al. Successful anti-PD-1 cancer immunotherapy requires t cell-dendritic cell crosstalk involving the cytokines IFN-γ and IL-12. Immunity. 2018;49:1148–1161.e7. doi: 10.1016/j.immuni.2018.09.024. - DOI - PMC - PubMed
    1. Veglia F, Perego M, Gabrilovich D. Myeloid-derived suppressor cells coming of age. Nat. Immunol. 2018;19:108–119. doi: 10.1038/s41590-017-0022-x. - DOI - PMC - PubMed

Publication types

MeSH terms