. 2023 Apr 13;14(1):2094.
doi: 10.1038/s41467-023-37832-y.

Extracellular vesicles engineering by silicates-activated endothelial progenitor cells for myocardial infarction treatment in male mice

Affiliations

Extracellular vesicles engineering by silicates-activated endothelial progenitor cells for myocardial infarction treatment in male mice

Bin Yu et al. Nat Commun. .

Abstract

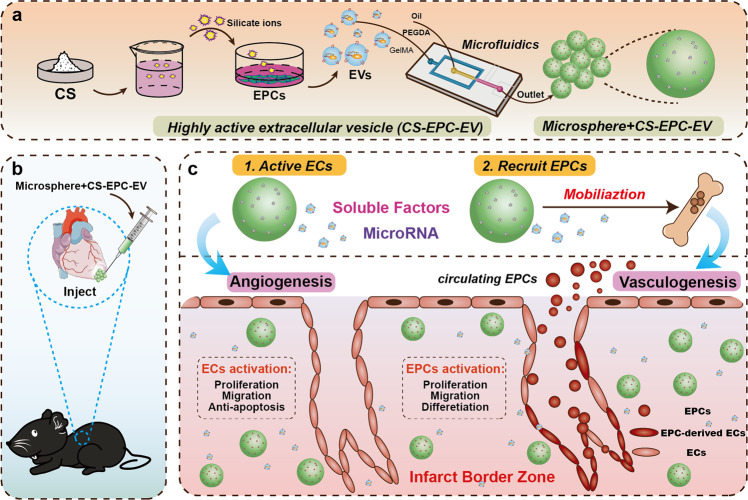
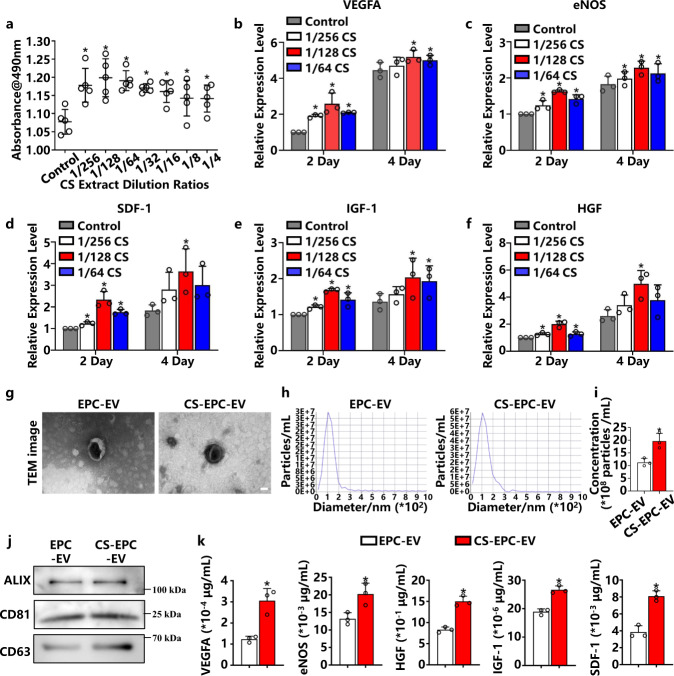
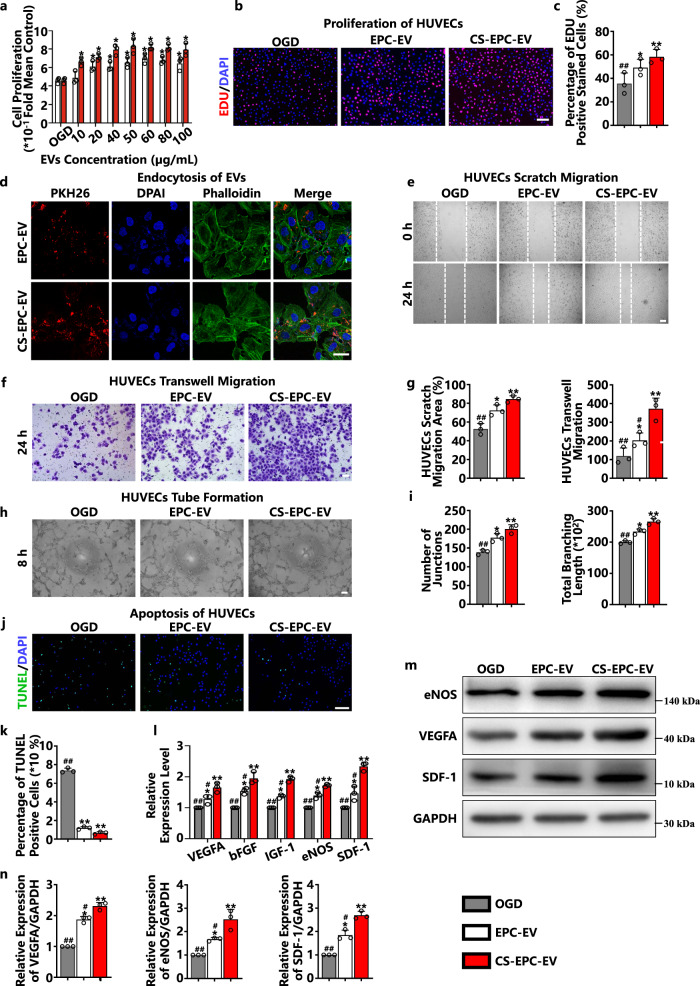
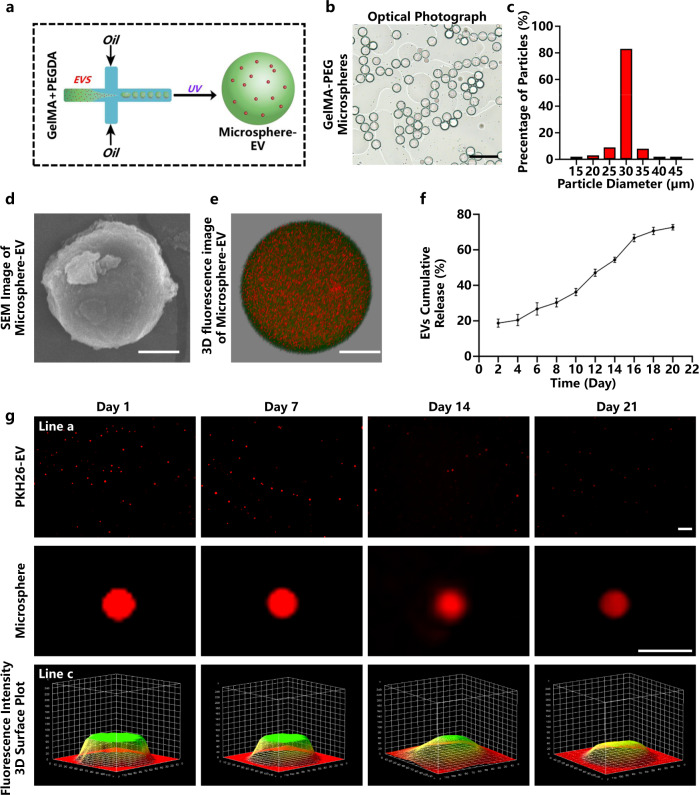
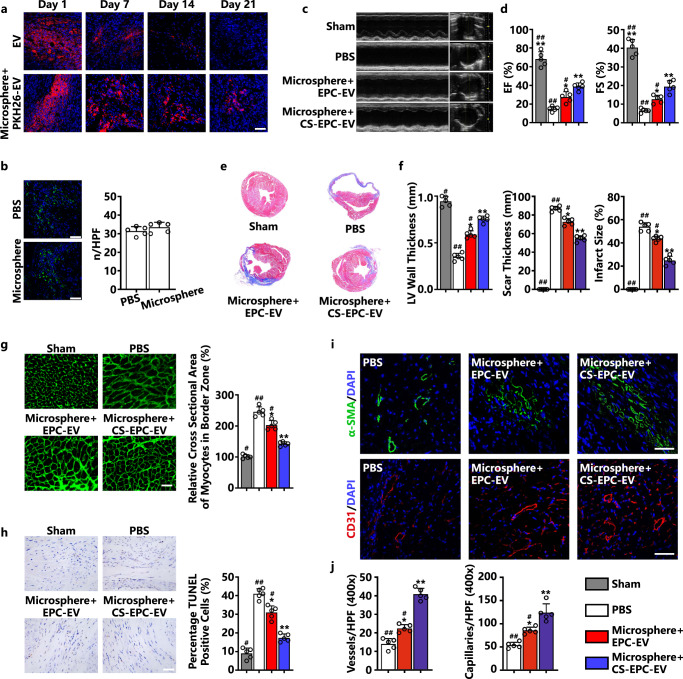
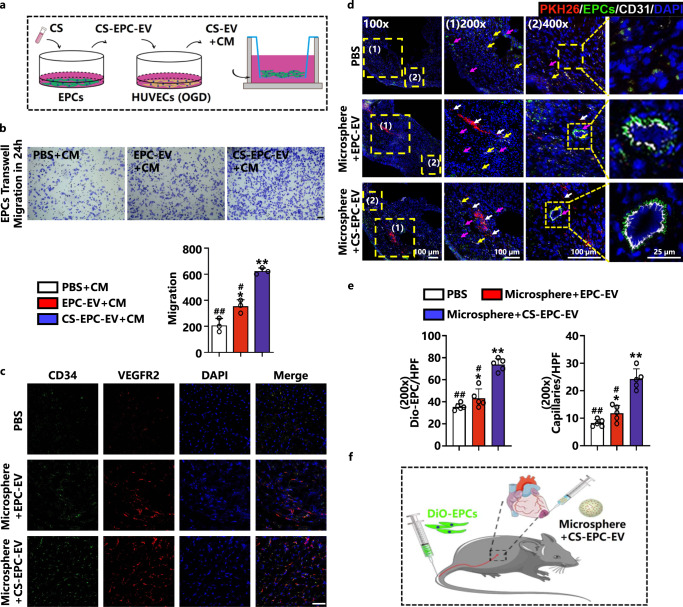
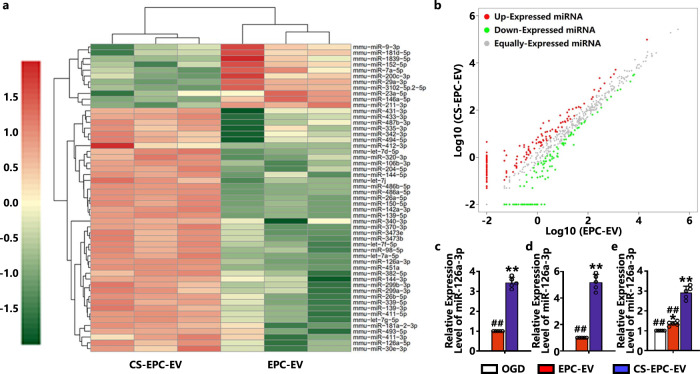
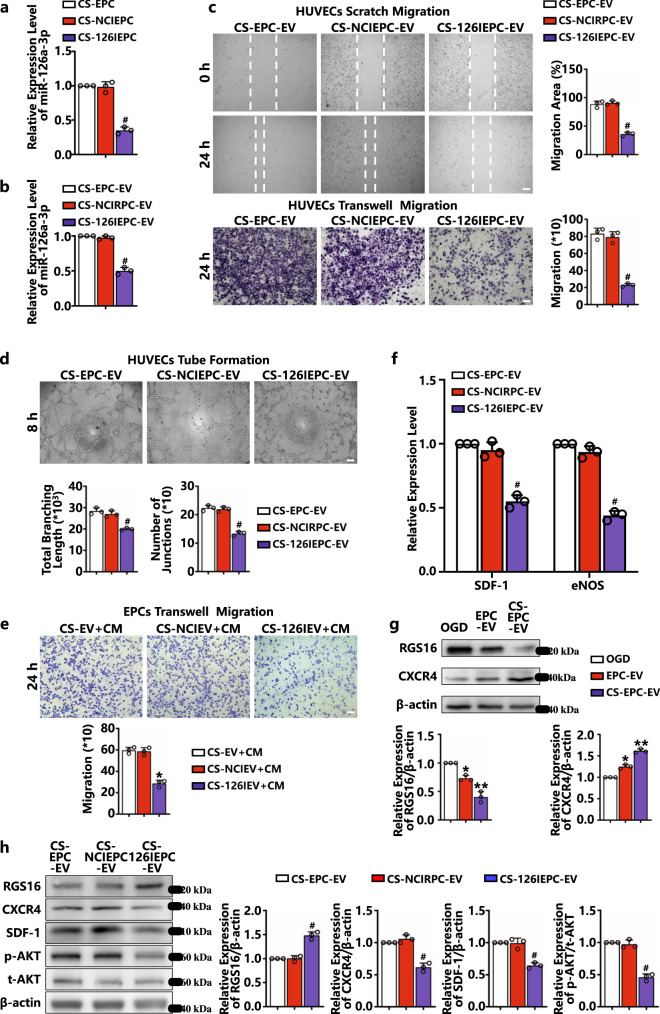
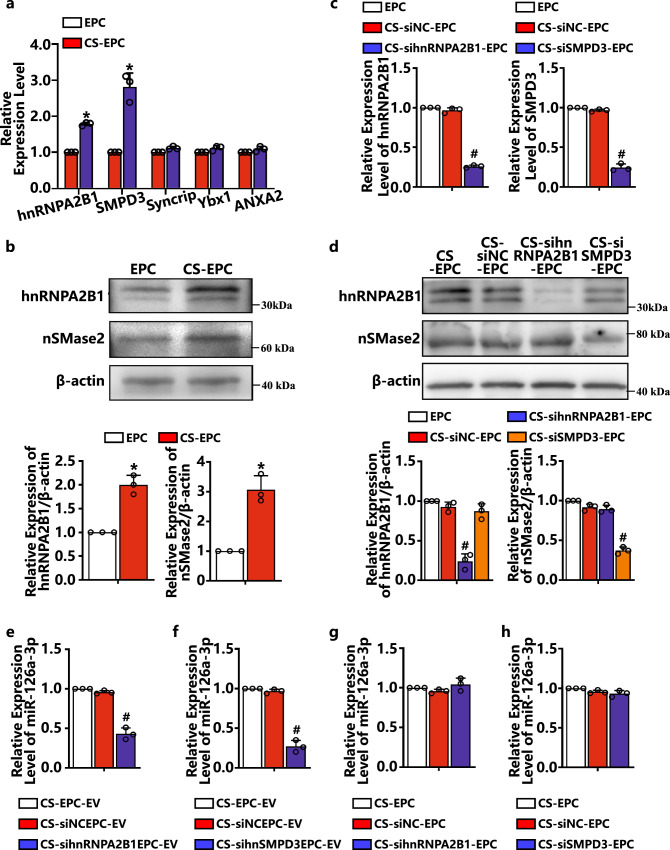
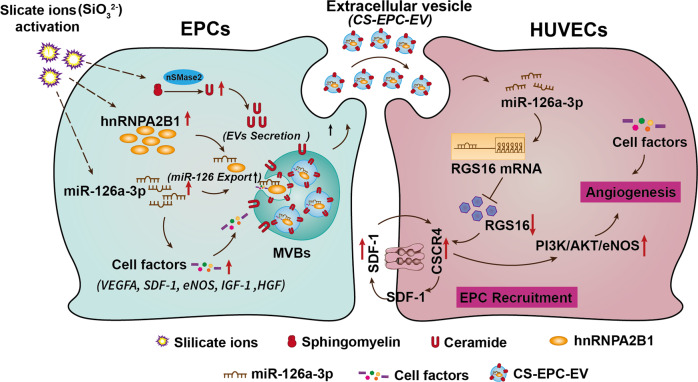
Extracellular vesicles have shown good potential in disease treatments including ischemic injury such as myocardial infarction. However, the efficient production of highly active extracellular vesicles is one of the critical limitations for their clinical applications. Here, we demonstrate a biomaterial-based approach to prepare high amounts of extracellular vesicles with high bioactivity from endothelial progenitor cells (EPCs) by stimulation with silicate ions derived from bioactive silicate ceramics. We further show that hydrogel microspheres containing engineered extracellular vesicles are highly effective in the treatment of myocardial infarction in male mice by significantly enhancing angiogenesis. This therapeutic effect is attributed to significantly enhanced revascularization by the high content of miR-126a-3p and angiogenic factors such as VEGF and SDF-1, CXCR4 and eNOS in engineered extracellular vesicles, which not only activate endothelial cells but also recruit EPCs from the circulatory system.


Conflict of interest statement

The Shanghai Institute of Ceramics Chinese Academy of Sciences has applied for two patents related to silicate bioceramic ion solutions for the treatment of myocardial infarction, in which one has been granted and another is pending. J.C. and C.O. are the inventors of these two patents. The remaining authors declare no other competing interests.

Figures

Fig. 1
Fig. 1. High-efficiency engineering of highly active extracellular vesicles by the treatment of endothelial progenitor cells (EPCs) with silicate ions derived from bioactive ceramics for myocardial infarction therapy through enhancement of revascularization of infarcted tissues.
a EPCs were induced by calcium silicate (CS) ions to secrete highly active extracellular vesicles (CS-EPC-EV), and microspheres loaded with highly active extracellular vesicles (microsphere+CS-EPC-EVs) were prepared by microfluidic technology. b In situ injection of microsphere+CS-EPC-EVs at the site of myocardial infarction in mice to repair myocardial injury. c The mechanism of microspheres for the treatment of myocardial infarction. On the one hand, the extracellular vesicles in the microspheres inhibit apoptosis and promote proliferation, migration and angiogenesis of surviving endothelial cells (ECs) in the infarct border zone of myocardial infarction. On the other hand, extracellular vesicles recruit EPCs generated in the bone marrow from the circulatory system to the infarct border zone, which integrate themselves into damaged blood vessels through proliferation, migration, and differentiation, thereby promoting angiogenesis. This Figure was created with BioRender.com.
Fig. 2
Fig. 2. Activation of EPCs to secrete highly bioactive EVs by silicate ions (CS-EPC-EV) or normal culture medium (EPC-EV).
a The effect of different concentrations of CS extracts on the proliferation of EPCs was tested by 3-(4,5-dimethylthiazol-2-yl)-5-(3-carboxymethoxyphenyl)-2-(4-sulfophenyl)−2H-tetrazolium (MTS) (n = 5, biological replicates per group) *p < 0.05 vs. the control. bf The expression of proangiogenic genes was measured by quantitative reverse transcriptase Polymerase Chain Reaction (qRT‒PCR) on Day 2 and Day 4 in EPCs cultured in 1/256, 1/128, and 1/64 dilutions of (b Vascular endothelial growth factor A, VEGFA; c Endothelial nitric oxide synthase, eNOS; d Stromal cell-derived factor 1, SDF-1; e Insulin-like growth factor 1, IGF-1; f Hepatocyte growth factor, HGF) (n = 3, biological replicates per group). *p < 0.05 vs. the control. g Transmission electron microscopy (TEM) image of EPC-EVs, scale bar = 50 nm, (n = 3 independent experiment replicates per group). h Nanoparticle tracking analysis (NTA) analysis of CS-EPCs-EVs and EPC-EVs. i Particle concentrations of different types of EVs. *p < 0.05 vs. EPC-EVs (n = 3, independent experiment replicates per group). j Western blot analysis of the extracellular vesicle markers ALG-2-interacting protein X (Alix), Cluster of Differentiation 81 (CD81) and Cluster of Differentiation 63 (CD63). k ELISAs detected the content of VEGFA, eNOS, HGF, IGF-1, and SDF-1, in different EVs (n = 3, biological replicates per group). *p < 0.05 vs. EPC-EVs. Data are presented as the mean ± standard. Two-tailed Student’s t-test was used to compare the differences between two groups. One-way ANOVA and post hoc Bonferroni tests were used to compare differences among more than two groups. Source data are provided as a Source Data file. Each experiment was repeated 3 times or more independently with similar results.
Fig. 3
Fig. 3. CS-EPC-EVs can enhance the angiogenic ability of human umbilical vein endothelial cells (HUVECs) under glucose and oxygen deprivation.
a The proliferation of HUVECs treated with different EVs was detected by MTS under normal culture conditions (n = 3, biological replicates per group). b 5-ethynyl-2’-deoxyuridine (EdU) proliferation experiments of HUVECs treated with different EVs under glucose and oxygen deprivation (OGD). c Quantitative analysis of the EdU proliferation assay (n = 3, biological replicates per group). d PKH-26-labeled EVs (red fluorescence) were cocultured with HUVECs for 12 h, and phalloidin (green fluorescence) and 4′,6-diamidino-2-phenylindole (DAPI, blue fluorescence) were used to label the cytoskeleton and nucleus, respectively, (n = 3, biological replicates per group), scale bar = 25 μm. e, f Wound healing assays (e) (scale bar = 150 μm) and Transwell experiments (f) (scale bar = 100 μm) of HUVECs treated with different EVs under glucose and oxygen deprivation. g Quantitative analysis of the wound healing assay and Transwell assay (n = 3, biological replicates per group). h Tube formation experiments of HUVECs treated with different EVs under glucose and oxygen deprivation, scale bar = 150 μm. i Quantitative analysis of tube formation experiments (n = 3, biological replicates per group). j Terminal deoxynucleotidyl transferase dUTP nick end labeling (TUNEL) experiments of HUVECs treated with different EVs under glucose and oxygen deprivation, scale bar = 200 μm. k Quantitative analysis of the TUNEL assay. l qRT‒PCR detection of VEGFA, bFGF, IGF-1, eNOS, and SDF-1 gene expression in HUVECs treated with different EVs under glucose and oxygen deprivation (n = 3, biological replicates per group). m, n The expression and quantitative analysis of the VEGFA, eNOS, and SDF-1 proteins in HUVECs treated with different EVs under glucose and oxygen deprivation (n = 3, biological replicates per group). *p < 0.05, **p < 0.01 vs. OGD; #p < 0.05, ##p < 0.01 vs. CS-EPC-EVs. Data are presented as the mean ± standard. Two-tailed Student’s t-test was used to compare the differences between two groups. One-way ANOVA and post hoc Bonferroni tests were used to compare differences among more than two groups. Source data are provided as a Source Data file. Each experiment was repeated 3 times or more independently with similar results.
Fig. 4
Fig. 4. Preparation and characterization of gelatin methacryloyl-polyethylene glycol (GelMA-PEG) microspheres.
a Schematic diagram of the preparation principle of GelMA-PEG microsphere-encapsulated EVs. This Figure was created with BioRender.com. b Optical photograph of GelMA-PEG microspheres. Scale bar = 100 μm. c Particle size analysis of the microspheres. d Scanning electron microscopy (SEM) image of GelMA-PEG microspheres. Scale bar = 10 μm. e Three-dimensional fluorescence image of EV-encapsulated microspheres taken by confocal microscopy. Microspheres (fluorescein isothiocyanate (FITC) labeled, green fluorescence), EVs (1,1’-dioctadecyl-3,3,3’,3’-tetramethylindocarbocyanine perchlorate-labeled (PKH26-labeled), red fluorescence), scale bar = 10 μm. f The release profile of extracellular vesicles from microspheres was detected by a spectrofluorometer (n = 3, independent experiment replicates per group). g Fluorescence microscopy images of PKH26-EV-encapsulated microspheres after immersion in phosphate-buffered saline (PBS) for 1, 7, 14, and 21 days (line a, scale bar = 200 μm); magnified single microsphere images (line b, scale bar = 50 μm) and fluorescence intensity 3D surface plot (line c). Data are presented as the mean ± standard. Two-tailed Student’s t-test was used to compare the differences between two groups. One-way ANOVA and post hoc Bonferroni tests were used to compare differences among more than two groups. Source data are provided as a Source Data file. Each experiment was repeated 3 times or more independently with similar results.
Fig. 5
Fig. 5. Microsphere+CS-EPC-EVs can improve cardiac function after myocardial infarction, reduce cardiac remodeling, inhibit cardiomyocyte apoptosis, and increase angiogenesis (n = 5, biological replicates per group).
a Confocal fluorescence microscopy images of PKH26-EV-encapsulated microspheres in the area of mouse myocardial infarction at 1, 7, 14, and 21 days, Scale bar = 50 μm. PKH26-EV (red fluorescence), DAPI (blue fluorescence). b CD68 immunofluorescence staining of macrophages in cardiac tissue on Day 7 after myocardial infarction, Scale bar = 50 μm. CD68 (green fluorescence) and DAPI (blue fluorescence). Quantitative analysis of the number of CD68-positive cells. c M-mode ultrasound images on Day 21 after myocardial infarction. d Quantification of the ejection fraction (EF) and fractional shortening (FS) of the animals on Day 21 after myocardial infarction. e Masson staining of hearts on Day 21 after myocardial infarction. f Statistical analysis of left ventricular wall thickness, scar thickness and infarct size. The number of hearts = 5. g Wheat germ agglutinin immunofluorescence staining of myocardial cells in the marginal zone of myocardial infarction on Day 21 after myocardial infarction, scale bar = 50 μm. Cross-sectional area measurements of cardiomyocytes in the marginal zone of myocardial infarction. h TUNEL staining in the infarct margin area on Day 21 after myocardial infarction, Scale bar = 100 μm. Total nuclei (DAPI staining, blue) and TUNEL-positive nuclei (tan). Quantitative analysis of TUNEL-positive cardiomyocytes. i Immunofluorescence staining pictures of small arteries in the peripheral area of myocardial infarction on Day 21 after myocardial infarction, scale bar = 50 μm. Alpha-smooth muscle actin (α-SMA, green fluorescence) and DAPI (blue fluorescence). Immunofluorescence staining of capillaries in the peripheral area of myocardial infarction on Day 21 after infarction. CD31 (red fluorescence) and DAPI (blue fluorescence). j Quantitative analysis of immunofluorescence staining of arterioles and capillaries. *p < 0.05 and **p < 0.01 vs. the PBS group; #p < 0.05, ##p < 0.01 vs. microsphere+CS-EPC-EVs. Data are presented as the mean ± standard. Two-tailed Student’s t-test was used to compare the differences between two groups. One-way ANOVA and post hoc Bonferroni tests were used to compare differences among more than two groups. Source data are provided as a Source Data file. Each experiment was repeated 3 times or more independently with similar results.
Fig. 6
Fig. 6. CS-EPC-EVs promote EPCs migration in vitro and in vivo.
a Schematic of coincubation. This Figure was created with BioRender.com. b Transwell experiments and quantitative analysis of EPCs with different conditioned media under normoxia. *p < 0.05, **p < 0.01 vs. OGD; #p < 0.05, ##p < 0.01 vs. CS-EV+CM (n = 3, biological replicates per group), scale bar = 50 μm. c Cluster of Differentiation 34/Vascular Endothelial Growth Factor Receptor 2 (CD34+/VEGFR2+) immunofluorescence staining of EPCs in the peripheral area of myocardial infarction on Day 7 after infarction. CD34+ (red), VEGFR2+ (green), DAPI (blue), CD34+/VEGFR2+ (orange), scale bar = 50 μm, specimens (n = 5, biological replicates per group). d Fluorescence images of 3,3’-Dioctadecyloxacarbocyanine Perchlorate-EPCs (DiO-EPCs) and CD31-positive capillaries in the peripheral area of myocardial infarction on Day 7 after infarction. (1) and (2) are images of the corresponding area zoomed in on the yellow dot box. PKH26-EV (red fluorescence, white arrow), DiO-EPC (green fluorescence, purple arrow), CD31 (white fluorescence, yellow arrow), and DAPI (blue fluorescence) (n = 5, biological replicates per group). e Quantitative analysis of DiO-EPCs and the number of capillaries in the peripheral area of myocardial infarction (200 x magnification). *p < 0.05, **p < 0.01 vs. the PBS group; #p < 0.05, ##p < 0.01 vs. microsphere+CS-EPC-EVs (n = 5, biological replicates per group). f Schematic diagram of the DiO-EPCs injection and microsphere+CS-EPC-EV treatment of infarcted nude mice. This Figure was created with BioRender.com. Data are presented as the mean ± standard. Two-tailed Student’s t-test was used to compare the differences between two groups. One-way ANOVA and post hoc Bonferroni tests were used to compare differences among more than two groups. Source data are provided as a Source Data file. Each experiment was repeated 3 times or more independently with similar results.
Fig. 7
Fig. 7. Silicate ions from CS bioceramics promote the expression of angiogenesis-related factors and miRNAs in EPC-derived EVs.
a Heatmap of miRNA differential expression analysis between samples. Red represents upregulated genes, green represents downregulated genes, and color depth represents log10(COUNT+1) values. b Scatter plot of miRNA differential expression analysis between samples. Red dots indicate significantly upregulated miRNAs, and green dots indicate significantly downregulated miRNAs. c The expression of miR-126a-3p in the EVs was measured by qRT‒PCR. **p < 0.01 vs. EPC-EVs, ##p < 0.01 vs. CS-EPC-EVs (n = 5, biological replicates per group). d qRT‒PCR detection of miR-126a-3p expression in EPCs after silicate ion treatments. *p < 0.05 and **p < 0.01 vs. EPC-EVs (n = 5, biological replicates per group). e The expression of miR-126a-3p in HUVECs treated with different EVs under glucose and oxygen deprivation (n = 5, biological replicates per group) **p < 0.01 vs. OGD, ##p < 0.01 vs. CS-EPC-EVs. Data are presented as the mean ± standard. Two-tailed Student’s t-test was used to compare the differences between two groups. One-way ANOVA and post hoc Bonferroni tests were used to compare differences among more than two groups. Source data are provided as a Source Data file. Each experiment was repeated 3 times or more independently with similar results.
Fig. 8
Fig. 8. CS-EPC-EVs promote angiogenesis by transferring highly expressed miR-126a-3p to HUVECs (n = 3, biological replicates per group).
a qRT‒PCR analysis of miR-126a-3p expression in CS-EPCs after miR-126a-3p inhibitor transfection. b qRT‒PCR analysis of miR-126a-3p expression in EVs derived from miR-126a-3p inhibitor-transfected EPCs and verification of whether EVs mediate angiogenesis in HUVECs by transferring miR-126a-3p. EPCs were transfected with miR-126a-3p inhibitor (miR-126a-3p inhibitor NC was used as a negative control group) to silence the effect of miR-126a-3p and then cultured with silicate ions (CS+126IEPC-EV). c, d Qualitative and quantitative analysis of scratch migration experiments (scale bar = 150 μm), transwell migration experiments (scale bar = 100 μm) (c) and tube formation experiments (scale bar = 150 μm) (d) of HUVECs treated with different EVs under glucose and oxygen deprivation. e Qualitative and quantitative analysis of Transwell migration experiments of EPCs treated with different conditioned media under normoxic conditions, scale bar = 100 μm. f qRT‒PCR analysis of the expression of SDF-1 and eNOS in HUVECs treated with different EVs under glucose and oxygen deprivation. g The expression and quantitative analysis of RGS16 and CXCR4 proteins in HUVECs treated with different EVs under glucose and oxygen deprivation. h The expression and quantitative analysis of Regulator of G protein Signaling 16 (RGS16), C-X-C Chemokine Receptor Type 4 (CXCR4), SDF-1, phosphorylated protein kinase B (p-AKT) and total protein kinase B (t-AKT) proteins in HUVECs treated with different EVs under glucose and oxygen deprivation. *p < 0.05 and **p < 0.01 vs. OGD, #p < 0.05 vs. the other two groups. Data are presented as the mean ± standard. Two-tailed Student’s t-test was used to compare the differences between two groups. One-way ANOVA and post hoc Bonferroni tests were used to compare differences among more than two groups. Source data are provided as a Source Data file. Each experiment was repeated 3 times or more independently with similar results.
Fig. 9
Fig. 9. miR-126a-3p was mediated by Heterogeneous Nuclear Ribonucleoprotein A2/B1 (hnRNPA2B1) and Neutral Sphingomyelinase 2 (nSMase2) to sort into EVs (n = 3, biological replicates per group).
a The expression of hnRNPA2B1, Sphingomyelin Phosphodiesterase 3 (SMPD3), Syncrip, Y-box binding protein 1 (Ybx1), and Annexin A2 (ANXA2) in EPCs after culture with silicate ions (CS-EPCs) for 48 h. b Western blot analysis of hnRNPA2B1 and nSMase2 proteins in EPCs after culture with silicate ions for 48 h. *p < 0.05 vs. EPC. c The expression of hnRNPA2B1 and SMPD3 in CS-EPCs after knockdown with specific siRNA. d Protein analysis of hnRNPA2B1 and nSNase2 in CS-EPCs after knockdown with specific siRNA. e, f The expression of miR-126a-3p in EVs after knockdown of hnRNPA2B1 (e) and SMPD3 (f). g, h The expression of miR-126a-3p in EPCs after knockdown of hnRNPA2B1 (g) and SMPD3 (h). #p < 0.05 vs. the other two groups. Data are presented as the mean ± standard. Two-tailed Student’s t-test was used to compare the differences between two groups. One-way ANOVA and post hoc Bonferroni tests were used to compare differences among more than two groups. Source data are provided as a Source Data file. Each experiment was repeated 3 times or more independently with similar results.
Fig. 10
Fig. 10. Summary of the mechanism underlying the stimulatory effect of CS-EPC-EVs on the recruitment of EPCs and angiogenesis of HUVECs.
Silicate ions promote the expression of nSMase2, hnRNPA2B1 and miR-126a-3p in EPCs. The increased nSMase2 results in an increase in ceramide secretion in cells, thereby enhancing the production of extracellular vesicles. The higher hnRNPA2B1 and nSMase2 levels selectively enhanced the sorting of miR-126a-3p into multivesicular bodies (MVBs, sites of extracellular vesicle biogenesis). In addition, the high expression of miR-126a-3p promotes the expression of related angiogenic factors in EPCs, resulting in the increased content of related angiogenic factors in extracellular vesicles. After the highly bioactive extracellular vesicles with high contents of miR-126a-3p and angiogenic factors were transferred to recipient HUVECs, highly expressed miR-126a-3p could inhibit RGS16 and activate the SDF-1/CXCR4 axis and its downstream Phosphatidylinositol 3-kinase (PI3K)/AKT/eNOS axis of HUVECs, thereby mediating angiogenesis. Furthermore, a high content of angiogenic factors (such as VEGF) in extracellular vesicles contributes to the enhanced angiogenesis of HUVECs. This Figure was created with BioRender.com.

Similar articles

Cited by

References

    1. Cochain C, Channon KM, Silvestre JS. Angiogenesis in the infarcted myocardium. Antioxid. Redox Signal. 2013;18:1100–1113. doi: 10.1089/ars.2012.4849. - DOI - PMC - PubMed
    1. He L, et al. Preexisting endothelial cells mediate cardiac neovascularization after injury. J. Clin. Invest. 2017;127:2968–2981. doi: 10.1172/JCI93868. - DOI - PMC - PubMed
    1. Herbert SP, Stainier DY. Molecular control of endothelial cell behaviour during blood vessel morphogenesis. Nat. Rev. Mol. Cell Biol. 2011;12:551–564. doi: 10.1038/nrm3176. - DOI - PMC - PubMed
    1. Jujo K, Ii M, Losordo DW. Endothelial progenitor cells in neovascularization of infarcted myocardium. J. Mol. Cell. Cardiol. 2008;45:530–544. doi: 10.1016/j.yjmcc.2008.08.003. - DOI - PMC - PubMed
    1. Shi Q, et al. Evidence for circulating bone marrow-derived endothelial cells. Blood. 1998;92:362–367. doi: 10.1182/blood.V92.2.362. - DOI - PubMed

Publication types