. 2023 Apr 14;14(1):2123.
doi: 10.1038/s41467-023-37744-x.

IDH3γ functions as a redox switch regulating mitochondrial energy metabolism and contractility in the heart

Affiliations

IDH3γ functions as a redox switch regulating mitochondrial energy metabolism and contractility in the heart

Maithily S Nanadikar et al. Nat Commun. .

Abstract

Redox signaling and cardiac function are tightly linked. However, it is largely unknown which protein targets are affected by hydrogen peroxide (H2O2) in cardiomyocytes that underly impaired inotropic effects during oxidative stress. Here, we combine a chemogenetic mouse model (HyPer-DAO mice) and a redox-proteomics approach to identify redox sensitive proteins. Using the HyPer-DAO mice, we demonstrate that increased endogenous production of H2O2 in cardiomyocytes leads to a reversible impairment of cardiac contractility in vivo. Notably, we identify the γ-subunit of the TCA cycle enzyme isocitrate dehydrogenase (IDH)3 as a redox switch, linking its modification to altered mitochondrial metabolism. Using microsecond molecular dynamics simulations and experiments using cysteine-gene-edited cells reveal that IDH3γ Cys148 and 284 are critically involved in the H2O2-dependent regulation of IDH3 activity. Our findings provide an unexpected mechanism by which mitochondrial metabolism can be modulated through redox signaling processes.


Conflict of interest statement

The authors declare no competing interests.

Figures
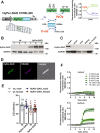
Fig. 1
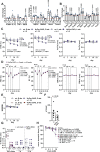
Fig. 1. Expression and activation of the HyPer-DAO fusion protein in cardiomyocyte-specific transgenic mice.
A Scheme of the HyPer-DAO construct used for generating HyPer-DAO cardiomyocyte-specific transgenic mice and the HyPer and DAO chemical reactions. B Immunoblot for HyPer-DAO and GAPDH protein levels in cardiac protein lysates from three independent wild type (wt) and three independent HyPer-DAO mice. C Cardiac-specific HyPer-DAO protein expression in a HyPer-DAO mouse as demonstrated by immunoblot performed with protein lysates from different organs. This confirmatory experiment has been performed once. D Representative confocal image of a DRAQ5 stained cardiomyocyte isolated from a HyPer-DAO mouse. In total cardiomyocytes from two independent mice were isolated and 5 cardiomyocytes per mouse were imaged. E Cardiac output (CO) as determined by echocardiography in resting male and female HyPer-DAO and wt mice (n = independent 13 wt male, 15 HyPer-DAO male, 16 wt female and 20 HyPer-DAO female mice). F Response of HyPer-DAO cardiomyocytes to treatment with D-ala or L-ala (added at time point 4 min). The HyPer fluorescence response was recorded in the cytosol (upper panel) and the nucleus (lower panel). Ratios are normalized to the HyPer ratio prior to treatment, n = 27, 32, 47, 56, 38 and 13 independent cardiomyocytes were analyzed regarding their response in the nucleus and n = 23, 26, 13, 29, 25, and 17 cardiomyocytes regarding their response in the cytoplasm were analyzed after treatment with 3 mM D-ala, 4 mM D-ala, 6 mM D-ala, 8 mM D-ala, 10 mM D-ala and 10 mM L-ala, respectively. scale bar, 10 µm. Data are presented as mean values ± SEM. Source data are provided as a Source Data file.
Fig. 2
Fig. 2. Reversible impaired inotropic response of HyPer-DAO mice towards activation of DAO.
Relative changes in (A) RNA levels of NF-κB (left panel) and Nrf2 (right panel) target genes and (B) antioxidant enzymes in the heart of HyPer-DAO male mice versus wild type (wt) male mice after 7 days (n = 4 independent wt and n = 4 independent HyPer-DAO animals) and 21 days (n = 3 independent wt and n = 3 independent HyPer-DAO animals) of treatment with 55 mM D-ala in the drinking water. For Nrf2 target RNAs in addition mice that received D-ala for 7 days in the drinking water and subsequently 2 days treatment-free drinking water (off) were analyzed, n = 4 independent HyPer-DAO mice. C, D Echocardiographic analysis of fractional area shortening (FAS), ejection fraction (EF), anterior wall thickness (AWth) and posterior wall thickness (PWth) in male (in C) and a mixed group of female and male (in D) HyPer-DAO or wt mice after treatment with 55 mM D-ala or L-ala in the drinking water as indicated. E Heart weight to body weight (HW/BW) in female and male HyPer-DAO and wt mice before and after D-ala treatment. F ATP/ADP levels in left ventricular samples obtained from n = 9 independent wt and n = 6 independent HyPer-DAO mice 7 days after D-ala treatment. G Quantification of Sirius red/Fast green staining for fibrotic areas in cardiac slices of male HyPer-DAO and wt mice. The total area of fibrosis (t), interstitial (i) and perivascular (p) fibrotic area were quantified in the left ventricles. Cardiac slices of mice that underwent transverse aortic constriction (TAC) or sham surgery were used as positive control for the staining and quantification. n = 5 independent TAC and sham mice, n = 4 (7 days) and n = 3 (21 days) independent wt mice and n = 3 (7 and 21 days) HyPer-DAO mice. H Heart slices isolated from a mixed group of female and male HyPer-DAO or wt mice were treated with 0-10 mM D-ala + /− 1 mM NAC and force development was measured. Data are presented as mean values ± SEM, two-tailed one sample t-test (A, B), one-way ANOVA (D and G), two-way ANOVA (C and H), and two-tailed unpaired t-test (F). This figure is related to Supplemental Fig. 1. Source data are provided as a Source Data file.
Fig. 3
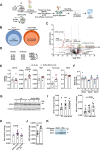
Fig. 3. IDH3γ is redox modified in the hearts of HyPer-DAO mice after activation of DAO in vivo.
A Scheme of the redox-proteomics analysis performed with heart samples obtained from n = 3 independent male HyPer-DAO and n = 3 independent wt mice that were treated for 7 days with 55 mM D-ala in the drinking water. B Venn-diagrams demonstrate elevated yield of cysteine-containing unique peptides and total number of identified peptide spectra matches (PSM) by redox enrichment. C Volcano plot of the peptides identified in the redox-proteomics screen as outlined in A. fold change (FC) D Protein dendrogram for the different murine isocitrate dehydrogenase isoforms and subunits. E Activity of the indicated TCA cycle enzymes determined in protein extracts obtained from hearts of 7 days D-ala treated female HyPer-DAO and wt mice. n = 6 independent mice per group. F Relative changes in RNA levels of IDH3 subunits in the hearts of HyPer-DAO mice versus wt mice after 7 days (n = 4 independent wt and n = 4 independent HyPer-DAO animals) and 21 days (n = 3 independent wt and n = 3 independent HyPer-DAO animals) of treatment with D-ala. G Immunoblot for IDH3γ and vinculin protein levels in heart samples of three independent wt and three independent HyPer-DAO mice after 7 days of treatment with D-ala. H IDH3 activity in samples obtained from hearts of a mixed group of male and female HyPer-DAO or wt mice after 7 days treatment with D-ala (n = 16 independent wt and n = 19 independent HyPer-DAO animals) or after 7 days treatment with D-ala plus 2 additional D-ala free days (off, n = 7 independent HyPer-DAO animals). I IDH1/2 and IDH3 activity in protein samples obtained from isolated HyPer-DAO cardiomyocytes non-treated (n.t.) and after treatment with 2 mM D-ala or L-ala for 20 min. Cardiomyocytes were isolated from n = 8 independent HyPer-DAO mice. J IDH3 activity determined in protein extracts obtained from the left ventricular myocardium of mice 4 weeks after transverse aortic constriction (TAC) versus sham surgery. n = 9 independent mice per group. K Representative immunoblot for IDH3γ oxidation analyzed by PEG switch assay in left ventricular samples from TAC and sham treated mice. The experiment has been performed three times. Data are presented as mean values ± SEM, two-tailed unpaired t-test (C, E and J), two-tailed one-sample t-test (F), one-way ANOVA (I) and one-way Welch’s ANOVA test (H). Source data are provided as a Source Data file.
Fig. 4
Fig. 4. HyPer-DAO overexpressing HEK cells exhibit a reversible redox modification and activity of IDH3 after activation of DAO in vitro.
A Confocal images of HEK cells overexpressing the HyPer-DAO fusion protein in the nucleus (HyPer-DAO-NLS), the cytoplasm (HyPer-DAO-NES) or the mitochondrial matrix (HyPer-DAO-MLS) after the indicated staining. The staining has been performed once. B HyPer fluorescence response in HyPer-DAO overexpressing HEK cells to treatment with L-ala, D-ala or H2O2 (added at time point 4 min). Ratios are normalized to the HyPer ratio prior to the stimulation, n = 30 independent cells per condition were analyzed except than n = 25 independent HyPer-DAO-NES and HyPer-DAO-NLS cells treated with 500 µM H2O2, see also Supplemental Fig. 2. C IDH3 activity in cell extracts obtained from HEK HyPer-DAO-NES, HEK HyPer-DAO-NLS and HEK HyPer-DAO-MLS cells non-treated (n.t.) and after treatment with 50 mM D-ala, 50 mM L-ala ± 8 mM NAC or 500 µM H2O2 for 20 min. n = 8 independent experiments for HyPer-DAO-NES all conditions; n = 6 independent experiments for HyPer-DAO-NLS and HyPer-DAO-MLS all conditons except for n = 5 for L-ala and D-ala + NAC, see also Supplemental Fig. 3. D HyPer fluorescence (left panel) and MitoSOX (right panel) response in HyPer-DAO-NLS cells to treatment with L-ala, D-ala ± NAC (added at time point 4 min). Ratios are normalized to the HyPer ratio or the MitoSOX fluorescence prior to the stimulation, n = 30 independent cells for all HyPer measurements and n = 25 independent cells for all MitoSox measurements. E Quantification of IDH3γ oxidation analyzed by PEG switch assay in HEK HyPer-DAO-NLS cells n.t. and after treatment with 50 mM L-ala, 50 mM D-ala or 500 µM H2O2 for 20 min. n = 3 independent experiments. A representative experiment is shown in the left panel. F IDH1/2 and IDH3 activity in cell extracts obtained from HEK HyPer-DAO-NLS cells n.t. and after 50 mM D-ala for 20 min or 50 mM D-ala for 20 min and additional 24 hrs D-ala free incubation time. n = 6 independent experiments for n.t., L-ala and D-ala, n = 5 independent experiments for D-ala on-off. G Quantification of IDH3γ oxidation analyzed by PEG switch assay in HEK HyPer-DAO-NLS cells n.t. and after treatment with 50 mM D-ala ± 8 mM NAC for 20 min or 50 mM D-ala for 20 min and an additional 30 min D-ala free incubation time (on-off). n = 5 independent experiments. Representative experiment is shown in the left panel. Data are presented as mean values ± SEM, *p < 0.05, one-way ANOVA (C, E, F and G). Source data are provided as a Source Data file.
Fig. 5
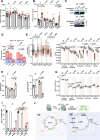
Fig. 5. Endogenously produced H2O2 impairs ATP produced in the mitochondria.
A ATP levels in HEK HyPer-DAO-NLS and wild type (wt) cells either non-treated (n.t.) or after treatment with 50 mM L-ala and D-ala ± 8 mM NAC or 500 µM H2O2 for 20 min, n = 8 independent samples. B Mitochondrial and glycolytic ATP production in HEK HyPer-DAO-NLS cells after treatment with 50 mM L-ala or D-ala for 20 min. n = 4 independent experiments. C Mitochondrial and glycolytic ATP production in cardiomyocytes isolated from HyPer-DAO mice after treatment with 2 mM D-ala or L-ala for 20 min. n = 7 independent mice per group. D Ratio of reduced glutathione (GSH) to oxidized glutathione (GSSG) and total glutathione levels E in HEK HyPer-DAO-NLS cells either n.t. and after treatment with 50 mM D-ala or L-ala for 20 min, n = 3 biologically independent samples. Data are presented as mean values ± SEM, one-way ANOVA (A, B, C, D and E). Source data are provided as a Source Data file.
Fig. 6
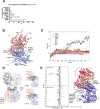
Fig. 6. Disulfide-bridge formation between IDH3γ Cys148 and Cys284 changes the tetramerization interface of IDH3.
A Quantification of IDH3γ Cys148 oxidation as the percentage of occupancy in different tissues from n = 5 biologically independent 16-week-old male C57BL/6 J mice. Data are obtained from the Oximouse database. subQ subcunateous fat, SKM skeletal muscle, epi epididymal fat, BAT brown adipose tissue. mean ± SEM. B Structure of the IDH3α/γ dimer with main functional sites. Citrate, Mg2+ and ADP are shown as ball and sticks. C Root mean square deviation (RMSD) plot for the clasp region for each system/replica. D Selected clasp regions from the two simulations showing substantial conformational changes (noSSr2, noSSr5, in blue for α subunit and red for γ subunit) and one stable reference (SSr2, in cyan for α subunit and orange for γ subunit) superimposed onto the tetrameric structure of IDH3 (IDH3α/γ / IDH3α/β, PDB ID: 7CE3, clasp regions in gray). For clarity, the zoomed images do not show the IDH3α/β dimer. E Stress difference plot. Residues were renumbered consecutively from 0. The difference between the systems without (noSS) and with disulfide bridge (SS) was obtained by computing the difference between their averages, the standard deviations for each residue in the averaged curves noSS and SS were propagated to the difference (gray error bars). Residues with statistically relevant (p < 0.0001 in a Student’s t-test on the two series with n = 50 data points) changes in the total stress between noSS and SS are highlighted and mapped onto the structure. Cysteines involved in the disulfide-bond are circles in yellow. This figure is related to Supplemental Fig. 4. Source data are provided as a Source Data file.
Fig. 7
Fig. 7. Redox modification of IDH3γ Cys148 and Cys284 is responsible for ATP production in the mitochondria.
IDH1/2 (A) and IDH3 (B) activity in cell extracts obtained from HEK HyPer-DAO-NLS wild type (wt), C148A, C284A and C236A cells non-treated (n.t.) and after treatment with 50 mM D-ala or 50 mM L-ala for 20 min, n = 12 independent experiments for HyPer-DAO-NLS wt cells and n = 6 independent experiments for C148A, C284A and C236A cells. C Representative immunoblot for IDH3γ oxidation analyzed by PEG switch assay in HEK HyPer-DAO-NLS wt, C148A and C284A cells n.t. or after treatment with 50 D-ala for 10 min. The experiment has been performed three times. D Mitochondrial and glycolytic ATP production in HEK HyPer-DAO-NLS wt and C148A cells after treatment with 50 mM D-ala or L-ala for 20 min. n = 7 independent experiments. E Mitochondrial ATP levels determined with the fluorescence sensor ATP-red in HEK HyPer-DAO-NLS wt, C148A, C284A and C236A cells n.t. and after treatment with 50 mM D-ala or L-ala for 20 min. n = 100 independent cells were analyzed per condition. F, G HEK HyPer-DAO-NLS wt and C148A cells were cultured with uniformly labeled 13C-glucose for 24 h. Subsequently cells were left n.t. or treated with 50 mM D-ala (D) or L-ala (L) for 20 min. Cells were lysed and total abundance of TCA cycle metabolite (F) and mean enrichment of 13C labeled metabolites (G) were determined. n = 5 independent biological samples for HyPer-DAO-NLS cells n.t., n = 6 independent biological samples for C148A cells n.t. and n = 8 independent biological samples for HyPer-DAO-NLS and C148A cells either D-ala and L-ala treated. H NADH/NAD+ and NADPH/NADP+ ratios in HyPer-DAO-NLS wt and C148A cells n.t. or after treatment with 50 mM D-ala or L-ala. n = 4 independent biological samples per condition. I GSH and GSSG levels in HyPer-DAO-NLS wt and C148A cells n.t. or after treatment with 50 mM D-ala or L-ala. n = 5 independent biological samples per condition. J Summary scheme of the findings obtained in the HyPer-DAO mice and the HEK HyPer-DAO cells. Created with BioRender.com. Data are presented as mean values ± SEM (except F, G), Box-Whisker-Plot (showing the minimun, median and maximum with error bars showing the SD) in F and G, one-way ANOVA (A, B, D, E, F, G, H and I). This figure is related to Supplemental Fig. 5. Source data are provided as a Source Data file.

References

    1. Jones DP, Sies H. The redox code. Antioxid. Redox Signal. 2015;23:734–746. - PMC - PubMed
    1. Ryter SW, et al. Mechanisms of cell death in oxidative stress. Antioxid. Redox Signal. 2007;9:49–89. - PubMed
    1. Reczek CR, Chandel NS. ROS-dependent signal transduction. Curr. Opin. Cell Biol. 2015;33:8–13. - PMC - PubMed
    1. Benchoam D, Cuevasanta E, Moller MN, Alvarez B. Hydrogen sulfide and persulfides oxidation by biologically relevant oxidizing species. Antioxid. (Basel) 2019;8:48. - PMC - PubMed
    1. Brandes RP, Rezende F, Schroder K. Redox regulation beyond ROS: why ROS should not be measured as often. Circ. Res. 2018;123:326–328. - PMC - PubMed

Publication types

Substances

LinkOut - more resources