. 2023 Apr 13;13(1):6079.
doi: 10.1038/s41598-023-32982-x.

Parameter inference for enzyme and temperature constrained genome-scale models

Affiliations

Parameter inference for enzyme and temperature constrained genome-scale models

Jakob Peder Pettersen et al. Sci Rep. .

Abstract

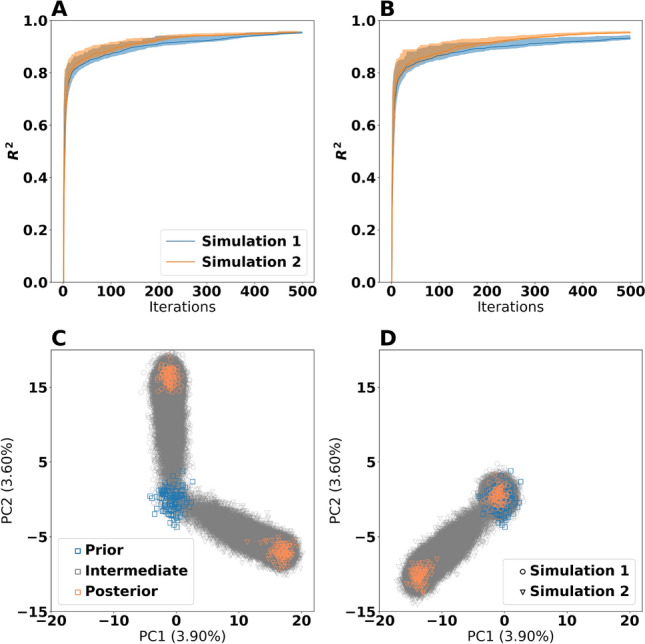
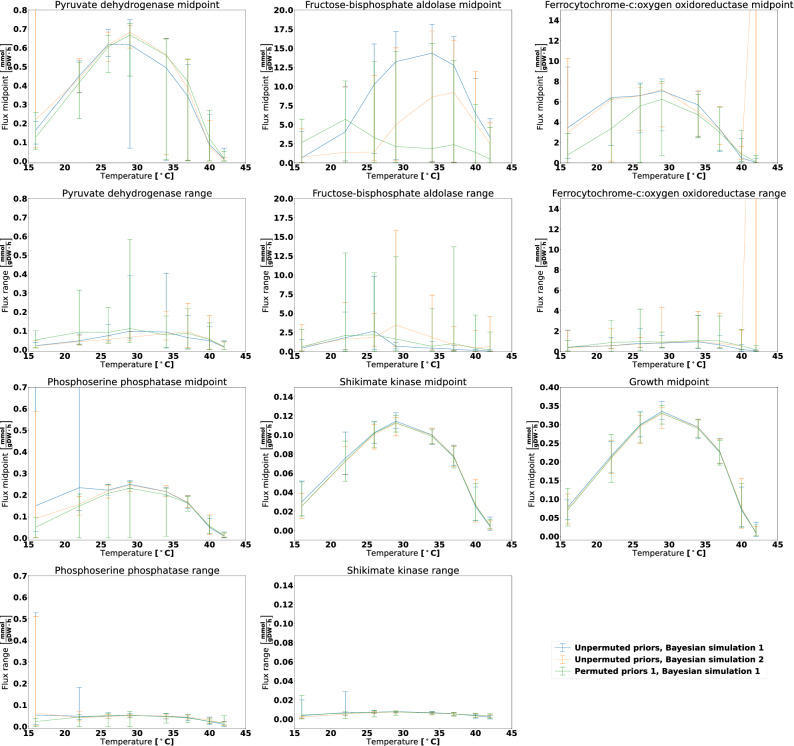
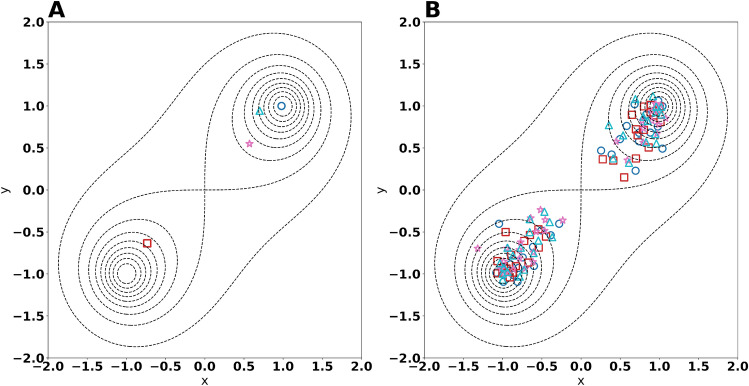
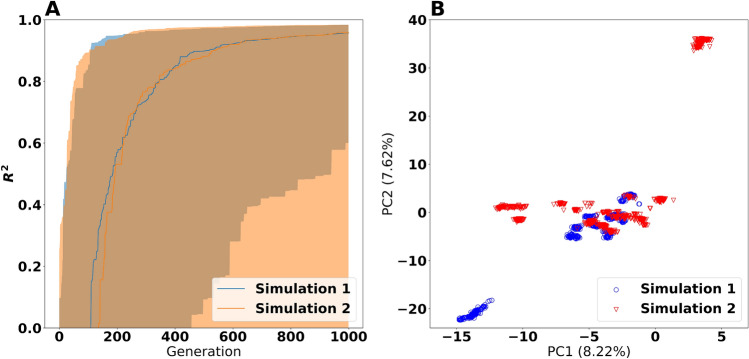
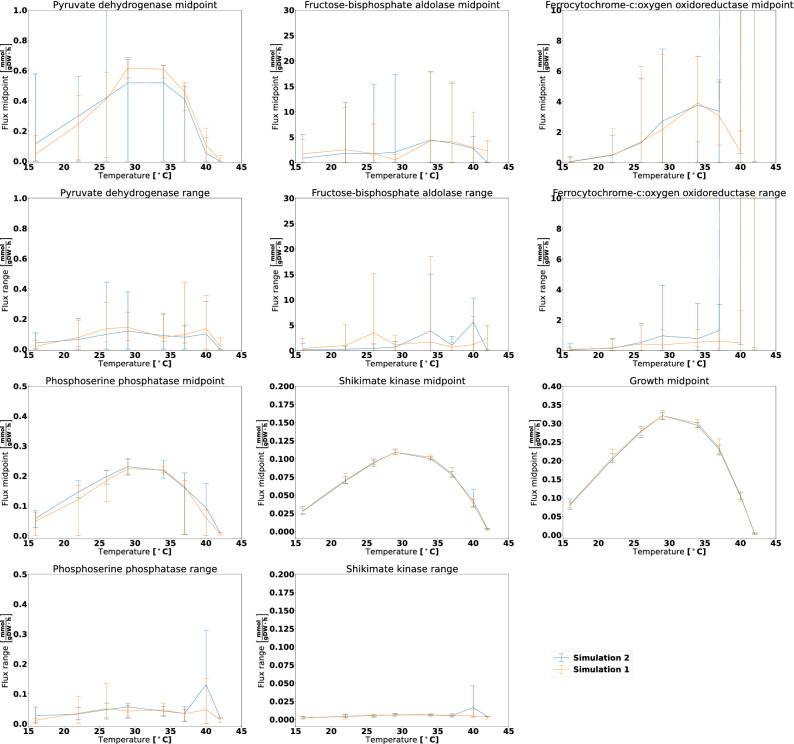
The metabolism of all living organisms is dependent on temperature, and therefore, having a good method to predict temperature effects at a system level is of importance. A recently developed Bayesian computational framework for enzyme and temperature constrained genome-scale models (etcGEM) predicts the temperature dependence of an organism's metabolic network from thermodynamic properties of the metabolic enzymes, markedly expanding the scope and applicability of constraint-based metabolic modelling. Here, we show that the Bayesian calculation method for inferring parameters for an etcGEM is unstable and unable to estimate the posterior distribution. The Bayesian calculation method assumes that the posterior distribution is unimodal, and thus fails due to the multimodality of the problem. To remedy this problem, we developed an evolutionary algorithm which is able to obtain a diversity of solutions in this multimodal parameter space. We quantified the phenotypic consequences on six metabolic network signature reactions of the different parameter solutions resulting from use of the evolutionary algorithm. While two of these reactions showed little phenotypic variation between the solutions, the remainder displayed huge variation in flux-carrying capacity. This result indicates that the model is under-determined given current experimental data and that more data is required to narrow down the model predictions. Finally, we made improvements to the software to reduce the running time of the parameter set evaluations by a factor of 8.5, allowing for obtaining results faster and with less computational resources.


Conflict of interest statement

The authors declare no competing interests.

Figures

Figure 1
Figure 1
Comparison of the effect of prior and random seed on the Bayesian calculation method. Panel (A) and (B) show the training R2 values for the unpermuted priors and permuted prior 1, respectively. An R2 value of 1 corresponds to exact correspondence between the training data and the model predictions. The shaded regions indicate the 5th and 95th percentiles, whereas the solid lines indicate the median (50th percentile). Panel (C) and (D) show Principal Component Analysis (PCA) plots of the parameter sets from the unpermuted priors and permuted prior 1, respectively. Each point is a candidate parameter set. The prior points are the ones which served as a starting point for the calculation method, the estimated posterior points are the ones which had R2>0.9, whereas all other points are intermediate points stemming from the simulations. The axes are identical for both panels and use the same ordination, making the panels directly comparable.
Figure 2
Figure 2
FVA analysis for the aerobic dataset for six reactions and varying temperature when using estimated posterior distributions obtained for the Bayesian calculation method. The midpoint panels show the FVA flux midpoint, this is: The average of the maximum and minimum attainable flux given the optimization objective. The range panels show the absolute difference between the maximum and minimum flux. The lines denote the mean midpoint or range value, whereas the error bars span from the lowest to the highest observed value. The growth reaction is included for reference, and it will always display an FVA range of zero as it is the optimization target.
Figure 3
Figure 3
Results of parameter inference on the toy example. Panel (A) and (B) show the final generation of particles for the Bayesian calculation method and evolutionary algorithm, respectively. Each point represents an individual in the final population. Each shape and colour (each shape is associated to exactly one colour) represents one of the four replicate simulation. The global fitness optima of the problem are the points (-1,-1) and (1, 1) , and are marked by dotted contours. For Panel (A), the particles from each simulation are so close that they are visually indistinguishable and therefore appear as a single point.
Figure 4
Figure 4
Results from the evolutionary algorithm with F=0.5 and CR=0.99. Panel (A) shows the training R2 values. An R2 value of 1 corresponds to exact correspondence between the training data and the model predictions. The shaded regions indicate the 5th and 95th percentiles, whereas the solid lines indicate the median (50th percentile). Panel (B) shows the Principal Component Analysis (PCA) plot of the particles having R2>0.98.
Figure 5
Figure 5
FVA analysis on the results from the evolutionary algorithm under aerobic conditions. The particles selected for this analysis stem from the two simulations with F=0.5 and CR=0.99, considering only the particles with R2>0.98. The midpoint panels show the FVA flux midpoint, ie. the average of the maximum and minimum attainable flux given the optimization objective. The range panels show the absolute difference between the maximum and minimum flux. The lines denote the mean midpoint or range value, whereas the error bars span from the lowest to the highest observed value. The growth reaction is included for reference, and it will always display an FVA range of zero as it is the optimization target.

Similar articles

References

    1. van der Kamp MW, et al. Dynamical origins of heat capacity changes in enzyme-catalysed reactions. Nat. Commun. 2018;9:1177. doi: 10.1038/s41467-018-03597-y. - DOI - PMC - PubMed
    1. Hobbs JK, et al. Change in heat capacity for enzyme catalysis determines temperature dependence of enzyme catalyzed rates. ACS Chem. Biol. 2013;8:2388–2393. doi: 10.1021/cb4005029. - DOI - PubMed
    1. Birch A N, Petersen M A, Hansen Åse S. The aroma profile of wheat bread crumb influenced by yeast concentration and fermentation temperature. LWT Food Sci. Technol. 2013;50:480–488. doi: 10.1016/j.lwt.2012.08.019. - DOI
    1. Molina AM, Swiegers JH, Varela C, Pretorius IS, Agosin E. Influence of wine fermentation temperature on the synthesis of yeast-derived volatile aroma compounds. Appl. Microbiol. Biotechnol. 2007;77:675–687. doi: 10.1007/s00253-007-1194-3. - DOI - PubMed
    1. Li G, et al. Bayesian genome scale modelling identifies thermal determinants of yeast metabolism. Nat. Commun. 2021;12:190. doi: 10.1038/s41467-020-20338-2. - DOI - PMC - PubMed

Publication types