. 2023 Apr 13;13(1):53.
doi: 10.1038/s41408-023-00826-6.

Targeting of epigenetic co-dependencies enhances anti-AML efficacy of Menin inhibitor in AML with MLL1-r or mutant NPM1

Affiliations

Targeting of epigenetic co-dependencies enhances anti-AML efficacy of Menin inhibitor in AML with MLL1-r or mutant NPM1

Warren Fiskus et al. Blood Cancer J. .

Erratum in

Abstract

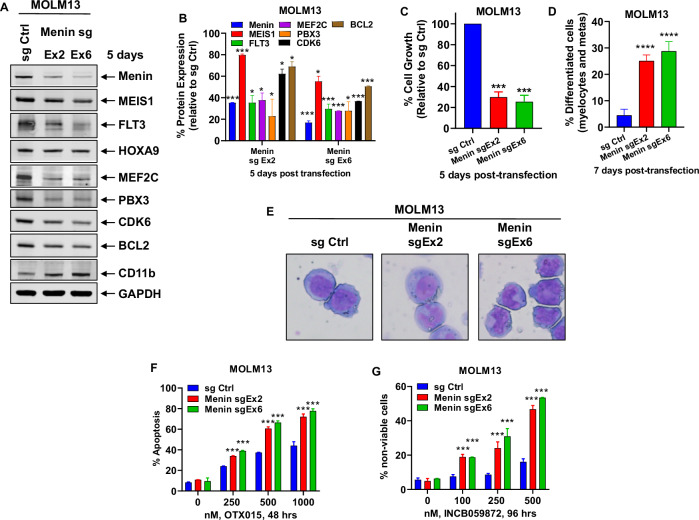
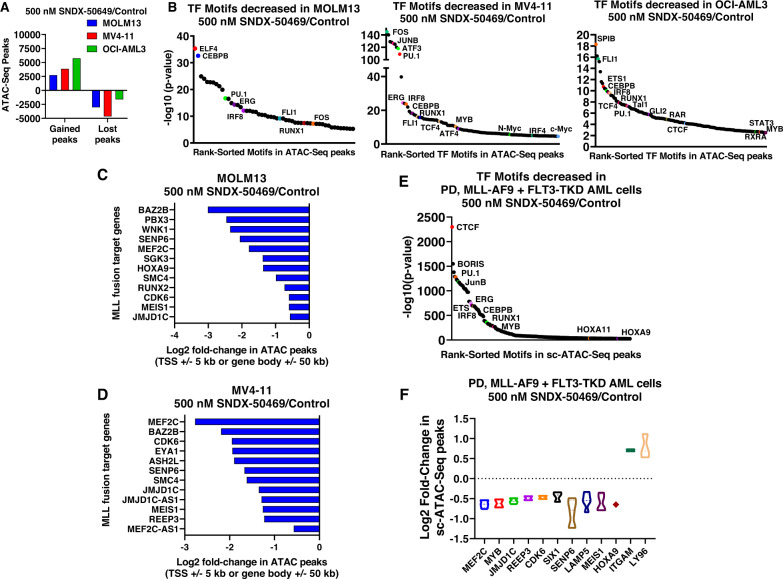
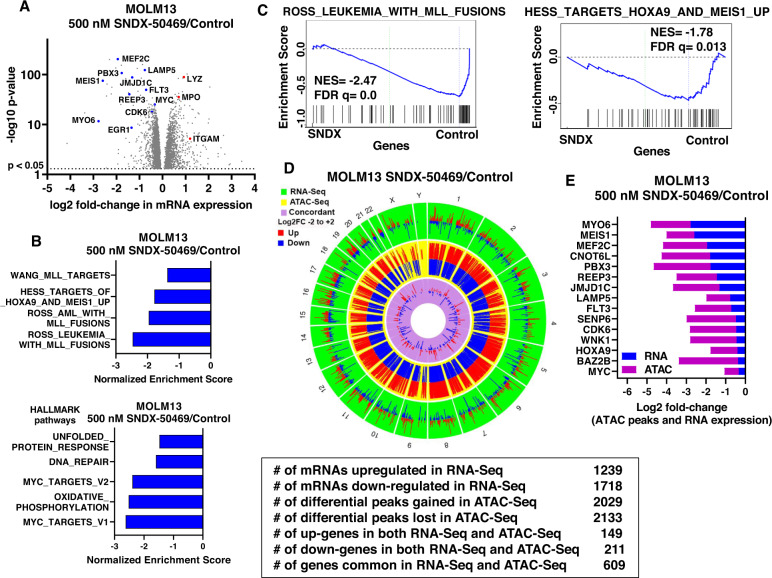
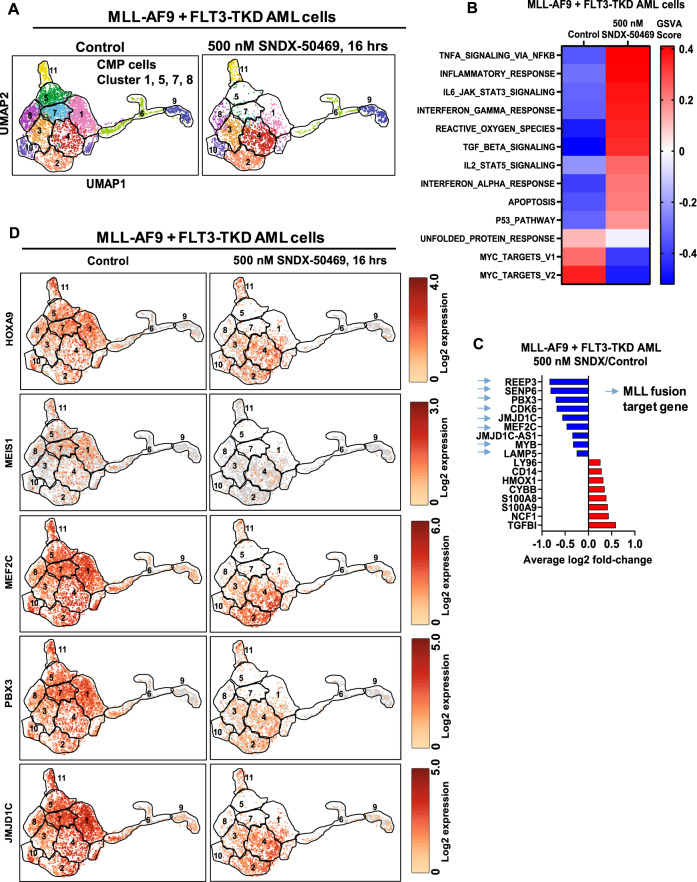
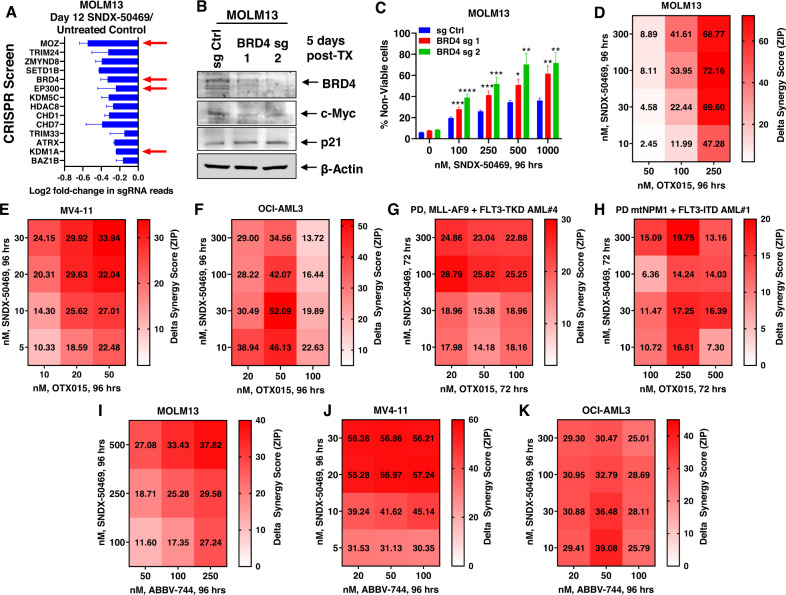
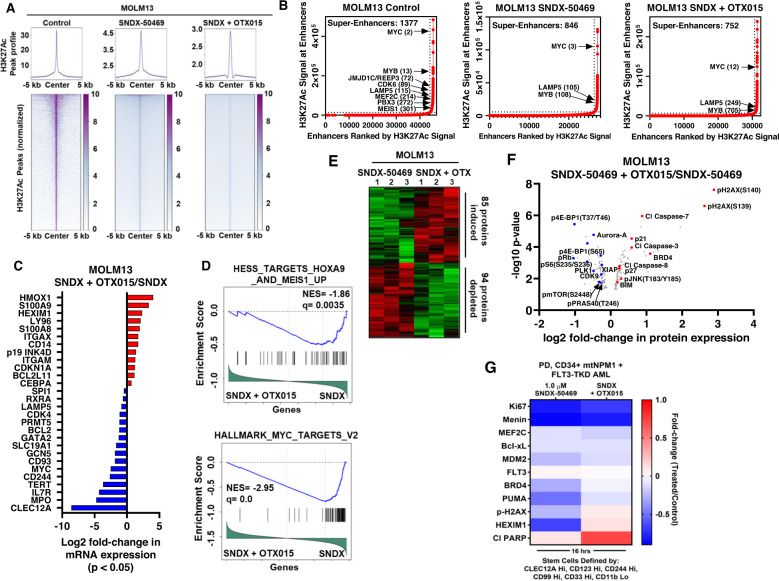
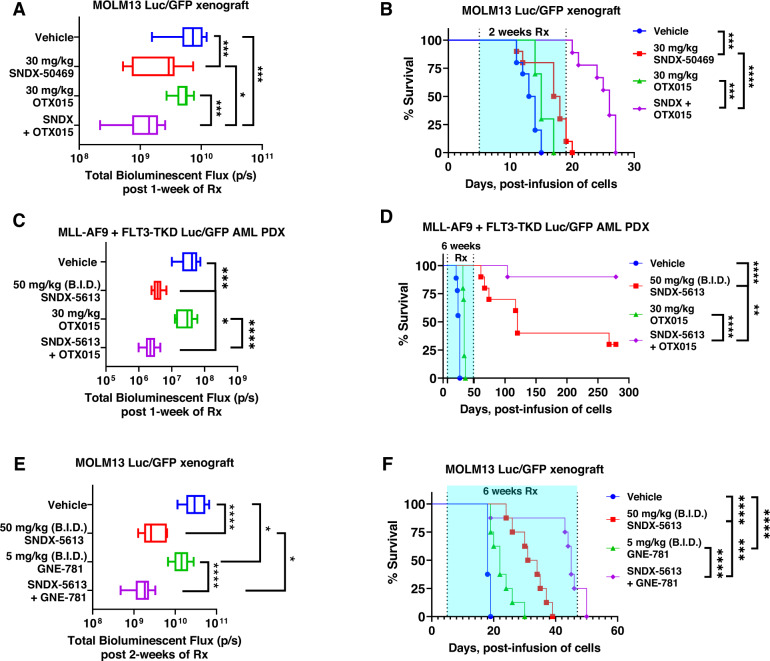
Monotherapy with Menin inhibitor (MI), e.g., SNDX-5613, induces clinical remissions in patients with relapsed/refractory AML harboring MLL1-r or mtNPM1, but most patients either fail to respond or eventually relapse. Utilizing single-cell RNA-Seq, ChiP-Seq, ATAC-Seq, RNA-Seq, RPPA, and mass cytometry (CyTOF) analyses, present pre-clinical studies elucidate gene-expression correlates of MI efficacy in AML cells harboring MLL1-r or mtNPM1. Notably, MI-mediated genome-wide, concordant, log2 fold-perturbations in ATAC-Seq and RNA-Seq peaks were observed at the loci of MLL-FP target genes, with upregulation of mRNAs associated with AML differentiation. MI treatment also reduced the number of AML cells expressing the stem/progenitor cell signature. A protein domain-focused CRISPR-Cas9 screen in MLL1-r AML cells identified targetable co-dependencies with MI treatment, including BRD4, EP300, MOZ and KDM1A. Consistent with this, in vitro co-treatment with MI and BET, MOZ, LSD1 or CBP/p300 inhibitor induced synergistic loss of viability of AML cells with MLL1-r or mtNPM1. Co-treatment with MI and BET or CBP/p300 inhibitor also exerted significantly superior in vivo efficacy in xenograft models of AML with MLL1-r. These findings highlight novel, MI-based combinations that could prevent escape of AML stem/progenitor cells following MI monotherapy, which is responsible for therapy-refractory AML relapse.


Conflict of interest statement

GMM is an employee of Syndax Pharmaceuticals. KNB has received research funding from Iterion, Foghorn, and Nurix Pharmaceuticals, and he serves as a consultant for Iterion Therapeutics, none of which are directly related to the content of this paper. All other authors declare they have no conflict of interests to disclose.

Figures

Fig. 1
Fig. 1. CRISPR-mediated depletion of Menin increases sensitivity to treatment with BET inhibitor or LSD1 inhibitor in AML cells.
A MOLM13 cells were transfected with sgRNA against Exon 2 or Exon 6 of Menin or a negative control sgRNA (sg Ctrl) and incubated for 5 days. Then, total cell lysates were prepared and immunoblot analyses were conducted. The expression levels of GAPDH served as the loading control. Representative blots of two independent experiments are shown. B Densitometry analysis of Menin and MLL target gene immunoblots following sgRNA-mediated depletion of Menin in MOLM13 cells (from two independent experiments). *p < 0.05; ***p < 0.005 compared to sg Ctrl (determined by a two-tailed, unpaired t test). C MOLM13 cells were transfected with sg Ctrl or sg Menin Ex2 or Ex6 and incubated for 5 days. Total cell numbers in each condition (plated in duplicate) were counted using a Countess II automated cell counter. Mean of two independent experiments performed in duplicate ± S.D. ***p < 0.005 compared to sg Ctrl-transfected MOLM13 cells (determined by a two-tailed, unpaired t test). D MOLM13 were transfected with sg Ctrl or sg Menin Ex2 or Ex6 and incubated for 7 days. Cells were cytospun onto glass slides and stained with hematoxylin and eosin. The % of differentiated cells (myelocytes and metamyelocytes) were determined utilizing light microscopy. Columns, mean of two independent experiments performed in duplicate; Bars, Standard error of the mean (S.E.M). ****p < 0.001 compared to sg Ctrl-transfected MOLM13 cells (determined by a two-tailed, unpaired t test). E Representative images of sg Ctrl and sg Menin Ex2 or Ex6-induced morphologic differentiation in MOLM13 cells 7 days post-transfection. F MOLM13 cells were transfected with sg Ctrl or sg Menin Ex2 or Ex6 and incubated for 72 h. Then, cells were treated with the indicated concentrations of OTX015 for 48 h. The % of annexin V-positive, apoptotic cells were determined by flow cytometry. Mean of two independent experiments performed in duplicate ± S.D. ***p < 0.005 compared to sg Ctrl-transfected MOLM13 cells (determined by a two-tailed, unpaired t test). G MOLM13 cells were transfected with sg Ctrl or sg Menin Ex2 or Ex6 and incubated for 72 h. Following this, cells were treated with the indicated concentrations of INCB059872 for 96 h. The % of TO-PRO-3 iodide-positive, non-viable cells were determined by flow cytometry. Mean of two independent experiments performed in duplicate ± S.D. ***p < 0.005 compared to sg Ctrl-transfected MOLM13 cells (determined by a two-tailed, unpaired t test).
Fig. 2
Fig. 2. Treatment with Menin inhibitor depletes chromatin accessibility in MLL fusion target genes and Beta Catenin target genes in MLL-r AML and mtNPM1 expressing AML cells.
A MV4-11, OCI-AML3, and MOLM13 cells were treated with the indicated concentrations of SNDX-50469 for 16 h. At the end of treatment, cells were used for ATAC-Seq analysis. Graph shows the average (of 2 replicates) of gained and lost transposase-accessible peaks. B Transcription factor binding motifs decreased in the lost ATAC peaks in MOLM13, OCI-AML3, and MV4–11 cells treated with 500 nM of SNDX-50469 for 16 h. C, D Log2 fold-change in chromatin accessibility (ATAC peaks) in MLL fusion target genes in MOLM13 and MV4–11 cells. E Transcription factor binding motifs decreased in the lost ATAC peaks in PD, MLL-AF9 + FLT3-TKD AML cells treated with 500 nM of SNDX-50469 for 16 h determined by single-cell ATAC-Seq analysis. F Log2 fold-change in chromatin accessibility (ATAC peaks) in MLL fusion target genes in PD, MLL-AF9 + FLT3-TKD AML cells as determined by single cell (sc) ATAC-Seq analysis.
Fig. 3
Fig. 3. Treatment with Menin inhibitor concordantly depletes chromatin accessibility and mRNA expression in MLL-r AML cells.
A Volcano plot of RNA-Seq-determined mRNA expression changes in MOLM13 cells treated with the indicated concentration of SNDX-50469 for 16 h. B Gene set enrichment analysis of SNDX-50469 treated MOLM13 cells compared to selected MLL-focused and HALLMARK data sets from MSIGDB. All q-values were less than 0.1. C Enrichment plots of SNDX-50469-treated MOLM13 cells with ROSS_LEUKEMIA_WITH_MLL_FUSIONS and HESS_TARGETS_HOXA9_AND_MEIS1_UP. D, E Circos plot and log2 fold-change of selected concordant ATAC-Seq and mRNA expression alterations in SNDX-50469-treated MOLM13 cells.
Fig. 4
Fig. 4. Menin inhibitor depletes MLL fusion target gene mRNA and induces differentiation associated mRNA expressions at the single-cell level in PD, MLL1-r AML cells.
A UMAP plot of clustered gene expressions determined by single cell RNA-Seq analysis in PD, MLL-AF9 + FLT3-TKD cells treated with 500 nM of SNDX-50469 for 16 h. Based on similarities of cluster marker gene expressions, cells in cluster 1, 5, 7, and 8 were designated as myeloid progenitor cells utilizing the SingleR algorithm. The boundary of each cluster is outlined in black. B GSVA analysis of SNDX-50469-treated MLL-AF9 + FLT3-TKD AML mRNA expression changes against HALLMARK pathways. C Average log2 fold-change in significantly altered mRNAs in SNDX-50469-treated MLL-AF9 + FLT3-TKD AML cells determined by single-cell RNA-Seq analysis. D UMAP plot of selected MLL1 fusion target gene expressions at the single cell level in SNDX-50469-treated MLL-AF9 + FLT3-TKD AML cells.
Fig. 5
Fig. 5. Co-treatment with Menin inhibitor and BETi OTX015 induces synergistic in vitro lethality in MLL1-r and mtNPM1-expressing AML cells.
A MOLM13-Cas9 expressing cells were transduced (biologic replicates) with a library of domain-specific sgRNAs against chromatin modifying proteins and incubated for 8 days. Then, 500 nM of SNDX-50469 was added and the cells were incubated for an additional 96 h. Live cells were harvested; genomic DNA was isolated and minimally amplified with primers flanking the sgRNA sequences. Sequencing libraries were generated and amplicon-seq was performed. The graph shows log2 fold-change in sgRNAs which dropped out significantly (p < 0.05 and f.d.r. <0.05) more due to treatment with SNDX-50469 than control cells at day 12 post-transduction in both replicates. B MOLM13 cells were transfected with RNPs containing sg Ctrl or BRD4 sgRNAs and incubated for 5 days. At the end of treatment, cells were harvested and immunoblot analysis was conducted as indicated. The expression levels of β-Actin in the lysates served as the loading control. C MOLM13 cells were transfected with RNPs containing sg Ctrl or BRD4 sgRNAs and incubated for 3 days. Then, cells were treated with the indicated concentrations of SNDX-50469 for 96 h. The % of TO-PRO-3 iodide-positive, non-viable cells were determined by flow cytometry. Columns, mean of three independent experiments; Bars, S.E.M. *p < 0.05, p < 0.01, ***p < 0.005 and ****p < 0.001 compared to sg Ctrl transfected cells treated with SNDX-50469 for 96 h (determined by a two-tailed, unpaired t test in GraphPad V9). DF MOLM13, MV4–11 and OCI-AML3 cells were treated with the indicated concentrations of SNDX-50469 and/or OTX015 for 96 h. At the end of treatment, the % non-viable cells were determined by staining with TO-PRO-3 iodide and flow cytometry analysis. Delta synergy scores were determined by the ZIP method within the SynergyFinder V2.0 web application. Synergy scores >1.0 indicate a synergistic interaction of the two agents in the combination. G, H Patient-derived AML cells with MLL1-r and FLT3-TKD (#4) or mtNPM1 and FLT3-ITD (#1) were treated with the indicated concentrations of SNDX-50469 and/or OTX015 for 72 h. At the end of treatment, the % non-viable cells were determined by staining with TO-PRO-3 iodide and flow cytometry analysis. Delta synergy scores were determined by the ZIP method within the SynergyFinder V2.0 web application. Synergy scores >1.0 indicate a synergistic interaction of the two agents in the combination. IK MV4–11, OCI-AML3, and MOLM13 cells were treated with the indicated concentrations of SNDX-50469 and/or ABBV-744 for 96 h. At the end of treatment, the % non-viable cells were determined by staining with TO-PRO-3 iodide and flow cytometry analysis. Delta synergy scores were determined by the ZIP method within the SynergyFinder V2.0 web application. Synergy scores >1.0 indicate a synergistic interaction of the two agents in the combination.
Fig. 6
Fig. 6. Compared to SNDX-50469 alone, co-treatment with SNDX-50469 and OTX015 further reduces H3K27Ac occupancy on chromatin, alters the super enhancer landscape, transcriptome and proteome in MLL1-r MOLM13 cells and PD, mtNPM1 expressing AML cells.
A MOLM13 cells were treated with 500 nM of SNDX-50469 or SNDX-50469 plus 500 nM of OTX015 for 16 h. H3K27Ac ChIP-Seq analysis was conducted. Tag density plots and heat maps of H3K27Ac peaks genome-wide are shown for each treatment. B Ranked ordering of super enhancers (ROSE) analysis in MOLM13 cells treated with SNDX-50469 alone or in combination with OTX015, as described in A. C MOLM13 cells were treated with 500 nM of SNDX-50469 and/or 500 nM of OTX015 for 16 h. RNA-Seq analysis was performed. Log2 fold-changes in selected, significantly altered (p < 0.05) leukemia relevant genes are shown. D Enrichment plots comparing the mRNA expression signature of SNDX-50469 + OTX015 over SNDX-50469 to HESS_TARGETS_HOXA9_AND_MEIS1_UP and HALLMARK_MYC_TARGETS_V2 gene sets. E, F MOLM13 cells were treated in biologic triplicates with 500 nM of SNDX-50469 alone for 48 h or with OTX015 added in the last 24 h of incubation. Cells were harvested and reverse phase protein array analysis was conducted. The heat map shows the total number of significantly (p < 0.05) up and down-regulated proteins in each cell sample due to combination treatment over single agent SNDX-50469 treatment. The volcano plot highlights the most significantly altered proteins in each cell sample due to combination treatment over single agent SNDX-50469 treatment. G Patient-derived AML cells were treated with 1000 nM of SNDX-50469 alone, and in combination with 500 nM of OTX015 for 16 h. Cells were harvested and analyzed by CyTOF analysis utilizing a cocktail of rare metal element-tagged antibodies. Leukemia stem cells were defined by high expression of CLEC12A, CD123, CD244, CD99 and CD33 but low expression of CD11b. Heat map shows the absolute fold change of significantly altered protein expressions in the treated over control for each sample.
Fig. 7
Fig. 7. Treatment with Menin inhibitor-based combinations reduces leukemia burden and significantly improves median and overall survival of NSG mice bearing MLL-r AML xenografts.
A Total photon counts [flux] (determined by bioluminescent imaging) in NSG mice (n = 10 per cohort) engrafted with MOLM13 Luc/GFP cells and treated for 1 week with SNDX-50469 and/or OTX015 at the indicated doses. B Kaplan–Meier survival plot of NSG mice engrafted with MOLM13 Luc/GFP cells and treated with SNDX-50469 (30 mg/kg, daily × 5 days, P.O.) and/or 30 mg/kg of OTX015 (daily × 5 days, P.O.) for 2 weeks. Significance was calculated by a Mantel–Cox log-rank test. C Total photon counts [flux] (determined by bioluminescent imaging) in NSG mice (n = 10 per cohort) engrafted with PD, MLL-AF9 + FLT3-TKD Luc/GFP AML cells and treated with vehicle, SNDX-5613 and/or OTX015 at the indicated doses for 1 week. D Kaplan–Meier survival plot of NSG mice engrafted with PD, MLL-AF9 + FLT3-TKD Luc/GFP AML cells and treated with SNDX-5613 (50 mg/kg B.I.D. × 5 days, P.O.) and/or OTX015 (30 mg/kg, daily × 5 days, P.O.) for 6 weeks. Significance was calculated by a Mantel–Cox log-rank test. *p < 0.05, **p < 0.01, ***p < 0.005, ****p < 0.001. E Total photon counts [flux] (determined by bioluminescent imaging) in NSG mice (n = 10 per cohort) engrafted with MOLM13 Luc/GFP cells and treated for 2 weeks with vehicle, SNDX-5613 and/or GNE-781 at the indicated doses. *p < 0.05, ****p < 0.001 determined by a two-tailed, unpaired t test in GraphPad V9. F Kaplan–Meier survival plot of NSG mice engrafted with MOLM13 Luc/GFP cells and treated with SNDX-5613 (50 mg/kg B.I.D. × 5 days, P.O.) and/or 5 mg/kg of GNE-781 (B.I.D. × 5 days, P.O.) for 6 weeks. Significance was calculated by a Mantel–Cox log-rank test. ***p < 0.005, ****p < 0.001 compared to vehicle or either single agent.

References

    1. Matkar S, Thiel A, Hua X. Menin: a scaffold protein that controls gene expression and cell signaling. Trends Biochem Sci. 2013;38:394–402. - PMC - PubMed
    1. Yokoyama A, Cleary ML. Menin critically links MLL proteins with LEDGF on cancer-associated target genes. Cancer Cell. 2008;14:36–46. - PMC - PubMed
    1. Murai MJ, Chruszcz M, Reddy G, Grembecka J, Cierpicki T. Crystal structure of menin reveals binding site for mixed lineage leukemia (MLL) protein. J Biol Chem. 2011;286:31742–8. - PMC - PubMed
    1. Yu BD, Hanson RD, Hess JL, Horning SE, Korsmeyer SJ. MLL, a mammalian trithorax-group gene, functions as a transcriptional maintenance factor in morphogenesis. Proc Natl Acad Sci USA. 1998;95:10632–6. - PMC - PubMed
    1. Li X, Song Y. Structure, function and inhibition of critical protein-protein interactions involving mixed lineage leukemia 1 and its fusion oncoproteins. J Hematol Oncol. 2021;14:56. - PMC - PubMed

Publication types

MeSH terms