. 2023 Apr 13;14(1):2103.
doi: 10.1038/s41467-023-37859-1.

East Gobi megalake systems reveal East Asian Monsoon dynamics over the last interglacial-glacial cycle

Affiliations

East Gobi megalake systems reveal East Asian Monsoon dynamics over the last interglacial-glacial cycle

Hongwei Li et al. Nat Commun. .

Abstract

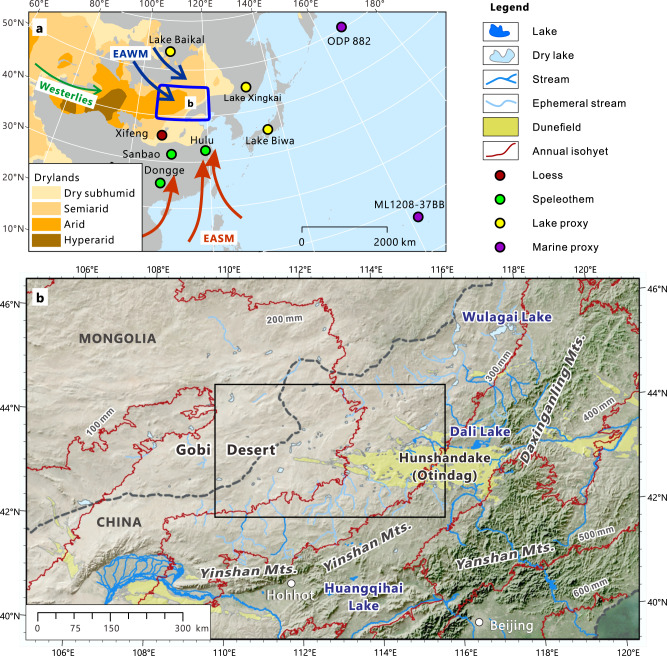
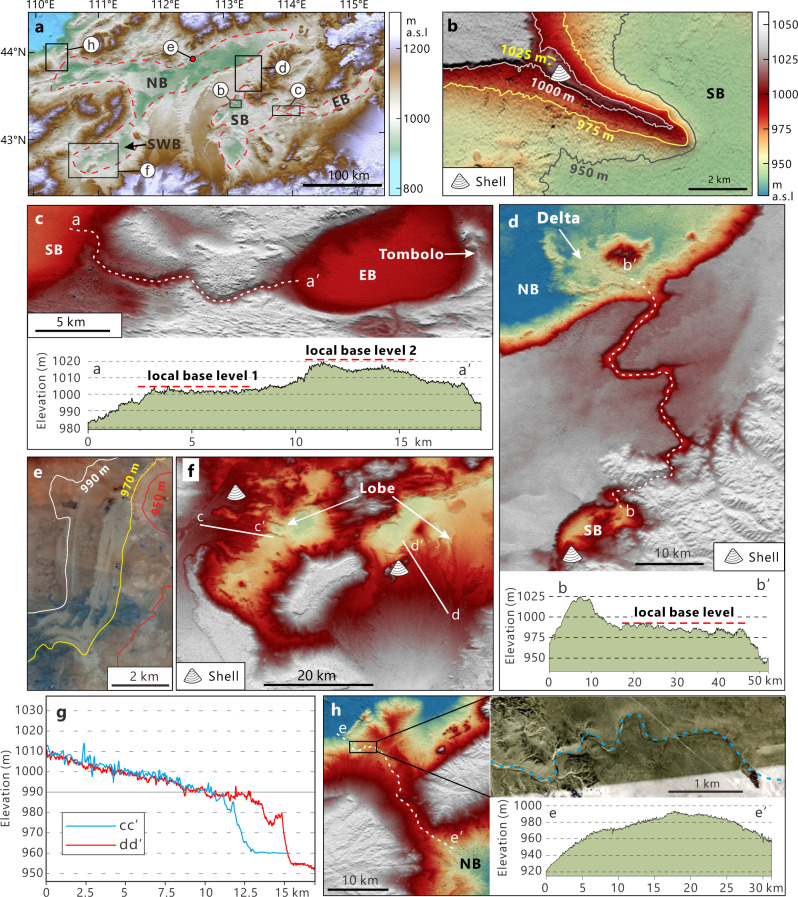
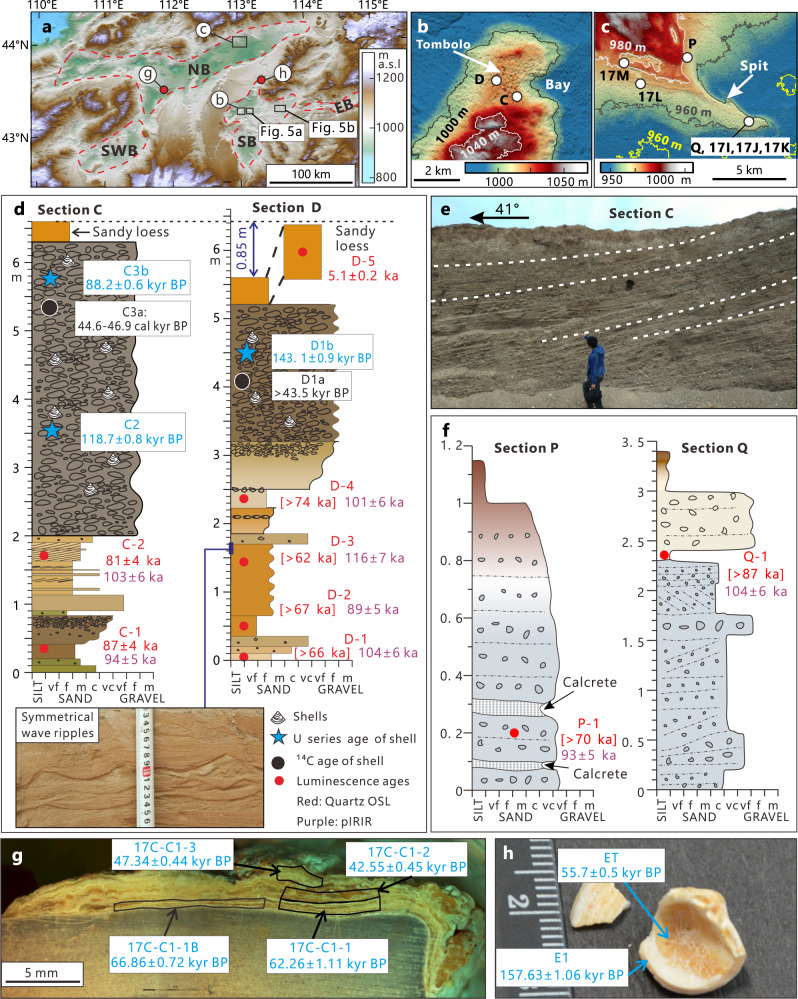
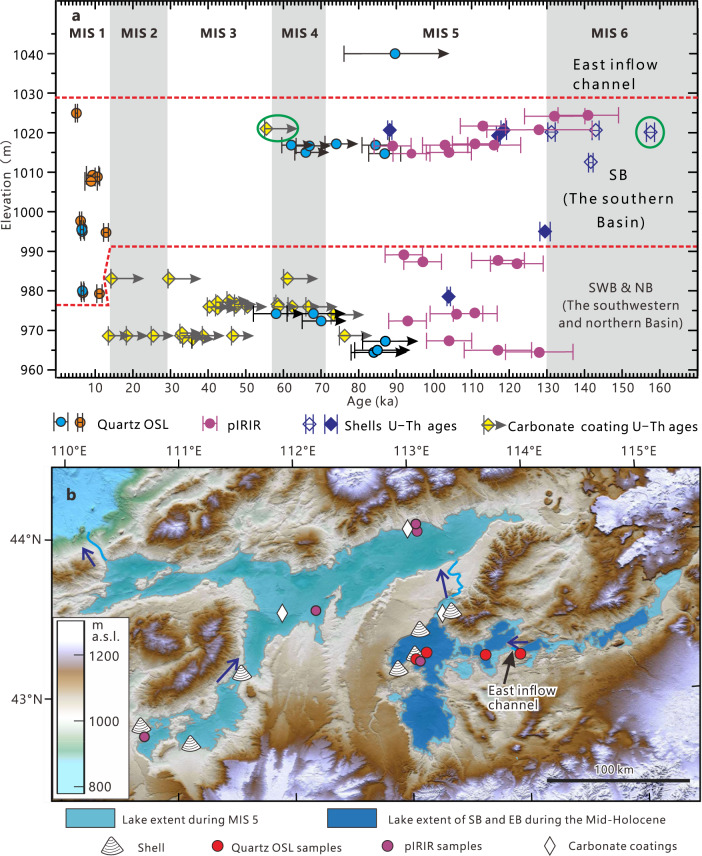
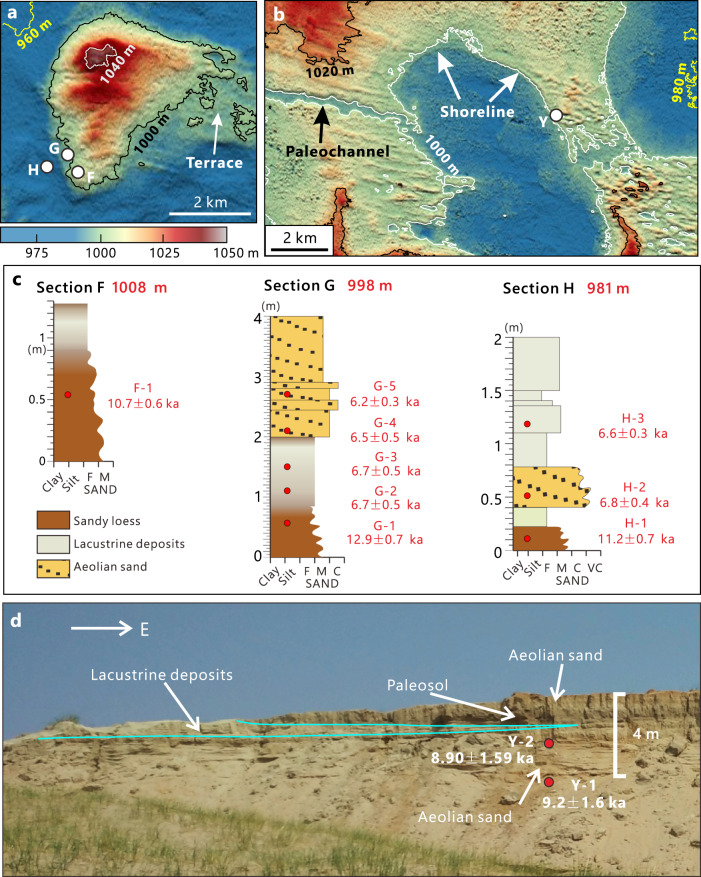
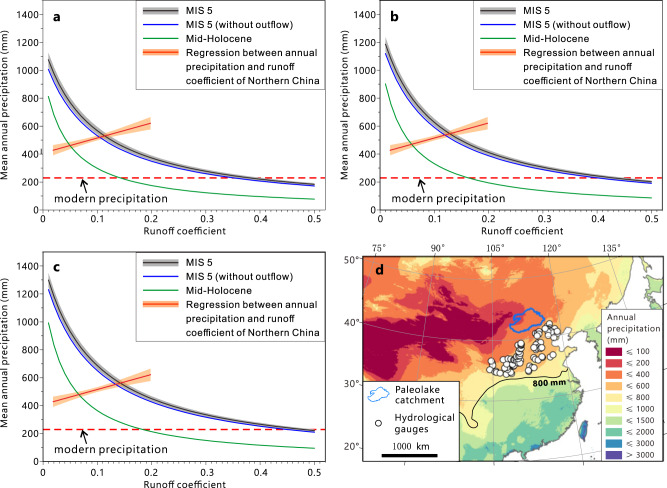
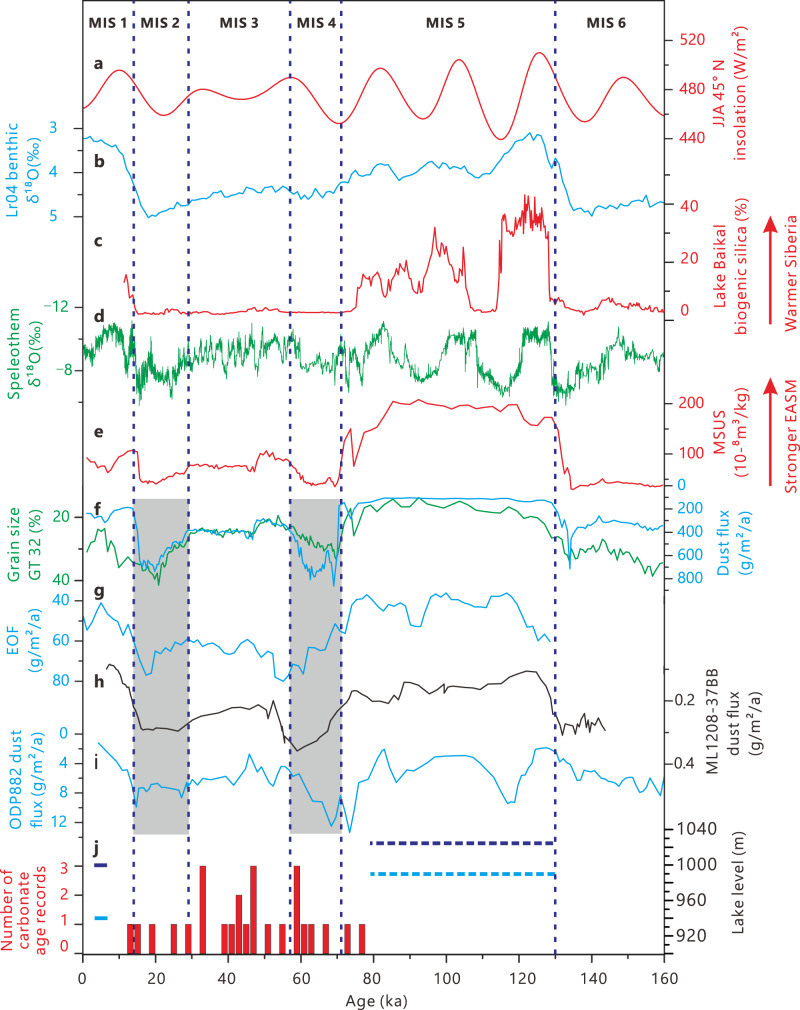
Intense debate persists about the timing and magnitude of the wet phases in the East Asia deserts since the late Pleistocene. Here we show reconstructions of the paleohydrology of the East Gobi Desert since the last interglacial using satellite images and digital elevation models (DEM) combined with detailed section analyses. Paleolakes with a total area of 15,500 km2 during Marine Isotope Stage 5 (MIS 5) were identified. This expanded lake system was likely coupled to an 800-1000 km northward expansion of the humid region in East China, associated with much warmer winters. Humid climate across the Gobi Desert during MIS 5 likely resulted in a dustier MIS 4 over East Asia and the North Pacific. A second wet period characterized by an expanded, albeit smaller, lake area is dated to the mid-Holocene. Our results suggest that the East Asian Summer Monsoon (EASM) might have been much weaker during MIS 3.


Conflict of interest statement

The authors declare no competing interests.

Figures

Fig. 1
Fig. 1. Hydroclimatic context of the East Gobi Desert.
a Map of the East Gobi Desert showing its location within the northern mid-latitude dryland system. Prevailing winds of the East Asian Winter Monsoon (EAWM), East Asian Summer Monsoon (EASM), and the Westerlies are also indicated. Circles with different colors refer to other paleoenvironment records mentioned in the paper. b Topography and present drainage network of the East Gobi Desert (Drainage network data from ref. ). Study area shown by the black rectangle. Mean annual precipitation for 1970-2000 (WorldClim Version 2) is also plotted (red lines).
Fig. 2
Fig. 2. Elevation data illustrating geomorphic evidence of a paleolake system and drainage network of the East Gobi Desert.
a Topography of the study area derived from the SRTM-3 DEM (digital elevation model, 90 m resolution). The extents of four sub-basins, i.e. eastern basin (EB), southern basin (SB), northern basin (NB), and southwestern basin (SWB) are indicated by dashed polygons. Black boxes delineate areas of higher resolution (ALOS World 3D 30 m resolution) DEM data shown in panels (bd), (f) and (h). b Spit extending from the north shore of the SB. c DEM shows the paleochannel connecting the EB and SB. The longitudinal profile of the channel (a-a’) shows a stepped-bed morphology, implying the local base levels (~1000 m and ~1020 m) change. d The upper panel shows a channel connecting the SB and the NB sub-basins and the delta situated at the mouth of the paleochannel. The lower panel shows the longitudinal profile (b-b’) of this channel. e Sentinel-2A satellite image showing beach shorelines of the NB. f Gilbert-type fan delta feature at the southern SWB. Their cross profiles (c-c’ and d-d’) are shown in panel (g). Note that they all show a slope break at ~990 m. h Outflow channel of NB (left). Upper right panel- Google Earth image showing the meander feature (dashed blue line) near the mouth of the paleochannel. Lower right panel- Longitudinal profile (e-e’) of the channel with a maximum elevation of ~990 m.
Fig. 3
Fig. 3. Sedimentary evidence and chronology of the East Gobi paleolake system.
a Topography of the study area derived from the SRTM-3 DEM. Black boxes delineate areas of higher resolution (ALOS World 3D 30 m) DEM data shown in panels b, c and red circles indicate sampling sites shown in panels (g, h). b ALOS World 3D 30 m resolution DEM showing the topography of the area around sections C and D. Sections C and D are on the east and west side of a tombolo, respectively. c ALOS World 3D 30 m resolution DEM showing the topography of a spit along the northern coast of the NB. The locations of the sections are indicated by white circles. d Stratigraphy and chronology of the beach deposits from sections C and D in the SB sub-basin. The quartz OSL (optically stimulated luminescence) ages with De (equivalent dose) values >150 Gy are enclosed in square brackets and indicate minimum ages. e Photo showing the bed structure (at 2.5–6 m) of section C dipping to the NE. f Stratigraphy and chronology of beach deposits from sections P and Q in NB. The quartz OSL ages with De values >150 Gy are enclosed in square brackets and indicate minimum ages. g Polished slab of a coastal pebble showing sampled inner rinds (outlined by the black boxes) and resulting U series ages. h Corbicula fluminea shell with yellowish carbonate coating precipitated on the inner surface of the shell visible. U series ages of the shell and its coating are also shown. Scale divisions are in mm. The photo was taken after the shell was sampled for U series dating. Note that the shell was well preserved originally with an ~2 mm thick carbonate coating inside and was broken in the laboratory for sampling. The vf very fine, f fine, m medium, c coarse, vc very coarse in panels (d) and (f) stand for the grain size of sand and gravels.
Fig. 4
Fig. 4. Chronology and extent of MIS 5 and mid-Holocene paleolakes.
a Paleolake age estimated by different dating methods. The blue/purple circles show the quartz (OSL)/K-feldspar (post-infra-red infrared stimulated luminescence, pIRIR) luminescence ages of shoreline deposits in the SB and NB, with the 1-sigma uncertainty represented by the vertical bars; quartz OSL ages for aeolian deposits from shorelines are represented by orange circles (Supplementary Tables 3 and 4). The arrows to the right of the blue circle indicate that these quartz OSL dates are considered to be minimum ages because De values ≥150 Gy are measured. Dark blue and yellow diamonds represent U-Th ages of shells and pedogenic carbonate coatings, respectively (2-sigma errors indicated by left side vertical bars, Supplementary Table 2). The open diamonds indicate overestimated U-Th ages of the shells due to carbonate re-crystallization, whereas the arrows at carbonate coatings U-Th ages represent the minimum age estimation of the shoreline formation. The green circles show the age of a shell and its carbonate coating (Fig. 3h). b Map showing sampling sites and lake extents in the study area during MIS 5 and the mid-Holocene. The blue arrows indicate flow directions between the different basins.
Fig. 5
Fig. 5. Holocene paleolake records in the SB.
a, b ALOS AW3D DEM data showing the locations of sections and surrounding topography (Fig. 3a for the locations of the two panels). Sections F, G and H are situated on the southwest side of a former island. Lacustrine deposits have been found in all three sections and are located at different elevations. Beach ridges are visible at ~1000 m in panel (b). c The stratigraphy and OSL chronology of sections F, G, and H. Note the lacustrine layer thins with increasing elevation. d Photo of Section Y showing its stratigraphy and OSL chronology. Note that the lacustrine layer thins to the east. The stratigraphy is in concord with its position and the surrounding topography.
Fig. 6
Fig. 6. Precipitation reconstructions.
ac Annual precipitation of different periods estimated by a water balance model with different lake evaporation rates: a 900 mm/yr, b 1000 mm/yr, c 1100 mm/yr. The black and blue lines represent conditions when the NB reached its highest stand with and without outflow from the lake system through the meander (Fig. 2h), respectively. The gray shaded area shows the uncertainties caused by meander outflow volume estimation (95% confidence level) (Supplementary Fig. 9; Supplementary Table 5). The mid-Holocene precipitation is shown by the green line. The red line is the linear regression between mean annual precipitation and runoff coefficient of northern China, with the 95% confidence interval shown by the orange shade (see methods and Supplementary Fig. 10). Modern annual precipitation of the study area is ~230 mm (the red dashed line). d Map showing modern precipitation (Source: WorldClim Version 2.0), the location of the paleolake catchment (blue framed polygon) and the hydrological gauges used for precipitation-runoff coefficient regression.
Fig. 7
Fig. 7. Records from this study compared against other proxy and forcing time series.
a Summer (June to August) insolation at 45 °N, b δ18O record of LR04 benthic stack, (c) Lake Baikal biogenic silica record, d Composite stalagmite oxygen isotope data from south China. e, f Magnetic susceptibility (e), grain size data (f) shown by greater than 32 μm fraction (GT 32, green) and dust flux (blue) of the loess-paleosol sequence from Xifeng, North China. g Eolian quartz flux (EOF) from Biwa Lake sediments. h, i Dust flux records from the Pacific, . j Reconstructed lake levels from the SB (dark blue) and the NB (light blue) and frequency diagram of carbonate coating age records (red bars) as documented in this study (Fig. 1a for locations).

Similar articles

Cited by

References

    1. Williams M. Climate Change in Deserts: Past, Present, and Future. Cambridge: Cambridge University Press; 2014.
    1. Reynolds JF, et al. Global desertification: Building a science for dryland development. Science. 2007;316:847–851. doi: 10.1126/science.1131634. - DOI - PubMed
    1. Choobari OA, Zawar-Reza P, Sturman A. The global distribution of mineral dust and its impacts on the climate system: A review. Atmos. Res. 2014;138:152–165. doi: 10.1016/j.atmosres.2013.11.007. - DOI
    1. Sun Y, et al. Tracing the provenance of fine-grained dust deposited on the central Chinese Loess Plateau. Geophys. Res. Lett. 2008;35:L01804. doi: 10.1029/2007GL031672. - DOI
    1. Lu H, et al. Formation and evolution of Gobi Desert in central and eastern Asia. Earth-Sci. Rev. 2019;194:251–263. doi: 10.1016/j.earscirev.2019.04.014. - DOI